
Digital Badges Market Size and Share
Market Overview
| Study Period | 2020 - 2031 |
|---|---|
| Market Size (2026) | USD 278.07 Million |
| Market Size (2031) | USD 613.43 Million |
| Growth Rate (2026 - 2031) | 17.18% CAGR |
| Fastest Growing Market | Asia Pacific |
| Largest Market | North America |
| Market Concentration | Medium |
Major Players *Disclaimer: Major Players sorted in no particular order Image © Mordor Intelligence. Reuse requires attribution under CC BY 4.0. | |
Digital Badges Market Analysis by Mordor Intelligence
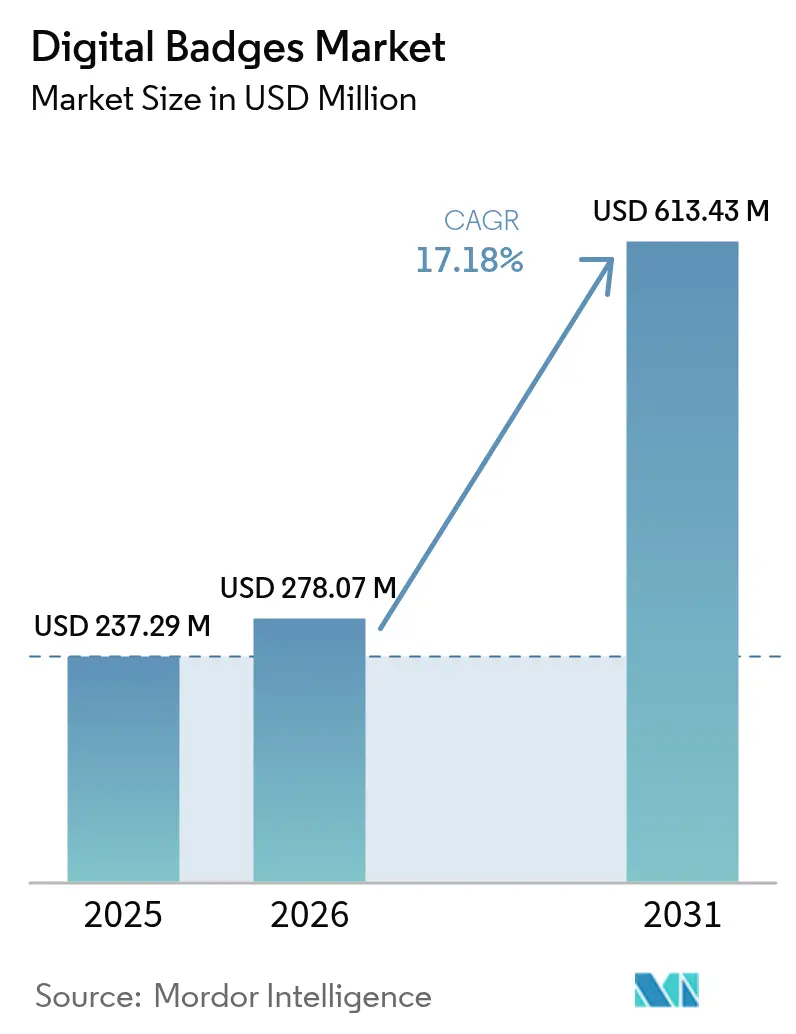
The digital badges market size is expected to grow from USD 237.29 million in 2025 to USD 278.07 million in 2026 and is forecast to reach USD 613.43 million by 2031 at 17.18% CAGR over 2026-2031. Momentum comes from employers’ heightened demand for verifiable skill evidence, higher-education institutions’ pivot toward micro-credentials, and government-backed upskilling grants that lower program costs. Platform vendors now embed blockchain verification to cut fraud incidents in half while meeting stringent data-privacy rules such as GDPR and FERPA.[1]VerifyEd, “What Is a Shareable Certificate?,” VerifyEd, verifyed.io Vendors that align with the Open Badges 3.0 specification benefit from cross-platform recognition, accelerating ecosystem expansion.[2]1EdTech, “New Open Badges 3.0 Standard Provides Enhanced Security and Mobility,” 1EdTech, 1edtech.org Implementation complexity lingers in institutions that run legacy LMSs, though specialized integration services are narrowing the gap. Overall, the digital badges market is evolving from early experimentation to large-scale, skills-based credentialing strategies.
Key Report Takeaways
- By offering, Platforms led with 67.85% of the digital badges market share in 2025, whereas Services-most notably Integration & Implementation-are advancing at a 21.26% CAGR through 2031.
- By credential type, Participation badges held a 42.15% revenue share in 2025, while Skill badges are set to expand at a 22.6% CAGR to 2031.
- By deployment mode, cloud solutions commanded 78.40% of the digital badges market size in 2025; on-premise deployments are progressing at a 11.9% CAGR in regulated sectors.
- By end user, Academic institutions accounted for 54.70% of the digital badges market size in 2025; small and mid-sized enterprises (SMEs) are moving fastest at a 19.1% CAGR.
- By region, North America maintained 39.75% revenue share in 2025, whereas Asia-Pacific exhibits the quickest regional CAGR at 20.9% between 2026-2031.
Note: Market size and forecast figures in this report are generated using Mordor Intelligence’s proprietary estimation framework, updated with the latest available data and insights as of 2026.
Global Digital Badges Market Trends and Insights
Drivers Impact Analysis*
| Driver | (~) % Impact on CAGR Forecast | Geographic Relevance | Impact Timeline |
|---|---|---|---|
| Rapid adoption of stackable micro-credentials in U.S. higher-ed | +4.2% | North America; spillover into Europe & Australia | Medium term (2-4 years) |
| Government-funded workforce upskilling grants in Europe | +3.8% | EU, United Kingdom, Canada | Medium term (2-4 years) |
| Mandatory continuing-education proof in regulated professions | +3.5% | Global; strongest in North America & Europe | Short term (≤2 years) |
| Corporate L&D shift toward skills-based hiring in Asia | +2.9% | China, India, Japan, South Korea | Medium term (2-4 years) |
| Interoperability standards (Open Badges 3.0, W3C-VC) catalyzing vendor ecosystem | +2.1% | Global; early uptake in North America & Europe | Short term (≤2 years) |
| Gamified engagement driving K-12 adoption in North America | +1.8% | North America; emerging in Europe & Australia | Medium term (2-4 years) |
| Source: Mordor Intelligence | |||
Rapid Adoption of Stackable Micro-Credentials in U.S. Higher-Ed
Eight in ten U.S. institutions plan to embed micro-credentials by 2029, citing stronger job placement outcomes and improved institutional branding. Surveys show 97% of academic leaders link micro-credentials to positive career results for graduates. Stackable paths let learners accumulate discrete skills that count toward larger qualifications while remaining visible to employers. The University of Arizona now issues digital badges across engineering, business, and public health programs, enabling graduates to showcase competencies directly on LinkedIn.[3]University of Arizona, “Micro-Credentials & Digital Badges,” University of Arizona, arizona.edu Learner demand is amplifying the signal: 90% of students rate micro-credentials as highly valuable additions to their résumés.
Rise of Government-Funded Workforce Upskilling Grants in Europe
The EU Digital Education Action Plan commits public funds to closing the continent’s skills gap, where 37% of workers still lack basic digital abilities. France’s Mon Compte Formation and Germany’s Skills Strategy distribute micro-credential vouchers to individual learners, stimulating demand for verified badges. Erasmus+ has mobilized 28 partners in 13 EU states to integrate sustainability skills into digital badge coursework. Providers that map badges to the upcoming European Digital Skills Certificate gain recognition across borders, shortening graduate time-to-hire in green-tech and AI job clusters.
Mandatory Continuing-Education Proof in Regulated Professions
Healthcare, accounting, and legal regulators now require verifiable evidence of ongoing education, prompting mass migration from paper certificates to secure badges. Southern New Hampshire University’s nursing school cut credential-verification costs by 70-90% after digitization.[4]Southern New Hampshire University, “CE for Nurses Online,” Southern New Hampshire University, snhu.eduA hospital network that implemented badges for medical specialty refreshers reduced administrative work by 76% within one year. Professionals value the portability: verified badges integrate into licensing portals and social profiles, creating real-time compliance dashboards for regulators.
Corporate L&D Shift Toward Skills-Based Hiring in Asia
Asian employers adopt badge-backed hiring to combat talent shortages in cloud computing, ESG reporting, and AI. PwC issued more than 7,000 badges to staff across China, India, and Southeast Asia, embedding digital credentials within promotion criteria. Local SMEs mirror the strategy to compete against multinationals, valuing badges that assert precisely defined abilities. Blockchain-anchored verification gains traction in Japan and South Korea, where banks and insurers require tamper-proof audit trails.
Restraints Impact Analysis*
| Restraint | (~) % Impact on CAGR Forecast | Geographic Relevance | Impact Timeline |
|---|---|---|---|
| Fragmented IT system integration for legacy LMSs | -2.3% | Global; highest where infrastructure is dated | Medium term (2-4 years) |
| Badge fraud & verification cost overruns | -1.9% | Global; pronounced in fast-growth regions | Short term (≤2 years) |
| Limited broadband access in rural Africa & South Asia | -1.6% | Africa, South Asia; pockets in developed markets | Long term (≥4 years) |
| Data-privacy compliance burden (GDPR, FERPA) | -1.4% | Europe, North America; global for multinationals | Medium term (2-4 years) |
| Source: Mordor Intelligence | |||
Fragmented IT System Integration for Legacy LMSs
Roughly 60% of higher-education IT departments report moderate to severe difficulty connecting badge APIs with decade-old LMS platformsk. In multi-campus systems, integration projects grow further complicated by student-information systems, alumni databases, and third-party job boards. These hurdles extend roll-outs, raising budgets and delaying user uptake. Specialist integrators address the pain point through middleware and pre-built connectors, yet many institutions defer full adoption until aging LMS contracts lapse.
Badge Fraud & Verification Cost Overruns
Sophisticated forgery attempts pressure issuers to strengthen security layers. While blockchain pilots reduced fraud incidents by 50%, upfront deployment costs remain prohibitive for smaller colleges. Large public universities running hundreds of thousands of credentials each year face rising cloud-verification bills and continual security audits. The expense is most acute in high-stakes credentials-think aviation or critical-care nursing-where verification failures carry public-safety consequences.
*Our forecasts treat driver/restraint impacts as directional, not additive. The impact forecasts reflect baseline growth, mix effects, and variable interactions.
Segment Analysis
By Offering: Integration Services Outpace Platform Growth
Platforms retained 67.85% of the digital badges market share in 2025, reflecting their early-mover advantage in badge issuance and management. Services, however, are scaling at a 21.26% CAGR as clients seek bespoke roll-outs that align with existing HR and academic workflows. Consulting specialists advise on program design, metadata standards, and outcome measurement, while Support & Maintenance teams ensure long-term reliability. This service-led acceleration demonstrates how institutions increasingly view badges as change-management initiatives rather than stand-alone software purchases. As a result, the digital badges market continues to diversify into ecosystem roles that monetize expertise beyond core platforms.
The growth gap underscores the fact that successful badge adoption hinges on seamless integration with LMSs, CRM systems, and enterprise identity tools. Higher-education clients contract integrators to tie badges to credit-bearing courses and accreditation requirements. Corporates, meanwhile, demand single sign-on links between badge platforms and talent suites to capture learning analytics inside career-pathway dashboards. These complex needs fuel premium pricing for integration specialists, strengthening the revenue pool that services generate inside the broader digital badges market.


By Credential Type: Skill Verification Drives Market Evolution
Participation badges held a 42.15% revenue foothold in 2025, yet skill badges are forecast to surge at a 22.6% CAGR as employers privilege demonstrable competencies over attendance records. Achievement badges fall between the two, rewarding milestone completions in longer learning journeys, while contribution badges gain popularity in open-source and volunteer communities. For issuers, skill badges offer fine-grained metadata that maps directly to job frameworks, making them the currency of skills-based recruitment strategies. Consequently, the digital badges market size for skill-focused credentials is expected to outpace symbolic categories through 2031.
Red Hat’s certification program illustrates the trend: its Professional Certification badges validate technical mastery that hiring managers recognize globally. Eighty-three percent of employers now prefer badge-verified skills when short-listing candidates. This employer pull fuels investment in assessment-rigorous badges with proctored exams, scenario labs, or peer reviews. As this standard spreads, demand for advanced authoring tools and analytics modules climbs, boosting vendor revenues inside the digital badges industry.
By Deployment Mode: Cloud Dominance Persists Despite Security Concerns
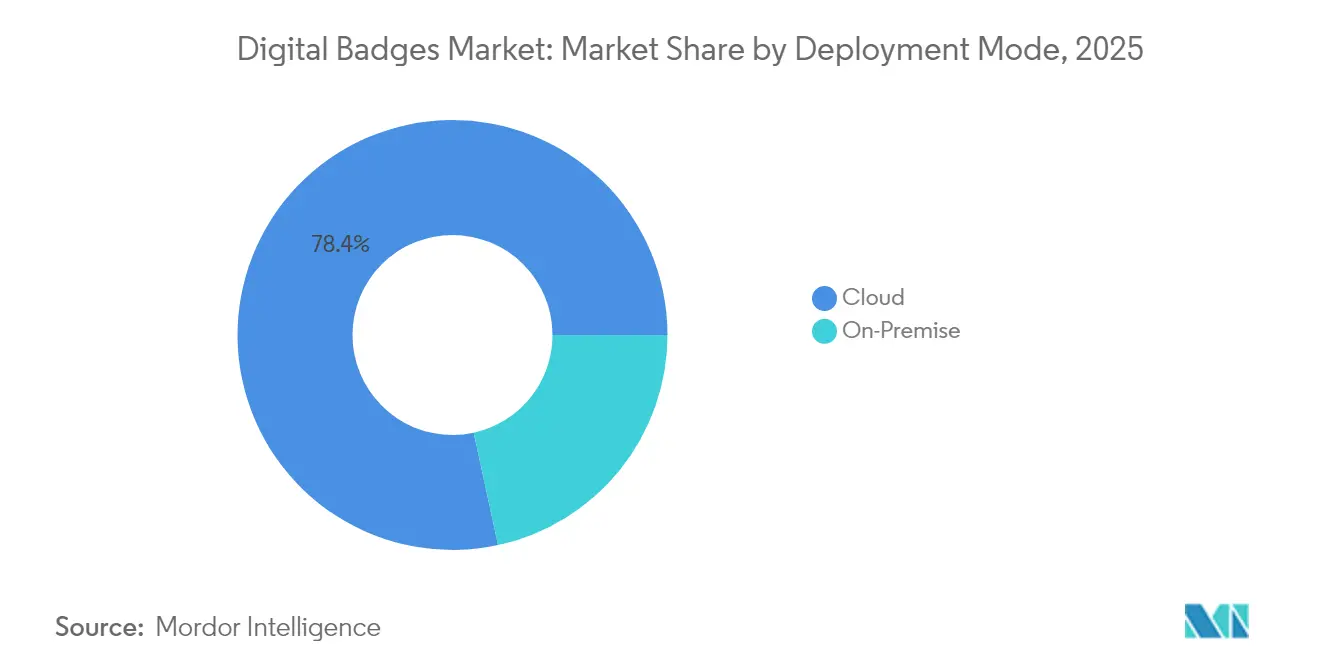
Cloud systems captured 78.40% of the 2025 digital badges market size, capitalizing on low infrastructure overhead, rapid scaling, and automatic standard updates. On-premise deployments, while just a sliver today, are expanding at a 11.9% CAGR in sectors such as defense, government, and banking that insist on full data sovereignty. Educational institutions in stringent privacy jurisdictions implement hybrid models: badge issuance logic stays on campus servers, yet public-facing verification occurs in vendor-hosted clouds. This blended architecture balances control with credential portability, keeping compliance teams and learners equally satisfied.
Data-security anxieties still spark lively debate. Administrators favor on-premise deployments for their capacity to restrict learner data from leaving national borders. Yet issuers acknowledge that universal verification requires external endpoints to remain discoverable by employers worldwide. Vendors now release modular architectures-containerized badge-issuance engines coupled with SaaS verification nodes-to reconcile both demands. This technical evolution underpins the sustained growth of the digital badges market.
By End-User: Academic Leadership Meets Corporate Growth
Academic institutions owned 54.70% of the digital badges market size in 2025, thanks to higher-education pioneers that embedded badges into degree pathways and co-curricular activities. Within academia, 51% of universities already issue micro-credentials, and 82% plan expansion over the next five years. Meanwhile, SMEs are the quickest movers, adding badges to showcase workforce agility and compete for talent, driving a 19.1% CAGR through 2031. Large enterprises such as IBM report triple-digit surges in course enrollments once badge incentives are attached to learning modules.
Government and nonprofit bodies use badges to evidence volunteer training and public-service competencies. The American Association of Advertising Agencies introduced AI-focused badges for member agencies, increasing course completion rates and signaling proficiency to brand-side clients. These varied use cases reinforce the digital badges market’s expansion across formal education, corporate upskilling, and civic learning.
Geography Analysis
North America remained the epicenter of the digital badges market in 2025, securing 39.75% of global revenue thanks to early college adoption and corporate talent-pipeline pressures. One in five U.S. colleges already issue badges, and 60% of employers are projected to treat them as valid qualifications by 2025. Canada’s provincial governments subsidize micro-credential programs for displaced workers, spurring demand among community colleges. Mexico is in a nascent phase, with multinational firms and elite universities driving isolated but influential pilots that emphasize cross-border credential portability.
Asia-Pacific stands out as the fastest-growing region, tracking a 20.9% CAGR from 2026-2031. China funnels state grants into digital upskilling as part of its Five-Year Plan, encouraging enterprises to adopt badge-driven workforce metrics. Japan and South Korea embed blockchain in national credential networks, extending badge validity across industries. India’s IT services firms deploy badges to certify cloud, security, and GenAI proficiencies for 5 million technologists. Despite these advances, rural broadband deficits linger: less than 40% of citizens in some Asia-Pacific economies have reliable connections, limiting badge issuance outside urban hubs.
Europe secures the number-two slot in market share, anchored by Germany, the U.K., and France. The EU’s micro-credential maturity model supplies universities with a roadmap for uniform badge standards. GDPR compliance shapes competitive positioning, favoring vendors that provide granular learner-data controls. Elsewhere, the Middle East witnesses strong uptake in Gulf Cooperation Council states where national visions spotlight lifelong learning. Sub-Saharan Africa wrestles with low connectivity-only 25% of rural populations enjoy upgraded networks-yet donor-funded pilot projects indicate pent-up demand for verifiable skills evidence.


Regulatory Landscape
Regulation is tightening around identity assurance, privacy, and cross-border recognition as digital badges converge with verifiable digital credential and wallet ecosystems. In the European Union, Regulation (EU) 2024/1183 sets a requirement for member states to provide European Digital Identity (EUDI) Wallets to citizens and businesses by end-2026. Implementing acts including Implementing Regulation (EU) 2025/848 cover the registration of wallet-relying parties, and Implementing Regulation (EU) 2026/798 sets standards for remote onboarding to EUDI Wallets. These measures increase compliance requirements for badge platforms that operate as, or integrate with, wallet issuers and relying parties, with particular focus on onboarding, authentication, and auditability.
Outside the EU, government identity and credential standards are also becoming more prescriptive. New Zealand updated its Credential Service Standard (effective May 2026), signaling stricter governance for credential services used across public and private sectors. Australia has formalized digital identity interoperability via Australian Digital ID (AGDIS) Data Standards 2024, including mandated federation protocol profiles (OpenID Connect) for government digital identity use cases. This push encourages badge and credential providers to adopt standards-aligned architectures when serving regulated issuers, education bodies, and workforce programs.
Competitive Landscape
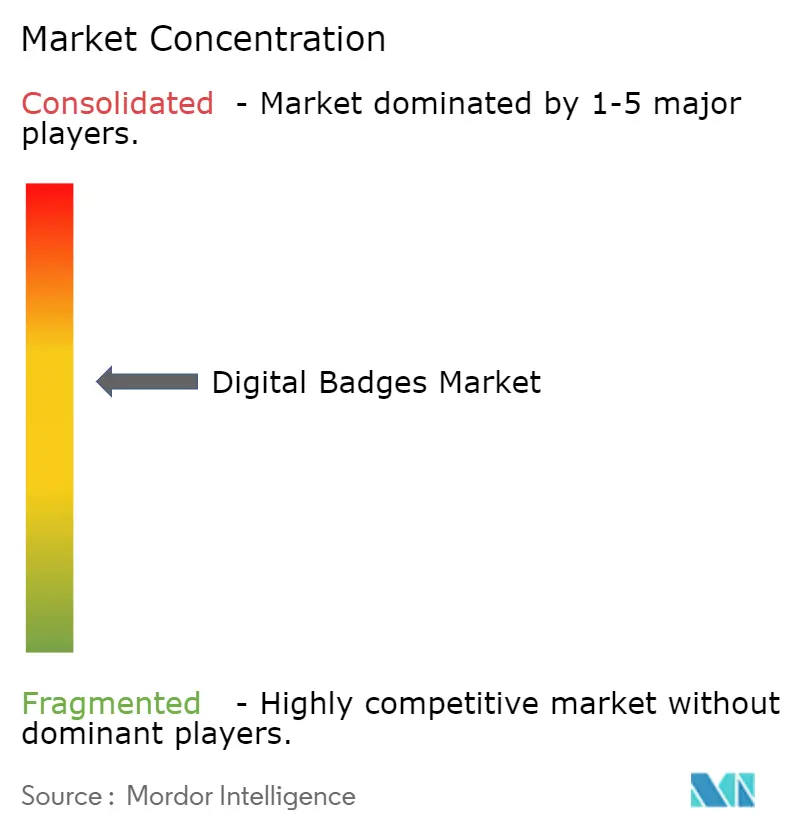
The digital badges market features moderate fragmentation. Core platform specialists-Credly, Accredible, Badgr (now part of Instructure)-meet stiff competition from HR-suite providers integrating native badging into talent systems. Interoperability dominates strategy: Open Badges 3.0 introduced in May 2024 spurred vendors to refresh APIs and cryptographic signing methods. Such moves pave the way for cross-platform badge stacking and learner-controlled wallets.
Consolidation accelerates as larger firms acquire niche analytics and verification startups to widen feature breadth. VerifyEd’s blockchain engine, launched March 2025, became an acquisition target rumor within weeks after cutting fraud rates in pilot clients by 50%. Service integrators differentiate on vertical expertise-healthcare, finance, public sector-commanding premium billable rates. White-space opportunities persist in regulated markets where compliance reporting translates into high switching costs.
Enterprise tech stacks now frame badges as essential nodes in skills graphs. Vendors invest in AI engines that parse badge metadata to populate talent-marketplaces and internal gig platforms automatically. Partnerships between badge platforms and MOOC providers unlock distribution channels to tens of millions of learners, expanding total addressable demand. Against this backdrop, the digital badges market rewards suppliers that balance airtight security with frictionless learner experiences.
Digital Badges Industry Leaders
Credly Inc
Concentric Sky Inc
International Institute of Business Analysis
Skillsoft Corporation
Accredible
- *Disclaimer: Major Players sorted in no particular order

Market Opportunities and Future Outlook
A major opportunity is migrating issuer ecosystems from legacy badge formats toward verifiable, wallet-compatible credentials, supported by standards convergence. Open Badges 3.0 aligns digital badges with W3C Verifiable Credential conventions, and standards work continues, including a July 2026 W3C working draft for the Digital Credentials API that standardizes how user agents mediate credential issuance and presentation. Platforms and service providers can monetize upgrade and interoperability work across education and corporate L&D, particularly where institutions manage complex legacy LMS and HR integrations and demand Integration and Implementation services.
Wallet and cross-border recognition frameworks also create whitespace for credential verification automation and compliance-grade workflows. The EU ecosystem is building beyond issuance through initiatives such as the DC4EU Sectorial Rulebook for education and professional qualifications, which frames credential recognition using W3C Verifiable Credentials and the European Digital Identity Wallet. In parallel, the Inji-Stack 2026 roadmap highlights universal credential formats, OpenID4VCI support, and multi-issuer architectures, pointing to sustained demand for scalable issuing, verification, and conformance tooling that connects badge records into employer HR systems and national or sector skills wallet infrastructures.
Recent Industry Developments
- May 2026: Validar and Accredible announced an integration to automate delivery of verifiable continuing education certificates for event attendees, first implemented for the April 2026 ABVP Symposium. The update extends digital credential issuance into event and continuing-education workflows where speed and auditability matter, reducing manual certificate handling for organizers and issuers.
- December 2025: Accredible launched SMS Engagement for credential delivery and highlighted the scale of credentials issued during 2025. Adding mobile-first delivery improves credential reach and redemption rates, which supports broader adoption in enterprise and education programs that need reliable learner engagement beyond email.
- January 2025: Credly (Pearson) announced it had reached 100 million unique digital credentials issued through the platform. The milestone underscores the scale of digital credentialing in enterprise and education ecosystems and increases pressure for interoperability and verification features as credentials circulate across more employers, schools, and professional networks.


Research Methodology Framework and Report Scope
Market Definition and Coverage
We size the digital badges market as the revenues earned from software and related services used to create, issue, manage, and verify digital badges for learning, skills, and achievements across education, employers, and public programs.
Scope exclusions: We exclude paper certificates and offline-only credentials, and we also exclude general learning content sales unless they are bundled as part of a digital badge platform or service contract.
Segmentation Overview
- By Offering
- Platforms
- Services
- Consulting
- Integration and Implementation
- Support and Maintenance
- By Credential Type
- Participation Badges
- Skill Badges
- Achievement Badges
- Contribution Badges
- By Deployment Mode
- Cloud
- On-Premise
- By End-User
- Academic
- K-12
- Higher Education
- Corporate
- Large Enterprises
- Small and Mid-Sized Enterprises (SMEs)
- Government and Non-Profits
- Academic
- By Geography
- North America
- United States
- Canada
- Mexico
- South America
- Brazil
- Argentina
- Chile
- Peru
- Rest of South America
- Europe
- Germany
- United Kingdom
- France
- Italy
- Spain
- Rest of Europe
- Asia-Pacific
- China
- Japan
- South Korea
- India
- Australia
- New Zealand
- Rest of Asia-Pacific
- Middle East
- United Arab Emirates
- Saudi Arabia
- Turkey
- Rest of Middle East
- Africa
- South Africa
- Rest of Africa
- North America
Data Sources, Market Sizing, and Validation
Desk Research
Desk work started with clarifying what counts as a digital badge, including alignment with Open Badges style credentialing, and mapping where it is being adopted in education and workforce programs. For that, we referred to public and official sources such as the World Bank education and labor indicators, OECD education statistics, UNESCO education datasets, and U.S. Department of Education resources, which helped anchor the demand backdrop.
We then used company annual reports, investor presentations, reputable press coverage, and association or standards body publications to map common revenue streams, including platform subscriptions, implementation, integrations, and program services. To avoid building the model on assumptions only, we also used paid database subscriptions for company financials and intelligence, plus patent databases to track how credential verification and anti-fraud features were evolving. These desk research sources are illustrative and not exhaustive, and many other references were used for data collection, cross-checking, and clarification.
Primary Interviews and Surveys
Primary work focused on validating how badge programs are priced and contracted across academic and corporate buyers, along with what typically drives renewal and expansion. We spoke with platform-side and service-side participants, implementation partners, and customer-side users, including training, HR, and learning teams, across major regions. This helped fill gaps from desk findings and check assumptions before finalizing totals.
Distribution of primary research fieldwork respondents
| Company type | Respondent position | Region |
|---|---|---|
| Top tier: 39% | CXOs: 13% | APAC: 46% |
| Mid tier: 45% | Functional/Unit leaders: 28% | EMEA: 36% |
| Smaller Players: 16% | Managers: 59% | Americas: 18% |
Market-Sizing & Forecasting
Sizing is built by first reconstructing the addressable spend using adoption and rollout signals across digital credential programs, then translating that demand pool into annual revenues through pricing and contract structure checks. The top-down approach combines education and workforce digitization indicators with digital credential adoption rates, and then scales the spend by the typical platform plus services mix that we validated in interviews.
To keep the totals realistic, we corroborated results with selective bottom-up approximations, such as sampled average contract values multiplied by estimated active program counts, and supplier revenue roll-ups where disclosures were available. Inputs used in the model include active badge issuer program counts, user seat ranges, platform subscription price bands, implementation and integration intensity, cloud versus on-premise delivery mix, and renewal behavior in academic and corporate settings.
For the forecast, we used scenario analysis supported by light multivariate regression on demand drivers, such as training budget direction, micro-credential policy momentum, and enterprise adoption curves by region. Where bottom-up data was missing for smaller providers, gaps were handled through conservative share-of-market proxies tied to observed pricing bands and program scale, and then re-checked with interview feedback before final numbers were locked.
Data Validation & Update Cycle
Validation is done through several rounds of checks that compare outputs against independent signals, such as the pace of new credential programs, regional education digitization markers, and the observed spread of contract values across buyer types. If an outlier is detected, the assumptions behind it are reviewed, and follow-up calls are triggered when the variance cannot be explained through scope or pricing differences.
Before sign-off, another analyst reviews the model math, the included scope rules, and the main assumptions so avoidable errors are caught early. Reports are refreshed annually, and we also run interim updates when material events occur that can shift adoption or pricing. Right before delivery, a final pass is completed so clients receive the most current view available.
Mordor Intelligence's Digital Badges Market Sizing Compared With Other Published Estimates
Published totals for digital badges do not always line up because the boundary of what gets counted is not uniform across sources, and the timing of the reference year can shift the number in a fast-growing market. Differences also come from how studies treat platform versus services revenues, and whether adjacent digital credential products are blended into the same pool.
By tracking contract-level price bands and refresh timing, Mordor Intelligence keeps the digital badges total limited to platform and related services revenues, instead of mixing in broader learning technology spend that can inflate the market in some publications.
Benchmark comparison
| Source | Market Size | Gaps in Research Methodology |
|---|---|---|
| Mordor Intelligence | USD 237.29 M (2025) | |
| Industry Publisher A | USD 300.00 M (2024) | The scope appears to blend digital badges with wider digital credentialing and micro-credential categories, and the service layer is expanded to include broader professional services beyond badge program delivery. |
| Market Blog B | USD 650.00 M (2024) | The estimate uses a wider end-user and application lens and likely counts adjacent identity and credential solutions, and the growth curve is based on aggressive adoption assumptions that are not always tied back to typical contract values. |
The spread in the table mainly comes from how tightly the revenue boundary is set and how pricing assumptions are treated across platform, integration, and services. Our approach stays traceable to a defined digital badge demand pool with repeatable inputs, which makes it easier for buyers to reconcile the number with real-world program rollouts and contract structures.


Key Questions Answered in the Report
What is driving the rapid growth of the digital badges market through 2031?
Growth stems from employers’ preference for verifiable skills, government-funded upskilling grants, and academic institutions embedding stackable micro-credentials into degree pathways, resulting in a 17.18% forecast CAGR.
Which region will expand the fastest in digital badge adoption?
Corporations and governments invest in large-scale digital upskilling programs.
How important are interoperability standards like Open Badges 3.0?
Crucial. The May 2024 release standardizes security and metadata, enabling cross-platform verification and accelerating vendor ecosystem expansion
Why are integration services outpacing platform revenue growth?
Organizations realize badge success depends on seamless linkage with LMSs, HR suites, and compliance systems, prompting demand for specialized Integration & Implementation services growing at 21.26% CAGR.
How do digital badges combat credential fraud?
Blockchain verification engines, such as VerifyEd’s 2025 release, reduce fraud incidents by 50% and automate authenticity checks, though smaller issuers must balance the security benefits against higher operating costs.
Which end-user segment is adopting digital badges most quickly?
SMEs lead with a 19.1% CAGR as they use badges to compete for talent, while academia remains the largest segment, holding 54.70% of the 2025 market.
Page last updated on:






