Digital Agriculture Market Size and Share
Market Overview
| Study Period | 2021 - 2031 |
|---|---|
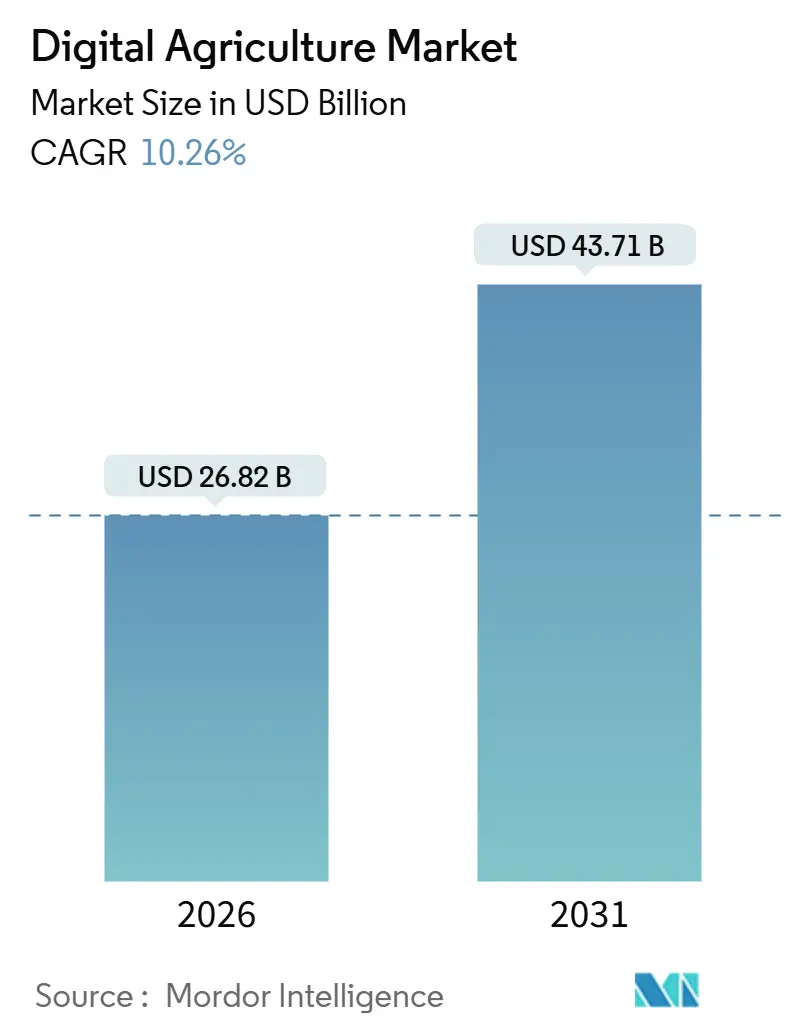
| Market Size (2026) | USD 26.82 Billion |
| Market Size (2031) | USD 43.71 Billion |
| Growth Rate (2026 - 2031) | 10.26% CAGR |
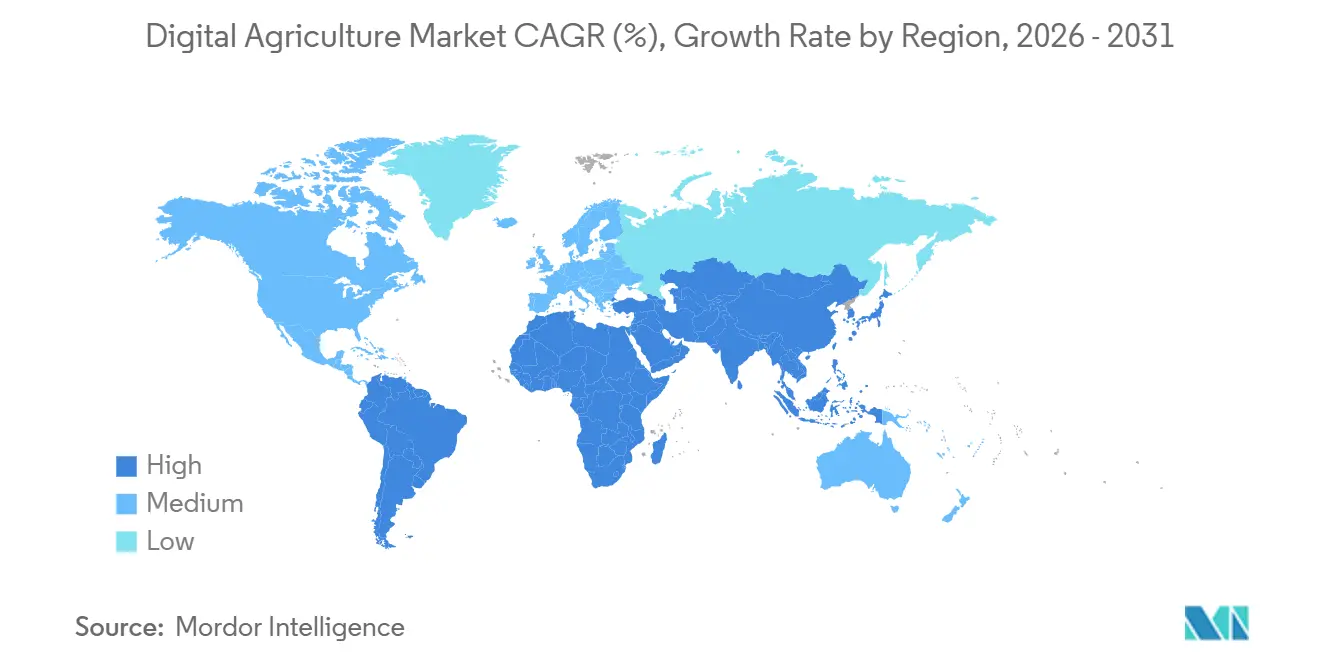
| Fastest Growing Market | Africa |
| Largest Market | North America |
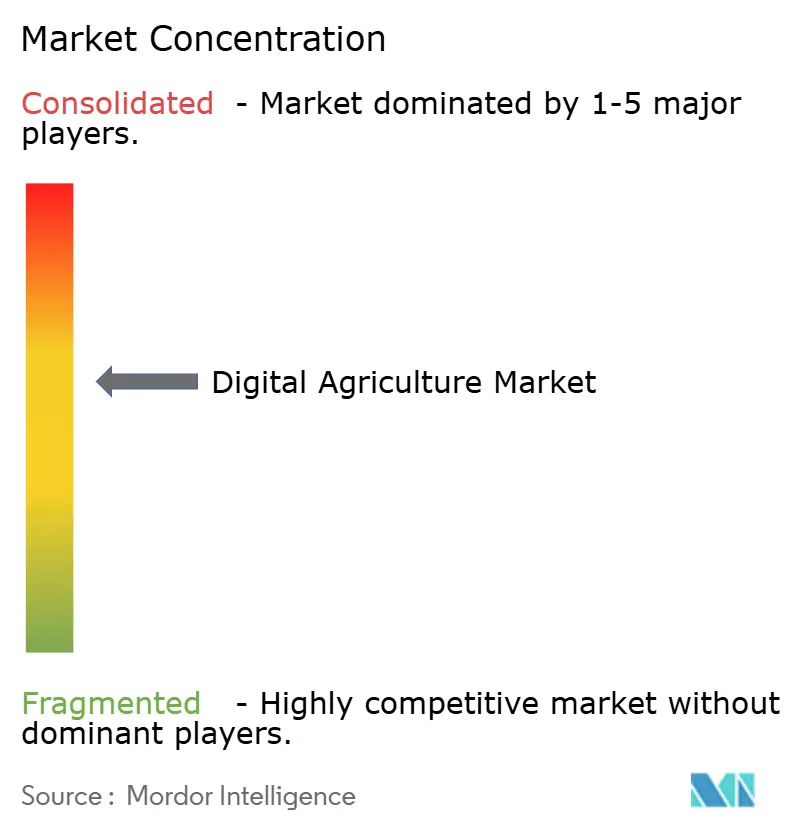
| Market Concentration | Medium |
Major Players *Disclaimer: Major Players sorted in no particular order Image © Mordor Intelligence. Reuse requires attribution under CC BY 4.0. | |
Digital Agriculture Market Analysis by Mordor Intelligence
The digital agriculture market size is projected to grow from USD 26.82 billion in 2026 to USD 43.71 billion by 2031, registering a CAGR of 10.26%. Significant investments in edge computing, widespread sensor deployment, and data monetization models are driving a shift toward real-time, in-field decision-making. Growth is particularly strong in regions where rural broadband funding, declining drone costs, and sustainability mandates intersect, enabling farms to transition from calendar-based spraying to data-driven practices. Competitive dynamics are intensifying as software-focused entrants bypass traditional equipment dealers, while established manufacturers integrate artificial intelligence chips into tractors to maintain market influence. Industry consortia are promoting interoperability standards, and emerging data marketplaces are providing growers with more options for data exchange and sharing. Cybersecurity risks and vendor lock-in remain critical challenges. In Africa, double-digit growth highlights the rapid narrowing of connectivity gaps, presenting new opportunities for subscription-based analytics solutions.
Key Report Takeaways
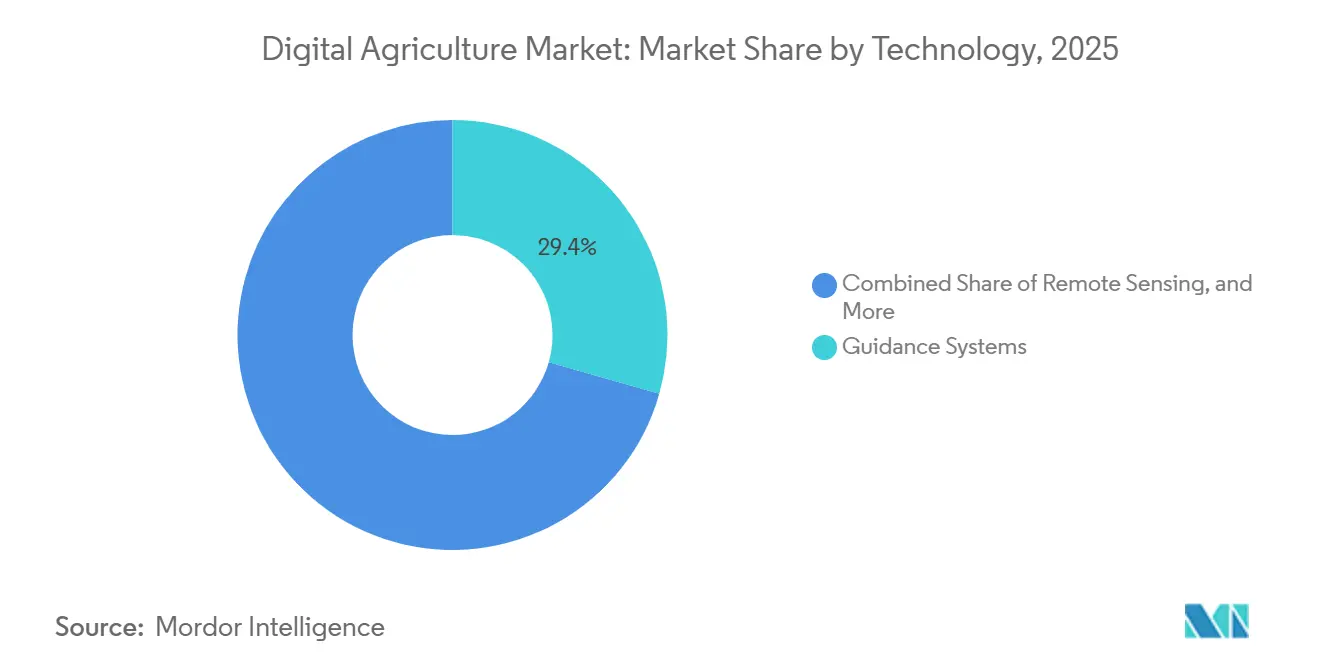
- By technology, guidance systems led with 29.4% of the digital agriculture market share in 2025, while artificial intelligence is advancing at a 11.3% CAGR through 2031.
- By solution, hardware accounted for 43.2% of the digital agriculture market size in 2025, whereas software is projected to expand at a 9.8% CAGR through 2031.
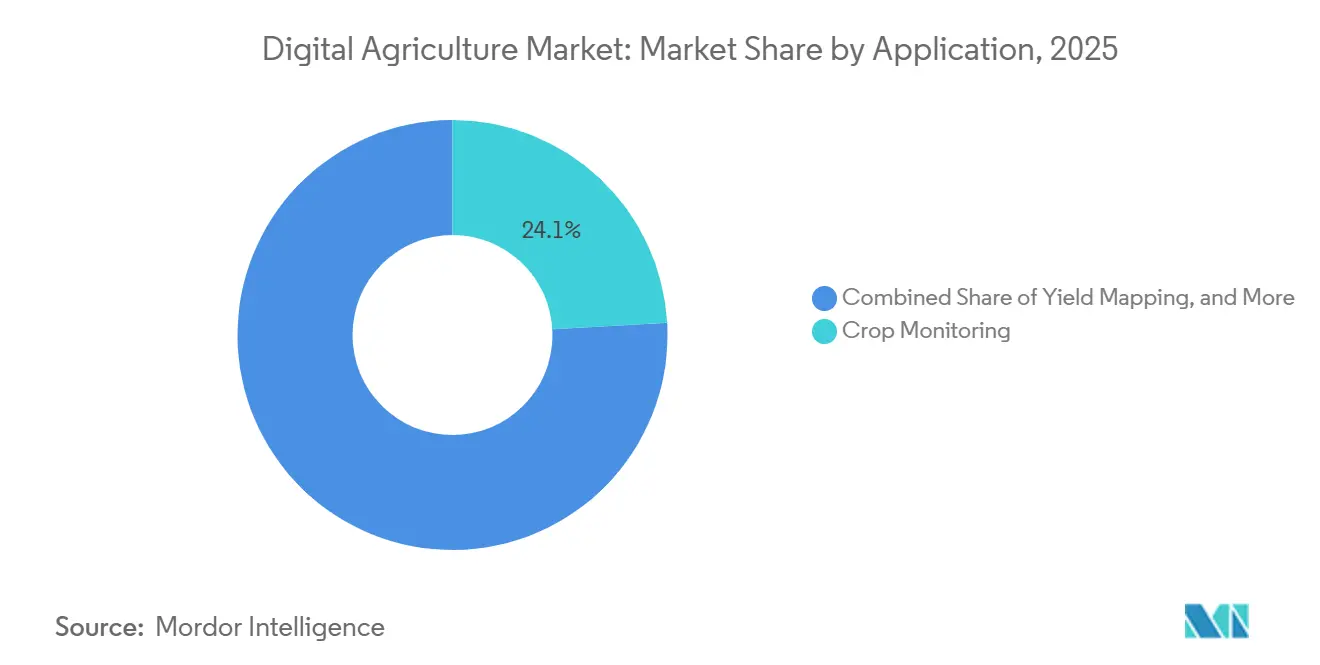
- By application, crop monitoring accounted for 24.1% of revenue in 2025, and drone analytics is projected to grow at a 10.7% CAGR across the forecast period.
- By farm size, medium-scale operations held 41.5% of the market share in 2025, while small-scale farms are forecast to expand adoption at an 8.6% CAGR to 2031.
- By geography, North America led with a 37.8% share in 2025, and Africa is the fastest-growing region, expanding at a 10.9% CAGR through 2031.
- The five largest vendors, including Deere & Company, CNH Industrial N.V., Syngenta Group, AGCO Corporation, and Bayer AG, collectively accounted for the majority of global revenue in 2025.
Note: Market size and forecast figures in this report are generated using Mordor Intelligence’s proprietary estimation framework, updated with the latest available data and insights as of January 2026.
Global Digital Agriculture Market Trends and Insights
Drivers Impact Analysis
| Driver | (~) % Impact on CAGR Forecast | Geographic Relevance | Impact Timeline |
|---|---|---|---|
| Rapid adoption of IoT sensors and connectivity | +1.9% | North America and Europe with spillover to Asia-Pacific | Medium term (2-4 years) |
| Falling drone hardware prices | +1.7% | Asia-Pacific core, spillover to South America and Africa | Short term (≤2 years) |
| Data-driven yield-boost imperatives | +1.6% | North America, Europe, and Australia | Long term (≥4 years) |
| Farm-generated data marketplaces | +1.3% | North America and European Union, pilots in Brazil | Long term (≥4 years) |
| Satellite-enabled hyper-local weather feeds | +1.2% | Global, critical in rain-fed Africa and South Asia | Medium term (2-4 years) |
| Edge AI chips embedded in field equipment | +1.1% | North America, Western Europe, and Australia | Medium term (2-4 years) |
| Source: Mordor Intelligence | |||
Rapid Adoption of IoT Sensors and Connectivity
Cellular modules priced below USD 5 increased total agricultural shipments to over 12 million units in 2024. The United States Department of Agriculture allocated USD 400 million for the ReConnect rural broadband program in fiscal 2024, reducing the cost of real-time soil moisture telemetry[1]Source: United States Department of Agriculture, “ReConnect Program,” usda.gov. Edge gateways now aggregate data from 100 field nodes, reducing bandwidth usage by 70% and enabling the commercial viability of region-wide pest models. The United States Congress instructed the National Institute of Standards and Technology to establish interoperability rules by 2026, which is anticipated to drive vendor consolidation around standardized protocols. Growers are already generating revenue from anonymized sensor data streams, providing a secondary income source that helps offset subscription costs. These developments collectively enhance productivity while reducing the total cost of ownership for connected devices.
Falling drone hardware prices
In 2024, entry-level spraying drones in China were priced below USD 3,000 as manufacturers increased cumulative production to 400,000 units. In 2025, Brazil introduced beyond-visual-line-of-sight waivers, enabling a single operator to cover 200 hectares per day and reduce payback periods to less than 18 months. The cost of thermal cameras, previously USD 5,000, dropped to USD 800 due to advancements in smartphone supply chains, making stress detection more accessible for mid-season interventions. The harmonization efforts by the International Civil Aviation Organization now permit licensed operators to bid across the European bloc, facilitating cross-border service models. These lower costs, combined with regulatory improvements, have made drones a viable option for small-scale farmers who previously relied on manual spraying. Additionally, broader deployment generates richer image datasets, enhancing machine-learning-based yield forecasts.
Data-Driven Yield-Boost Imperatives
Input costs for fertilizers and crop protection increased by 30% between 2020 and 2024, reducing profit margins and driving demand for variable-rate tools. In 2024 field trials, Deere & Company's See and Spray system reduced herbicide usage by up to 59%, addressing stricter Environmental Protection Agency regulations on glyphosate. Yield maps covering five seasons now hold premium valuations in farm data exchanges, as they form the foundation for carbon-credit baselines. The integration of agronomic analytics with insurance risk models is attracting new participants to the digital agriculture market, enhancing the importance of verified datasets. Service providers are combining soil sampling with financial forecasting to offer comprehensive advisory packages. These developments underscore the critical role of data-driven strategies for growers aiming to maintain profitability.
Satellite-Enabled Hyper-Local Weather Feeds
Planet Labs' 200-satellite constellation delivers daily three-meter resolution imagery, enabling the detection of irrigation failures within 24 hours. The International Business Machines (IBM) Weather Company integrates these satellite feeds with ground sensors to provide one-kilometer resolution forecasts, optimizing spray windows for agricultural activities. In 2024, the National Oceanic and Atmospheric Administration (NOAA) enhanced the near-infrared bands on its GOES-18 satellite, improving vegetation monitoring capabilities for free extension applications in Sub-Saharan Africa. Advanced evapotranspiration algorithms have replaced static crop coefficients, resulting in water savings of 20% to 30% in California's Central Valley. The combination of synthetic aperture radar and optical imagery enables all-weather monitoring during monsoon seasons, eliminating the need for weeks-long data interruptions. Collectively, these technological advancements enhance agronomic timing and improve resource efficiency.
Restraints Impact Analysis
| Restraint | (~) % Impact on CAGR Forecast | Geographic Relevance | Impact Timeline |
|---|---|---|---|
| Fragmented land holdings in developing economies | -1.4% | South Asia, Sub-Saharan Africa, and Southeast Asia | Long term (≥ 4 years) |
| High up-front capital expenditure | -1.2% | Global, acute in South America and Eastern Europe | Medium term (2-4 years) |
| Rising cybersecurity threats to farm networks | -0.9% | North America, Europe, and Australia | Short term (≤ 2 years) |
| Vendor data-ownership lock-in concerns | -0.8% | North America and European Union, emerging in Brazil and India | Medium term (2-4 years) |
| Source: Mordor Intelligence | |||
Fragmented Land Holdings in Developing Economies
The average farm size in India remains below 1.1 hectares, making precision guidance systems economically unviable when compared to annual crop margins[2] Source: United States Department of Agriculture Economic Research Service, “Farm Size and Technology Adoption,” ers.usda.gov. In Kenya and Nigeria, cooperative drone fleets encounter governance challenges related to equipment maintenance and revenue sharing. From 2020 to 2024, China’s land-consolidation program aggregated 40 million hectares, enabling mechanization benefits that remain unattainable in South Asia. In Sub-Saharan Africa, informal leasing practices result in annual shifts in plot boundaries, disrupting the multi-seasonal data continuity necessary for yield algorithms. Digital land registries in Rwanda and Ethiopia cover less than 30% of arable land, hindering the adoption of agricultural technologies. These structural challenges continue to constrain the growth of the digital agriculture market in key emerging regions.
Vendor Data-Ownership Lock-In Concerns
Closed formats impose costs of USD 5,000 to USD 15,000 on growers due to the loss of analytics continuity when switching to a new provider. While the AgGateway ADAPT (Agricultural Data Application Programming Toolkit) specification provides an open standard, major manufacturers continue to limit full data export to safeguard software revenue. The European Union Data Governance Act grants farmers ownership of machine-generated logs, and enforcement remains under development in local courts. In 2024, the United States Department of Justice initiated an antitrust investigation into Bayer AG’s data marketplace, citing concerns over competitive harm[3]Source: United States Department of Justice, “Antitrust Investigation into Farm Data Platforms,” justice.gov. Blockchain-based portability pilots in Argentina have shown potential but remain limited to specialty crops. The lack of transparency regarding data rights hinders platform switching and slows overall market growth.
Segment Analysis
By Technology: Guidance Systems Anchor Revenue While Artificial Intelligence Leads Growth
Guidance systems accounted for 29.4% of the digital agriculture market share in 2025, serving as the primary entry point for many growers adopting digital tools. This segment remains the largest contributor to the digital agriculture market size, supported by high recurring income from real-time kinematic correction subscriptions and retrofit auto-steer kits. Manufacturers leverage bundled service contracts to stabilize cash flows and secure multi-year agreements, reinforcing their market leadership. Remote sensing technologies, such as satellites and drones, complement guidance systems by providing raw imagery for variable-rate prescriptions and regulatory reporting. Despite its maturity, the guidance segment continues to evolve with features such as centimeter-level accuracy and automated headland turns, which minimize overlap and reduce fuel consumption.
Artificial intelligence, with an 11.3% CAGR, is the fastest-growing technology component in the digital agriculture market and is poised to drive the next wave of innovation. Edge neural networks, now integrated into sub-USD 400 system-on-modules within sprayers and harvesters, enable pixel-level weed targeting and grain quality grading without network latency. Leading manufacturers are incorporating dedicated accelerators to safeguard firmware ecosystems and collect proprietary telemetry data. Concurrently, open-source models are lowering entry barriers for startups focused on disease detection and anomaly alerts. As a result, investment is increasingly directed toward software expertise and silicon partnerships, rather than mechanical innovation, accelerating the development and deployment of new features.
Note: Segment shares of all individual segments available upon report purchase
By Solution: Hardware Still Dominates but Software Gains Momentum
Hardware accounted for 43.2% of the digital agriculture market size in 2025, driven by essential investments in tractors, sensors, and drones that form the foundation of the market. Declining component prices, particularly for gyroscopes and lithium batteries, have enabled budget-conscious farms to adopt entry-level automation solutions. Dealers sustain profitability by offering bundled services such as installation, calibration, and maintenance, which help offset hardware margin pressures. Additionally, advancements in sensor miniaturization encourage complementary purchases, including soil probes and micro weather stations, which support higher-value analytics.
Software is projected to grow at the fastest rate, with a 9.8% CAGR, shifting the focus from one-time equipment sales to recurring revenue streams that expand the digital agriculture market size. For instance, Climate FieldView’s 200 million enrolled acres highlight the scalability of platform models that monetize anonymized datasets. Regular feature updates delivered via over-the-air mechanisms enhance user engagement and enable tiered pricing strategies. Hyperscale cloud providers now offer farm-specific modules that integrate agronomy data with enterprise resource planning systems, embedding software solutions into back-office operations. As account managers adopt a consultative selling approach, solution providers capture additional value beyond the initial licensing fees.
By Application: Crop Monitoring Leads While Drone Analytics Rises Fastest
Crop monitoring accounted for a 24.1% revenue share in 2025, establishing itself as the most developed use case within the digital agriculture market. High-resolution imagery from Planet Labs, combined with ground sensors, provides growers with a comprehensive view of stress events within 24 hours, helping to protect yield potential. Yield mapping offers insights into spatial variance, supporting land valuations and carbon credit assessments. Soil health dashboards help manage moisture and nutrients, enhancing resource efficiency, particularly during drought-prone periods.
Drone analytics, anticipated to grow at a 10.7% CAGR, is the fastest-growing application in the digital agriculture market. Regulatory approvals for beyond-visual-line-of-sight operations enable a single pilot to monitor multiple fields daily, transforming high-frequency imagery into actionable advisory outputs. With the availability of more affordable multispectral cameras, drones enable mid-season nitrogen top-dressing recommendations, resulting in measurable margin improvements. Service providers offer these capabilities through per-hectare fees, increasing accessibility for small and medium-sized farms. The same imagery supports risk models for insurers and traders, creating new revenue opportunities across industries.
Note: Segment shares of all individual segments available upon report purchase
By Farm Size: Medium-Scale Farms Dominate, Small Holdings Accelerate
Medium-scale farms, ranging from 100 to 500 hectares, accounted for 41.5% of adoption in 2025, representing the largest segment in the digital agriculture market. Their capital reserves and operational complexity justify investments in technologies such as guidance systems and variable-rate control. Many operators participate in purchasing cooperatives to distribute fixed costs, while government grants prioritize mid-sized farms to enhance ESG compliance tracking. Service providers offer bundled solutions that strike a balance between advanced features and manageable learning curves, contributing to high renewal rates.
Small farms, defined as those under 100 hectares, are growing at a CAGR of 8.6%, making them the fastest-expanding customer segment and a key growth driver for the digital agriculture market. Policy initiatives, such as India’s Digital Agriculture Mission, provide subsidies to reduce hardware costs, while shared drone fleets transform capital expenditures into service-based fees. Smartphone advisory applications establish a basic digital infrastructure, enabling vendors to promote additional products, such as sensor kits and micro-insurance. The mass production of low-cost edge devices is improving per-field economics, making precision guidance more accessible to smaller holdings previously considered out of reach.
Geography Analysis
North America accounted for 37.8% of the digital agriculture market share in 2025, driven by large farm sizes, high mechanization rates, and sustained funding from the United States Department of Agriculture's Climate-Smart Commodity Program. Restrictions on herbicides by the Environmental Protection Agency are accelerating the adoption of precision spraying technologies, while the Food and Drug Administration's livestock traceability rule is boosting demand for record-keeping software. In Canada, similar advancements are observed in prairie grain systems, while Mexico is working to close rural broadband gaps, aiming for 80% coverage by 2026. Established dealer networks and financing channels are facilitating the rapid adoption of next-generation autonomous tractors. Additionally, heightened cybersecurity awareness is promoting faster implementation of the National Institute of Standards and Technology best practices.
Africa is projected to achieve the highest growth rate in the digital agriculture market, with a CAGR of 10.9%, as mobile operators expand fourth-generation networks and satellite imagery costs drop below USD 1 per hectare. South Africa is utilizing variable-rate irrigation to address water scarcity, while Kenya is pioneering village-level drone cooperatives. The African Development Bank has allocated USD 200 million for agtech financing in 2024, fostering startups that combine equipment leasing with agronomy consulting. Daily satellite imagery and cloud-based advisory platforms are helping subsistence farmers mitigate climate-related challenges. Despite fragmented land tenure, pilot digital registries in Rwanda and Ethiopia are laying the foundation for multi-season data continuity. These developments position Africa as a key region for new market entrants seeking to tap into untapped agricultural potential.
Europe benefits from the European Commission's Common Agricultural Policy budget of EUR 387 billion (USD 410 billion), which allocates funding for digital tools through 2027. Guidance systems and variable-rate technologies are widely adopted in Germany, France, and the United Kingdom, while Eastern Europe is scaling up drone scouting to address labor shortages. The Farm to Fork strategy, which aims to reduce pesticide use by 50% by 2030, is driving demand for subscription-based analytics focused on optimizing chemical usage. Data governance laws granting farmers ownership of telemetry data are influencing platform designs toward open exchange frameworks. Additionally, manufacturers are localizing edge artificial intelligence modules to comply with the European Union Artificial Intelligence Act, thereby reducing certification timelines.
Competitive Landscape
The digital agriculture market exhibits moderate concentration, with the top five suppliers, Deere & Company, CNH Industrial N.V., Syngenta Group, AGCO Corporation, and Bayer AG, collectively accounting for the majority of global revenue in 2025. Deere & Company, CNH Industrial N.V., and AGCO Corporation utilize their extensive installed tractor bases to cross-sell precision upgrades, thereby locking customers into real-time kinematic corrections and proprietary guidance systems. AGCO Corporation’s USD 2 billion joint venture with Trimble in 2024 established unified variable-rate control and farm management software, setting new benchmarks for interoperability among competitors.
Input suppliers such as Bayer AG and Syngenta Group are increasingly focusing on data platforms to monetize agronomic insights. For example, Climate FieldView’s acreage scale generates paid licensing revenue from seed manufacturers seeking regional performance trends. Additionally, technology companies like Microsoft and International Business Machines are embedding farm modules within hyperscale cloud platforms, catering to enterprise accounts that require seamless integration with accounting and supply chain systems. Meanwhile, NVIDIA, Intel, and Advanced Micro Devices compete for silicon design wins in edge artificial intelligence accelerators, collaborating with equipment manufacturers on exclusive chip development roadmaps.
Startups such as Traction Ag and Farmers Edge Inc. are targeting small and medium enterprises with per-hectare pricing models and direct-to-grower distribution channels. Competitive differentiation is increasingly reliant on open data exchange, but leading manufacturers often resist full interoperability to safeguard their recurring revenue streams. Emerging buying criteria, such as cybersecurity hardening and guarantees of data portability, are driving vendors to publish third-party audit reports to maintain customer trust.
Digital Agriculture Industry Leaders
Deere & Company
CNH Industrial N.V.
AGCO Corporation
Bayer AG
Syngenta Group
- *Disclaimer: Major Players sorted in no particular order
Recent Industry Developments
- December 2025: The OpenAgri Project and the AgStack Foundation have announced a strategic partnership to incorporate OpenAgri's open-source software portfolio into AgStack's digital infrastructure. This collaboration seeks to address persistent challenges in digital agriculture, including system fragmentation and vendor lock-in.
- November 2025: Land O'Lakes and Microsoft have formed a strategic alliance to advance AI innovation in agriculture and tackle critical farming challenges. This partnership aims to enhance farm efficiency and sustainability by integrating Land O'Lakes' comprehensive agricultural data with Microsoft's cloud and AI technologies.
- November 2025: Syngenta Group has launched the Cropwise Open Platform, making its flagship digital infrastructure accessible to third-party developers. This initiative seeks to bridge the "technology divide" in global agriculture, where smaller or older farmers face challenges in keeping pace with the rapid advancements in AI and digital tools.
- November 2024: Microsoft Corporation has enhanced its AI capabilities by launching a series of tailored AI models optimized with industry-specific data, including applications for the agricultural market. These models aim to deliver precise and effective solutions to address distinct industry challenges.
Research Methodology Framework and Report Scope
Market Definitions and Key Coverage
Our study defines the digital agriculture market as the full suite of hardware, software, and connected services that capture, transmit, analyze, and apply data to crop and livestock operations, beginning with in-field sensing and ending at the farm gate. This includes precision machinery, IoT sensors, remote-sensing drones and satellites, analytics platforms, and advisory applications that help farmers decide when and how to plant, feed, irrigate, and harvest.
Scope exclusion: Activities downstream of the farm gate, such as commodity trading platforms and food-processing software, are excluded from our sizing.
Segmentation Overview
- By Technology
- Guidance Systems
- Remote Sensing
- Variable Rate Technology
- Artificial Intelligence
- Internet of Things
- Blockchain and Traceability
- Robotics and Automation
- By Solution
- Hardware
- Software
- Services
- By Application
- Crop Monitoring
- Yield Mapping
- Soil Monitoring
- Weather Tracking
- Precision Spraying
- Drone Analytics
- Livestock Health Tracking
- By Farm Size
- Small-Scale Farms (Less Than 100 ha)
- Medium-Scale Farms (100 - 500 ha)
- Large-Scale Farms (More Than 500 ha)
- By Geography
- North America
- United States
- Canada
- Mexico
- Rest of North America
- Europe
- Germany
- United Kingdom
- France
- Italy
- Spain
- Russia
- Rest of Europe
- Asia-Pacific
- China
- India
- Japan
- Australia
- South Korea
- Rest of Asia-Pacific
- South America
- Brazil
- Argentina
- Rest of South America
- Middle East
- Saudi Arabia
- United Arab Emirates
- Turkey
- Rest of Middle East
- Africa
- South Africa
- Egypt
- Rest of Africa
- North America
Detailed Research Methodology and Data Validation
Primary Research
Multiple structured interviews were held with agronomists, drone-service operators, regional dealer networks, growers' cooperatives, and public-extension officers across North America, Europe, Asia-Pacific, and Latin America. These discussions tested unit-penetration assumptions, price dispersion, and upgrade cycles, and they fed qualitative weightings that fine-tuned forecast drivers identified during desk work.
Desk Research
Our analysts mapped the addressable technology pool by screening open data from authorities such as the FAO, USDA ERS, Eurostat, and India's National Sample Survey, which quantify cropland, livestock units, and capital spending per hectare. We layered in adoption ratios drawn from the World Bank rural-broadband dashboards and ITU connectivity datasets to ground the reach of connected devices. Financial filings and investor decks of leading farm-equipment makers, sensor providers, and ag-software firms clarified average selling prices, while patent trends from the EPO's digital-agriculture dashboard signaled emerging cost curves. Subscription databases that Mordor licenses, D&B Hoovers for company revenue splits and Dow Jones Factiva for deal flow, helped us validate commercial roll-outs. The sources cited here are illustrative; many additional public and paid references informed the evidence base.
Market-Sizing & Forecasting
A top-down model converts cultivated-area and livestock-head statistics into a potential spending pool, applying technology-specific penetration rates and annual spend per hectare or per animal. Select bottom-up checks, such as drone shipment tallies and sampled farm-management-software subscriptions, validate totals and reveal under-reported pockets, which are subsequently adjusted. Key variables include rural broadband coverage, average drone price trajectory, per-acre variable-rate-technology uptake, government subsidy outlays, and crop-price swings that influence capital budgets. Forecasts run on a multivariate-regression framework where connectivity growth, commodity prices, and subsidy intensity act as leading indicators, with scenario bands reviewed by industry experts before lock-in.
Data Validation & Update Cycle
Outputs face three layers of review: automated variance scans against historical series, peer analyst cross-checks, and a senior analyst sign-off. We refresh every twelve months, triggering interim updates when policy shifts or technology breakthroughs materially alter any core driver.
Why Mordor's Digital Agriculture Baseline Commands Reliability
Published estimates often diverge because providers choose differing start years, bundle adjacent technologies, or translate local prices at outdated exchange rates.
Key gap drivers include (1) Mordor's farm-gate boundary, whereas some studies fold in post-harvest logistics; (2) our use of in-country price audits versus averaged global ASPs; and (3) our annual refresh cadence, while others revise models less frequently.
Benchmark comparison
| Market Size | Anonymized source | Primary gap driver |
|---|---|---|
| 26.0 Bn (2025) | Mordor Intelligence | - |
| 24.2 Bn (2024) | Global Consultancy A | Excludes drone-service revenues and uses 2022 FX rates |
| 22.0 Bn (2023) | Trade Journal B | Bundles only hardware sales and applies a three-year refresh cycle |
These comparisons show that when scope, pricing, and update cadence are fully aligned, Mordor's disciplined triangulation delivers a balanced, transparent baseline that decision-makers can replicate and trust.
Key Questions Answered in the Report
How large is the digital agriculture market in 2026?
The digital agriculture market size is USD 26.82 billion in 2026 and is forecast to reach USD 43.71 billion by 2031.
Which technology captures the highest revenue within digital farming?
Guidance systems lead with 29.4% of technology revenue in 2025, anchored by real-time kinematic correction subscriptions.
What segment is growing the fastest across applications?
Drone analytics is expanding at a 10.7% CAGR, driven by cheaper hardware and beyond-visual-line-of-sight approvals.
Why is Africa the fastest-growing regional market?
Expanded fourth-generation coverage, low-cost satellite imagery, and new agtech finance from the African Development Bank fuel a 10.9% CAGR.
What risk factors could slow market adoption?
High up-front capital costs, fragmented land tenure, cyber threats, and vendor lock-in can suppress adoption in price-sensitive regions.


