
Digital Agriculture Market Size and Share
Market Overview
| Study Period | 2021 - 2031 |
|---|---|
| Market Size (2026) | USD 26.82 Billion |
| Market Size (2031) | USD 43.71 Billion |
| Growth Rate (2026 - 2031) | 10.26 % |
| Fastest Growing Market | Africa |
| Largest Market | North America |
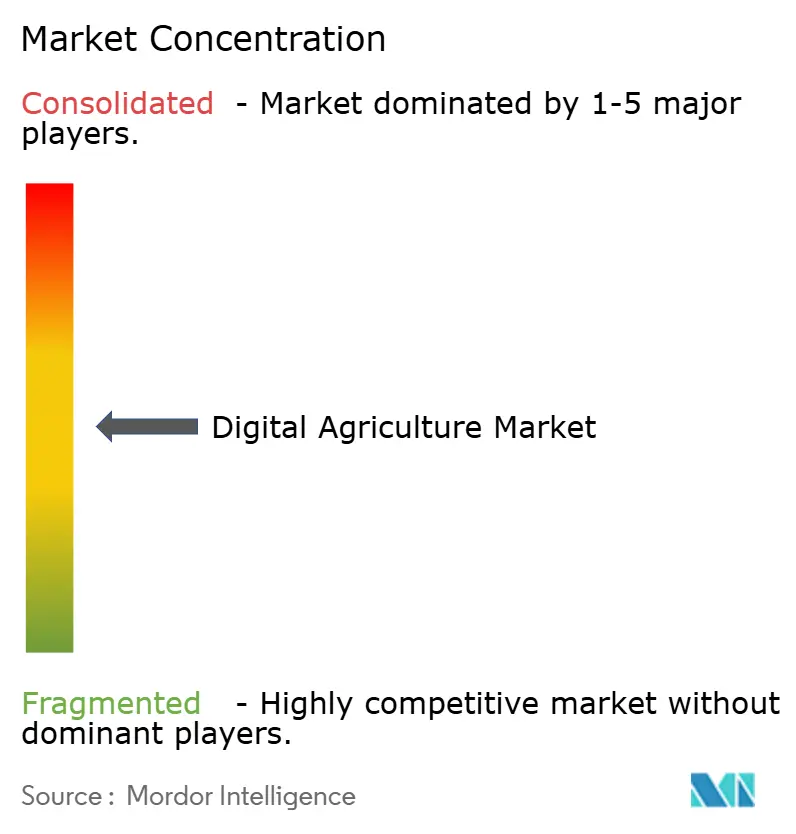
| Market Concentration | Medium |
Major Players *Disclaimer: Major Players sorted in no particular order Image © Mordor Intelligence. Reuse requires attribution under CC BY 4.0. | |
Digital Agriculture Market Analysis by Mordor Intelligence
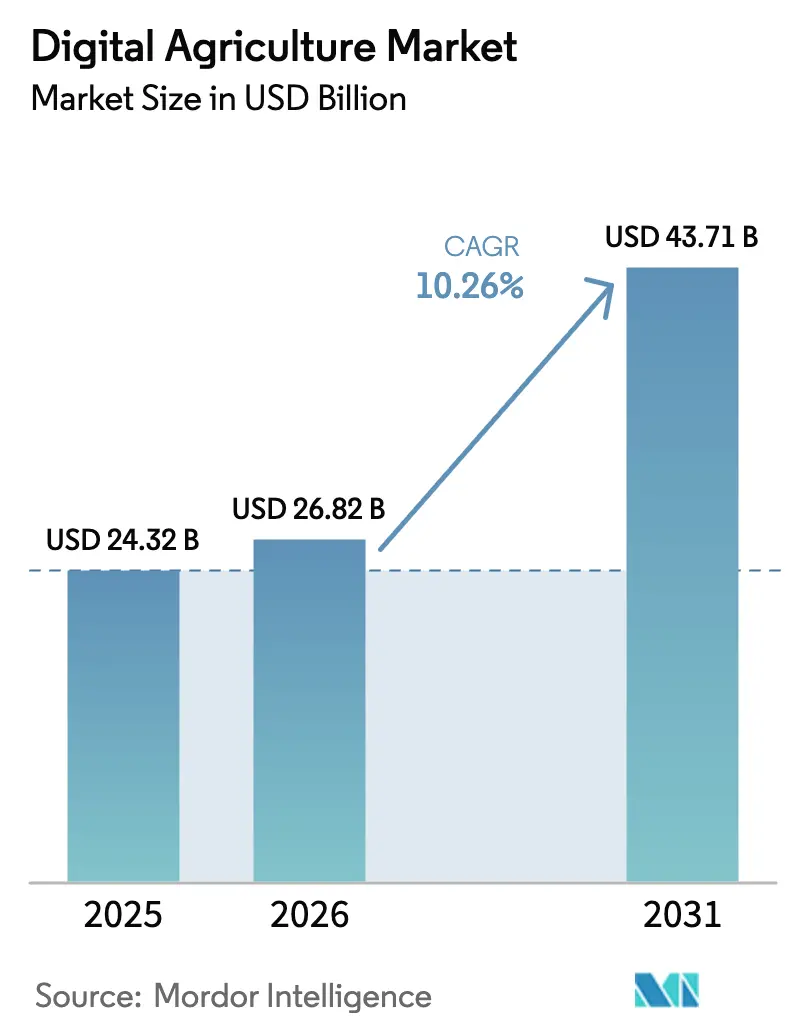
The digital agriculture market size stood at USD 24.32 billion in 2025 and is estimated to reach USD 26.82 billion in 2026, growing at a 10.26% CAGR during the forecast period to reach USD 43.71 billion by 2031. The expansion of the digital agriculture market reflects the steady combination of field sensors, satellite data, guidance tools, and enterprise software into day-to-day farm decisions rather than a short-lived technology cycle. Labor shortages across major farming regions are also moving automation from a useful upgrade to a practical operating requirement for growers and contractors. Regulatory pressure is strengthening adoption as the European Union pushes lower pesticide and fertilizer use and higher traceability under the Farm to Fork agenda and related farm policy frameworks. Verified farm data is also gaining commercial value because carbon programs and low-carbon fuel pathways now reward stronger field-level reporting, measurement, and audit trails. Public digital infrastructure, including India’s Digital Agriculture Mission, is reducing onboarding friction for both public and private platforms, improving the long-term opportunity for integrated providers in digital agriculture.
Key Report Takeaways
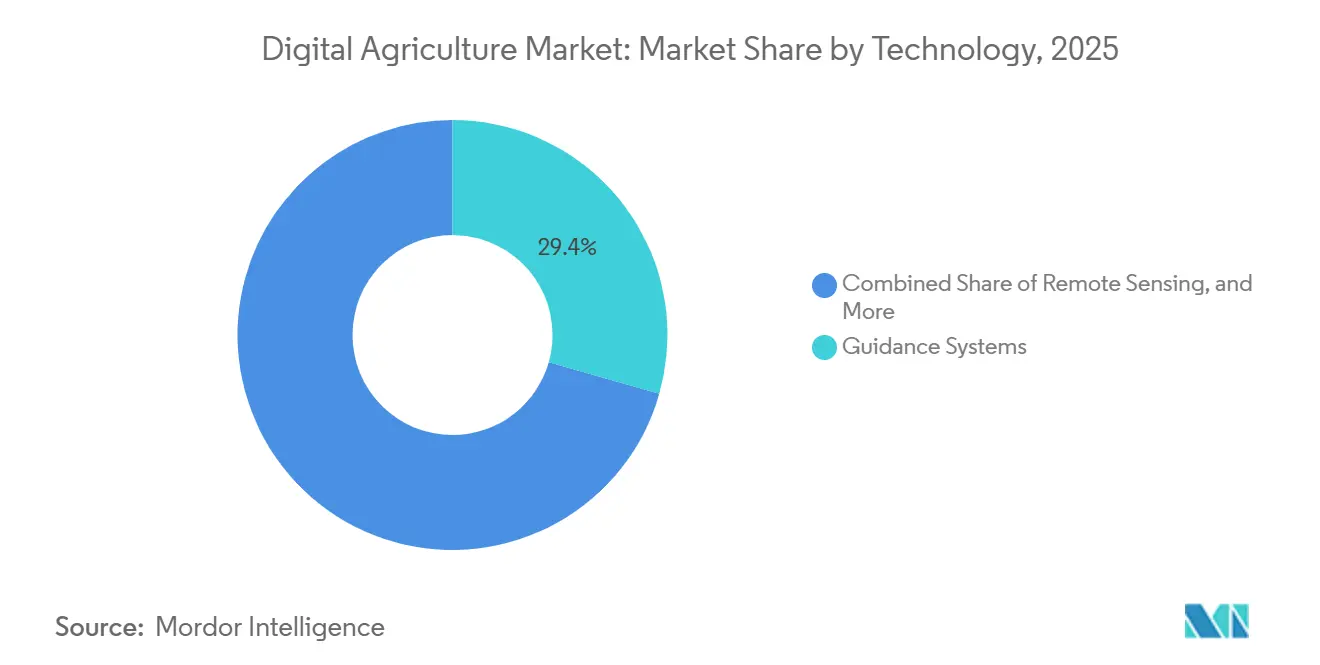
- By technology, guidance systems led the digital agriculture market share with 29.4% in 2025, while artificial intelligence and advanced analytics are forecast to grow at a CAGR of 11.3% from 2026 to 2031.
- By component, hardware accounted for a 43.2% share of the digital agriculture market in 2025, while software is forecast to grow at a CAGR of 10.8% from 2026 to 2031.
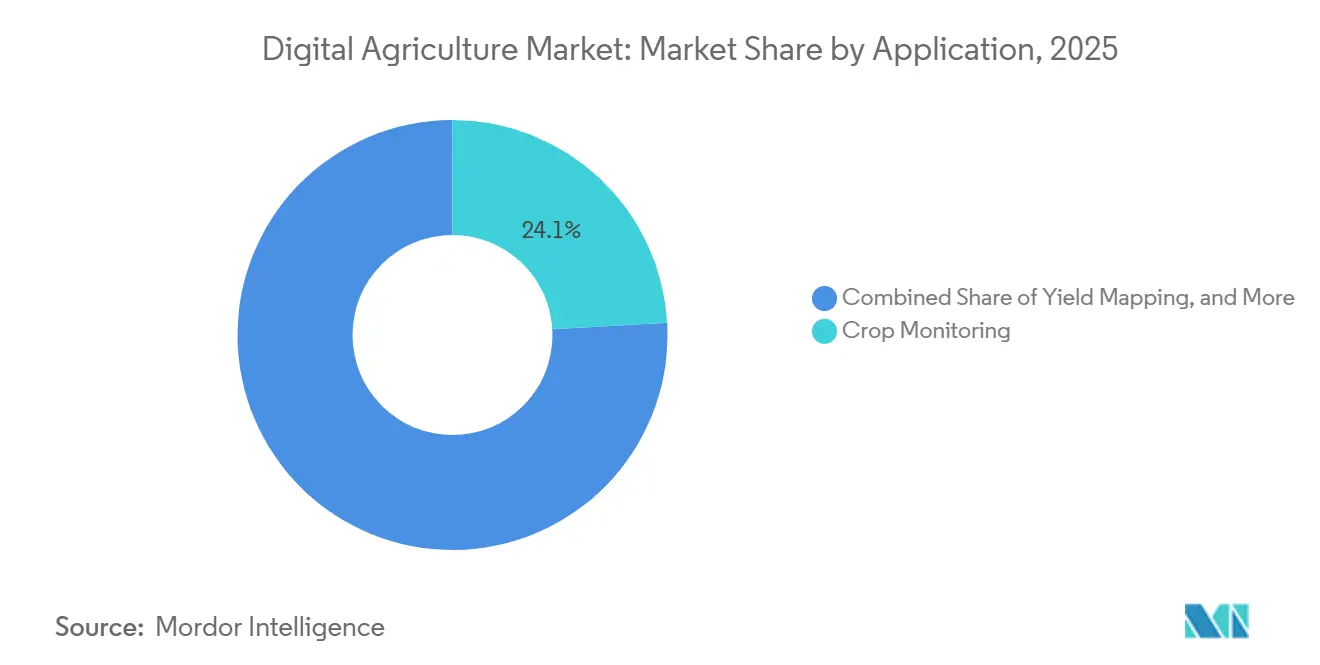
- By application, crop monitoring accounted for a 24.1% share of the digital agriculture market in 2025, while drone analytics is forecast to grow at a CAGR of 10.7% from 2026 to 2031.
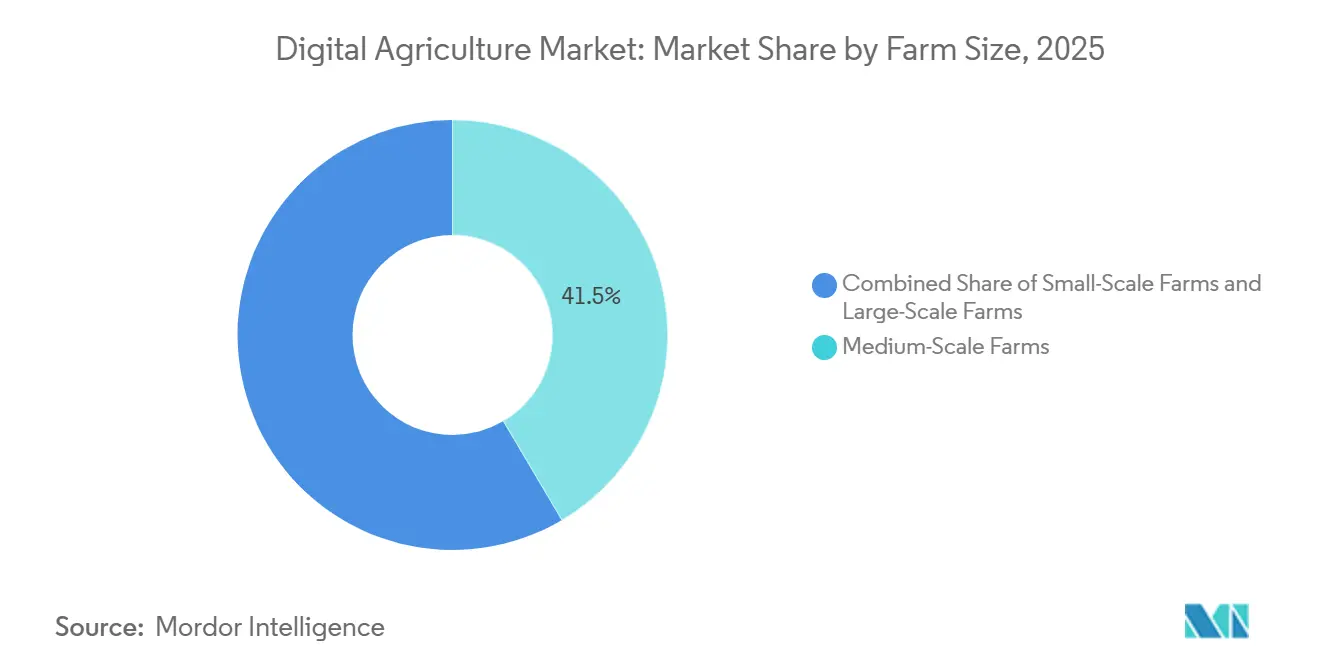
- By farm size, medium-scale farms accounted for a 41.5% share of the digital agriculture market size in 2025, while small-scale farms are forecast to grow at a CAGR of 10.4% from 2026 to 2031.
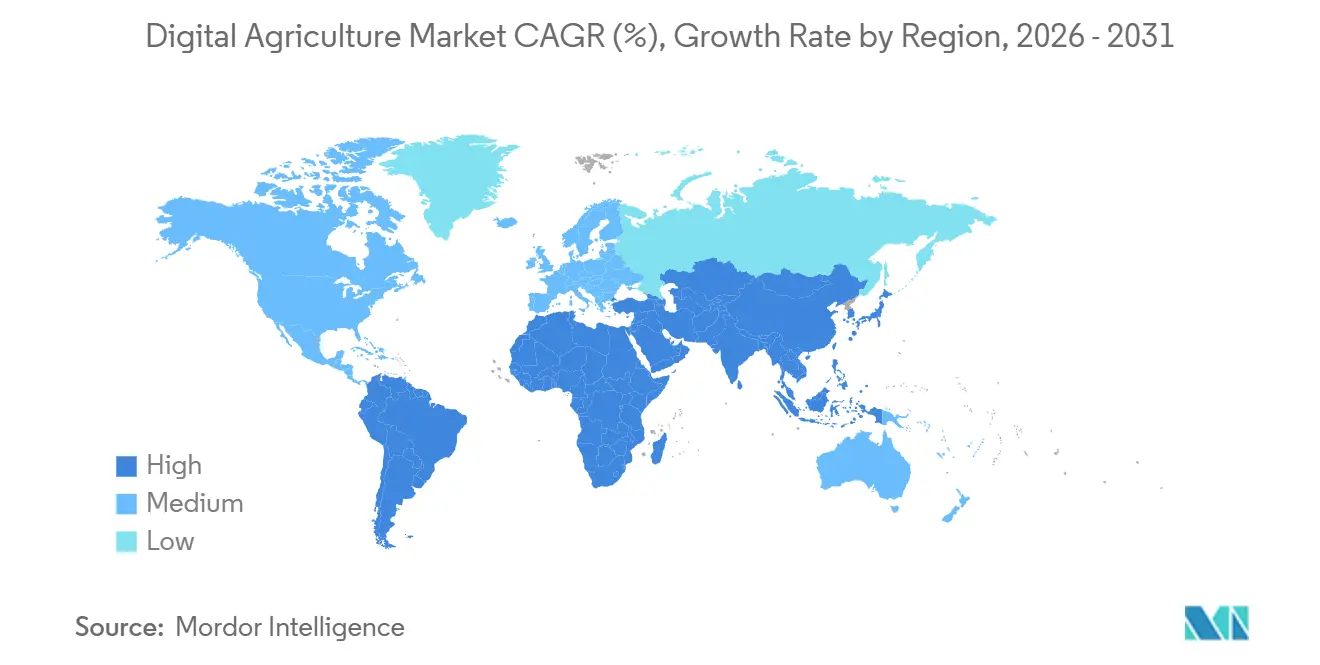
- By geography, North America accounted for a 37.8% share of the digital agriculture market in 2025, while Africa is forecast to grow at a CAGR of 10.9% from 2026 to 2031.
Note: Market size and forecast figures in this report are generated using Mordor Intelligence’s proprietary estimation framework, updated with the latest available data and insights as of January 2026.
Global Digital Agriculture Market Trends and Insights
Drivers Impact Analysis*
| Driver | (~) % Impact on CAGR Forecast | Geographic Relevance | Impact Timeline |
|---|---|---|---|
| Precision Input Optimization and Yield Uplift | +2.5% | Global, with highest impact in North America, Europe, Brazil, and Australia | Long term (≥ 4 years) |
| Falling Sensor, Drone, and Guidance-System Costs | +1.6% | Asia-Pacific core, with spillover into Africa and South America | Short term (≤ 2 years) |
| Farm Labor Shortages Accelerating Automation | +2.0% | North America, Europe, Japan, and Australia | Medium term (2-4 years) |
| Climate-Smart Farming Incentives and Compliance Demand | +1.4% | Europe first, then North America, India, Brazil, and parts of Africa | Medium term (2-4 years) |
| Carbon MRV and Scope 3 Data Monetization | +0.8% | North America, Europe, and Brazil, with early movement in Africa and South Asia | Long term (≥ 4 years) |
| Embedded Finance and Digital Public Infrastructure for Farmers | +0.9% | India, Sub-Saharan Africa, Southeast Asia, Brazil, and Mexico | Long term (≥ 4 years) |
| Source: Mordor Intelligence | |||
Precision Input Optimization and Yield Uplift
Growers in the digital agriculture market tend to adopt tools most rapidly when these tools visibly improve field economics. Technologies like variable-rate application and camera-based spraying are significant because they minimize waste without requiring growers to accept uncertain returns. According to Deere, its See and Spray system reduced herbicide use by up to 59% during 2024 field trials, providing farmers with a clear cost-saving incentive to adopt digital technologies. The pressure on margins has been substantial, as the FAO reported a sharp increase in fertilizer and crop protection costs between 2020 and 2024, making precise input usage increasingly critical[1]Source: Food and Agriculture Organization, “Food Outlook 2024,” FAO, fao.org. Deere also highlighted that its FurrowVision system, which uses three in-furrow cameras to deliver real-time depth data and automated DownForce optimization, has the potential to improve yields by up to 20 bushels per acre. This underscores why precision input control remains a key driver in the digital agriculture market, as it directly connects technology investments to both cost management and crop yield improvements.
Falling Sensor, Drone, and Guidance-System Costs
Lower hardware costs are widening access to the digital agriculture market for farms that once viewed precision tools as a high-capital purchase. DJI Agriculture reported that by the end of 2025, it had more than 600,000 drones deployed globally across more than 100 countries, supported by more than 600,000 trained operators[2]Source: DJI Agriculture, “Global Adoption of Agricultural Drones,” DJI Agriculture, dji.com. In 2025, Brazil introduced beyond-visual-line-of-sight waivers, enabling a single operator to cover 200 hectares per day and reduce payback periods to less than 18 months. The cost of thermal cameras, previously USD 5,000, dropped to USD 800 due to advancements in smartphone supply chains, making stress detection more accessible for mid-season interventions. The International Civil Aviation Organization's harmonization efforts now permit licensed operators to bid across the European region, facilitating cross-border service models. These lower costs, combined with regulatory improvements, have made drones a viable option for small-scale farmers who previously relied on manual spraying. Additionally, broader deployment generates richer image datasets, enhancing machine-learning-based yield forecasts.
Farm Labor Shortages Accelerating Automation
Labor scarcity has emerged as a significant driver of demand in the digital agriculture market, impacting key activities such as planting, spraying, monitoring, and harvest timing. According to Japan’s Ministry of Agriculture, Forestry and Fisheries, the number of core farm workers declined to approximately 1.16 million in 2024, with 71.7% of these workers aged 65 or older. This demographic trend has made automation a practical necessity rather than a long-term goal. Similar challenges are evident in other developed agricultural economies, where growers face a shortage of available operators and increasing labor costs during critical seasonal periods. In response, AGCO introduced the PTx Trimble OutRun Tillage in early 2026, a retrofit autonomy kit designed for existing tractors, addressing the need to perform more tasks with fewer operators. This labor-driven reality continues to position automation as a central focus in the digital agriculture market, spanning both equipment-led and software-led business models.
Climate-Smart Farming Incentives and Compliance Demand
The digital agriculture market is also gaining support from compliance systems that now require stronger proof of how crops are produced. The European Union’s Farm to Fork Strategy set targets for a 50% reduction in pesticide use and a 20% reduction in chemical fertilizer use by 2030, which increases the value of field-level documentation and decision support. Once subsidy rules and sustainability programs require documented practices, digital recordkeeping becomes mandatory for many farms. India’s Digital Agriculture Mission is building Farmer ID and digital extension foundations that can reduce onboarding costs for advisory, traceability, and workflow platforms at scale. BASF launched Circalo in February 2026 to connect farmers, agronomists, and ethanol producers through verifiable Biofuel Feedstock Reports that demonstrate how compliance is moving into commercial crop channels. This driver is important because it combines policy pressure with a practical route to monetization, and that combination tends to hold up even when farm sentiment is mixed. It also pushes the digital agriculture market toward platforms that can store, verify, and transfer agronomic records without adding too much work for the grower.
Restraints Impact Analysis*
| Restraint | (~) % Impact on CAGR Forecast | Geographic Relevance | Impact Timeline |
|---|---|---|---|
| High Upfront Investment and Uncertain Payback for Smaller Farms | -1.8% | Global, with stronger pressure in South Asia, Sub-Saharan Africa, Eastern Europe, and South America smallholder segments | Medium term (2-4 years) |
| Rural Connectivity Gaps and Limited Digital Skills | -1.3% | Sub-Saharan Africa, South and Southeast Asia, rural South America, North America and Europe | Long term (≥ 4 years) |
| Interoperability Friction and Vendor Lock-In | -0.9% | North America and Europe first, with rising relevance in Brazil and India | Medium term (2-4 years) |
| Cybersecurity Exposure Across Connected Machinery and Farm Data Platforms | -0.7% | United States, Canada, Germany, Australia, and Brazil | Short term (≤ 2 years) |
| Source: Mordor Intelligence | |||
High Upfront Investment and Uncertain Payback for Smaller Farms
Capital intensity remains a significant constraint on the growth of the digital agriculture market, particularly for smaller farms that cannot distribute fixed costs across extensive acreage. Implementing full technology stacks often involves simultaneous investments in hardware, subscriptions, data services, and training, making the initial adoption decision more challenging despite potential long-term benefits. This issue is more pronounced in cases where growers have limited access to formal financing or operate with tight annual cash reserves. A study in West Africa, involving 3,660 producers across Senegal, Côte d’Ivoire, and Benin, found that 60% of respondents owned only basic phones, while 20% had no phone at all. This highlights the limited digital infrastructure in such regions. These findings are critical, as even low-cost advisory models cannot assume widespread smartphone availability. Additionally, recurring software subscription costs are often among the first to be reduced when farm income is impacted by fluctuating commodity prices or adverse weather conditions. To accelerate the adoption of digital agriculture among smallholders, vendors must develop pricing models that emphasize services, group access, shared equipment, or outcome-based billing structures.
Cybersecurity Exposure Across Connected Machinery and Farm Data Platforms
Cybersecurity is increasingly recognized as a significant risk in the digital agriculture market, driven by operational and data vulnerabilities associated with connected machinery and cloud platforms. Disruptions during critical activities such as planting, spraying, or harvesting can have costly impacts on timing, input use, and field operations, extending beyond mere data loss. The United States Department of Agriculture's Agricultural Marketing Service highlighted farm network cybersecurity as an emerging issue during its May 2024 GIAC meeting, indicating that the topic has entered formal policy discussions. This challenge is intensifying as equipment manufacturers incorporate remote access, telematics, third-party integrations, and automated control systems. Efforts by ISO to establish a formal framework for agricultural data security are underway to enhance resilience; however, compliance introduces additional costs for vendors and customers during implementation. Farmers also require assurance that their operational data will remain secure and not be misused when shared across financing, sustainability, and supply chain programs. Until greater trust is established, cybersecurity risks will continue to act as a limiting factor for the growth of the digital agriculture market, particularly for highly connected fleets and enterprise platforms.
*Our forecasts treat driver/restraint impacts as directional, not additive. The impact forecasts reflect baseline growth, mix effects, and variable interactions.
Segment Analysis
By Technology: AI Integration Reshapes the Digital Agriculture Technology Stack
Guidance systems remained the largest technology segment in the digital agriculture market, accounting for 29.4% of revenue in 2025. Their lead reflects broad adoption across row crops, specialty crops, and large-grain operations, where steering accuracy has become a baseline capability rather than an optional add-on. Guidance also stays resilient because retrofit kits let growers improve older fleets without replacing whole machinery lines. Artificial intelligence and advanced analytics is the fastest-growing technology segment, and the digital agriculture market for this category is projected to expand at a 11.3% CAGR through 2031 as agronomy platforms add generative AI, computer vision, and predictive decision-making tools.
The Internet of Things and Connected Sensors segment is expanding as lower-cost sensing is paired with platforms that can turn field data into irrigation, nutrient, and crop actions, strengthening the foundation of connected agriculture. CropX said deployments of its V4 sensors delivered 20-30 bushel-per-acre yield improvements in the Northern Plains when growers closely followed its irrigation recommendations. Blockchain and Traceability is still smaller, but demand from carbon MRV, provenance, and supply chain reporting is giving it a clearer commercial role in export and low-carbon crop channels. Robotics and Automation is moving into a more commercial phase in 2026 as Deere, AGCO, and Kubota push autonomy from demonstration into active deployment, which means the digital agriculture market is shifting from stand-alone precision tools toward connected execution systems


By Component: Software Revenue Is Gaining Share Structurally
Hardware accounted for 43.2% of component revenue in 2025, reflecting the installed base of guidance receivers, antennas, sensors, drones, displays, and connected machinery across the digital agriculture market. Hardware still anchors deployments because farms need physical collection, positioning, and control layers before software value can be realized. At the same time, software is the fastest-growing component and is projected to expand at 10.8% CAGR through 2031 as vendors move revenue toward subscriptions, data services, and recurring agronomy workflows. Deere, AGCO, Syngenta, and BASF are all advancing this direction through Operations Center Advanced License, PTx FarmEngage, Cropwise Open Platform, and xarvio FIELD MANAGER, indicating that the digital agriculture industry is steadily moving toward recurring software value.
Services remain the third component pillar and include agronomic support, deployment, implementation, data integration, and outcome-based advisory. BASF’s xarvio HEALTHY FIELDS launch in Japan during 2025 demonstrated how yield guarantees and service layers can sit atop software to create a more differentiated offer for growers. Open integration is becoming more important because data quality and API access now influence buying decisions as much as hardware ownership does. CNH’s FieldOps ecosystem and DTN’s broad farm intelligence footprint show why connected services matter, and that trend should keep lifting software and service share across the digital agriculture market
By Application: Crop Monitoring Scales While Drone Analytics Gains Fastest Momentum
Crop monitoring remained the largest application in the digital agriculture market, accounting for 24.1% of revenue in 2025. It leads in the market because remote sensing, scouting, and imagery are often the first digital tools a farm can use without changing every operating practice at once. The Syngenta and Planet Labs partnership, renewed in March 2025, extended near-daily 3-meter-resolution imagery across Cropwise, reinforcing the growing embeddedness of satellite monitoring in routine crop decisions. The digital agriculture market share for Crop Monitoring is also being supported by public-sector use cases such as satellite-based agricultural payments monitoring in Europe, which creates a steadier demand base beyond individual farm subscriptions.
Drone analytics is the fastest-growing application and is projected to expand at 10.7% CAGR through 2031, driven by wider hardware access and easier operating rules in key farm markets. DJI Agriculture’s 2026 report showed how quickly drone deployment has spread across global agriculture, which supports the move from niche scouting to mainstream aerial crop intelligence. Yield Mapping and Forecasting, Precision Spraying and Input Optimization, and Soil Monitoring are increasingly being sold as connected workflows instead of separate tools. Livestock monitoring, farm financial management, and weather modules remain important, but they are now more often attached to broader agronomy platforms, which keeps the application mix inside the digital agriculture market moving toward bundled software ecosystems.
By Farm Size: Medium-Scale Farms Dominate, Small Holdings Accelerate
Medium-scale farms ranging from 100 to 500 hectares accounted for 41.5% of the digital agriculture market in 2025, making them the largest customer segment. Their relatively strong capital capacity and increasing operational complexity support investments in technologies such as guidance systems and variable-rate application tools. Many of these farms also participate in purchasing cooperatives to reduce fixed costs, while government support programs increasingly target mid-sized operations to improve ESG compliance and operational efficiency. As a result, technology providers are offering bundled digital solutions that combine advanced functionality with simplified adoption, contributing to strong customer retention rates.
Small farms under 100 hectares are projected to register the fastest growth, expanding at a CAGR of 10.4% during the forecast period. Growth in this segment is being driven by government initiatives, such as India’s Digital Agriculture Mission, which subsidizes hardware adoption, as well as shared-service models, such as drone fleets, that reduce upfront capital requirements. In addition, smartphone-based advisory platforms are creating foundational digital ecosystems that enable vendors to cross-sell products including sensor kits and micro-insurance solutions. The increasing availability of low-cost edge devices is further improving affordability and making precision agriculture technologies more accessible to smaller farming operations.
Geography Analysis
North America accounted for 37.8% of the digital agriculture market share in 2025, driven by large farm sizes, high mechanization rates, and sustained funding from the United States Department of Agriculture's Climate-Smart Commodity Program. Restrictions on herbicides by the Environmental Protection Agency are accelerating the adoption of precision spraying technologies, while the Food and Drug Administration's livestock traceability rule is boosting demand for record-keeping software. In Canada, similar advancements are observed in prairie grain systems, while Mexico is working to close rural broadband gaps, aiming for 80% coverage by 2026. Established dealer networks and financing channels are facilitating the rapid adoption of next-generation autonomous tractors. Additionally, heightened cybersecurity awareness is promoting faster implementation of the National Institute of Standards and Technology best practices.
Africa is anticipated to achieve the highest growth rate in the digital agriculture market, with a CAGR of 10.9%. This growth is attributed to mobile-led services, digital farmer registration, smart irrigation, and controlled-environment programs, enabling segments of the market to bypass traditional, hardware-intensive adoption methods. South America is projected to grow at a CAGR of 10.0% through 2031, with Brazil serving as the regional anchor due to its extensive commercial farming base and increasing technology investments. Argentina and Brazil together provide a strong foundation for guidance systems, satellite monitoring, autonomous fieldwork, and drone-supported agronomy, driven by their large-scale row-crop production.
Europe remains the most compliance-driven region in the digital agriculture market, as subsidy eligibility and sustainability regulations increasingly link digital records to farming practices. France and Germany are focusing on agricultural robotics collaboration, supporting a regional shift toward autonomous machinery and digital control systems. In contrast, Russia is anticipated to see more subdued growth due to sanctions, import restrictions, and inconsistent access to technology, which continue to hinder the pace of farm digitalization. The Farm to Fork strategy, targeting a 50% reduction in pesticide use by 2030, is increasing demand for subscription-based analytics to optimize chemical use [3]Source: European Commission, “Farm to Fork Strategy,” European Commission, food.ec.europa.eu. Data governance laws granting farmers ownership of telemetry data are shaping platform designs to support open exchange frameworks. Furthermore, manufacturers are localizing edge artificial intelligence modules to align with the European Union Artificial Intelligence Act, thereby shortening certification timelines.

Regulatory Landscape
Digital agriculture regulation is increasingly centered on data access, portability, and trusted sharing frameworks, alongside rules that affect how digital tools are used in-field. In the European Union, the EU Data Act enters into force in 2025, tightening requirements around access to and use of data generated by connected equipment and services across the agri-food chain. The EU also moved to formalize farm-level sustainability reporting infrastructure through Commission Implementing Regulation (EU) 2024/2746, which applies from November 11, 2025 and sets operational rules for the Farm Sustainability Data Network, increasing demand for compliant data capture, interoperability, and audit-ready record keeping.
Outside Europe, governments are building agricultural digital public infrastructure and setting agency AI governance expectations that shape platform design and procurement. India approved the Digital Agriculture Mission on September 2, 2024 with an outlay of Rs 2,817 crore to build digital public infrastructure for agriculture, supporting national-scale registries and data rails that vendors must integrate with for public programs. In March 2026, Kenya published draft instruments, including the Agricultural Data, Information and Digital Policy and the Digital Agricultural Information Bill, aiming to centralize governance through a Kenya Agricultural Digital Information Centre (KADIC). In the United States, USDA has put in place its FY 2025-2026 AI Strategy and refreshed its data governance approach for the same period, reinforcing expectations around responsible AI use and data management for technology deployed in federally influenced agricultural programs.
Competitive Landscape
The digital agriculture market is moderately concentrated, with the top five companies being Deere and Company, Bayer AG, AGCO Corporation, CNH Industrial N.V., and Syngenta Group. However, competition remains broad, allowing space for specialized providers in software, sensors, satellite analytics, and workflow solutions. Deere focuses on integrating machinery, telemetry, and Operations Center workflows, while Bayer leverages FieldView’s agronomy network and data ecosystem. AGCO Corporation, CNH Industrial N.V., and Syngenta Group emphasize brand-agnostic precision systems, zero-subscription connectivity, and open platform development, maintaining active competition across the market.
New competitive opportunities are emerging in areas such as carbon measurement, reporting, and verification (MRV), embedded finance, and satellite-enabled crop intelligence, particularly for mid-scale farms in growth regions. For instance, Indigo Ag’s long-term soil carbon agreement with Microsoft demonstrates how technology companies outside traditional farm inputs can enter the market through sustainability initiatives rather than equipment or seed offerings. Similarly, Planet Labs and its Sinergise subsidiary highlight an alternative approach by selling satellite analytics directly to public agricultural monitoring systems instead of relying solely on agribusiness intermediaries. These developments indicate that future market power will increasingly rely on data quality, workflow integration, and cross-channel partnerships rather than machinery scale alone.
Smaller specialized providers remain important in the digital agriculture market, with opportunities in crop intelligence, soil sensing, weather analytics, and enterprise services. Companies such as DTN, CropX, Planet Labs, Taranis, Indigo Ag, and Farmers Edge compete in niches where deep data expertise or workflow specialization can mitigate scale disadvantages. Meanwhile, large incumbents continue to expand their ecosystems through acquisitions, partnerships, and developer access, increasing switching costs for farms already integrated into their systems. This dynamic between leading platforms and active specialists ensures ongoing competition while rewarding companies that can effectively connect farm operations to carbon, finance, and supply chain reporting within a unified environment.
Digital Agriculture Industry Leaders
Deere & Company
CNH Industrial N.V.
AGCO Corporation
Bayer AG
Syngenta Group
- *Disclaimer: Major Players sorted in no particular order

Market Opportunities and Future Outlook
Opportunities cluster around solutions that reduce friction across hardware, software, and compliance workflows, especially where data portability and verified performance are becoming procurement prerequisites. The shift to formal reporting and data-sharing regimes in the EU, including the Farm Sustainability Data Network rules applying from November 2025, and the EU Data Act entering into force in 2025, creates room for tools that normalize machine logs, agronomy records, and sustainability indicators into auditable datasets while minimizing duplicate data entry. A similar opening is visible in countries building agricultural digital public infrastructure. In India, the Digital Agriculture Mission (approved September 2, 2024) supports scaled deployment of digital registries and service delivery rails that can accelerate demand for interoperable farm management, advisory, and traceability modules integrated with public systems.
A second opportunity area is commercialization of autonomy and AI-enabled field operations through both OEM ecosystems and retrofit pathways, widening addressable fleets beyond new equipment sales. Funding activity in 2026 points to this direction, including Leaps by Bayer participating in an oversubscribed Series B for Sabanto to scale autonomous retrofit technology for row crops (July 2026), and Rize raising USD 31 million to scale AI-powered tools for sustainable rice farming in Vietnam and Indonesia (July 2026). As governments and large buyers emphasize measurable outcomes, vendors that package sensing, analytics, and actuation into outcome-based offerings, such as input reduction, verified records, and labor substitution, can convert adoption barriers into service-led deployments, including in faster-digitizing regions where connectivity and digital governance initiatives are expanding.
Recent Industry Developments
- July 2026: Sabanto and Leaps by Bayer announced an oversubscribed Series B financing to scale Sabanto’s autonomous retrofit technology for row crop farming. The funding supports broader deployment of retrofit autonomy as an alternative to full fleet replacement, expanding autonomy access to farms operating mixed-age equipment fleets. It also signals continued investor focus on autonomy solutions that can be layered onto existing machinery ecosystems.
- April 2026: John Deere unveiled the forthcoming See & Scout capability as part of its See & Spray precision agriculture portfolio, targeting improved in-field data capture and weed pressure mapping. The addition strengthens Deere’s integrated approach linking sensing and actuation, supporting chemical-saving workflows and higher-value subscription features inside its digital stack. It also increases competitive pressure on stand-alone scouting and imagery analytics vendors to integrate more tightly with execution platforms.
- November 2024: Microsoft launched tailored AI models optimized with industry-specific data, including applications for the agricultural market. The release reinforced the availability of enterprise AI building blocks that can be embedded into farm management, advisory, and supply chain tools. It also accelerated the pace at which agronomy software providers can add AI features without developing full model stacks from scratch.


Research Methodology Framework and Report Scope
Market Definition and Coverage
For this methodology, the market covers digital tools used in crop and livestock operations to capture field data, move it through connectivity, and convert it into on-farm decisions and actions, from sensing through to the farm gate.
Scope exclusions: We exclude commodity trading platforms and food processing software because they sit downstream from the farm gate and follow different demand drivers.
Segmentation Overview
- By Technology
- Guidance Systems
- Remote Sensing and Imaging
- Variable Rate Technology
- Artificial Intelligence and Advanced Analytics
- Internet of Things and Connected Sensors
- Blockchain and Traceability
- Robotics and Automation
- By Component
- Hardware
- Software
- Services
- By Application
- Crop Monitoring
- Yield Mapping and Forecasting
- Soil Monitoring and Soil Health Analytics
- Weather Tracking and Forecasting
- Precision Spraying and Input Optimization
- Drone Analytics
- Livestock Health Tracking
- By Farm Size
- Small-Scale Farms (Less Than 100 ha)
- Medium-Scale Farms (100 - 500 ha)
- Large-Scale Farms (More Than 500 ha)
- By Geography
- North America
- United States
- Canada
- Mexico
- Rest of North America
- Europe
- Germany
- United Kingdom
- France
- Italy
- Spain
- Russia
- Rest of Europe
- Asia-Pacific
- China
- India
- Japan
- Australia
- South Korea
- Rest of Asia-Pacific
- South America
- Brazil
- Argentina
- Rest of South America
- Middle East
- Saudi Arabia
- United Arab Emirates
- Turkey
- Rest of Middle East
- Africa
- South Africa
- Egypt
- Rest of Africa
- North America
Data Sources, Market Sizing, and Validation
Desk Research
Desk research set the structure of the market and helped us build realistic demand signals that can be checked region by region. We used public references such as USDA and NASS publications, FAOSTAT, World Bank indicators, and telecom connectivity series from groups such as the ITU to understand farm activity, digital access, and adoption barriers.
We also reviewed sources such as patent databases to track innovation intensity, along with company annual reports, investor presentations, and reputable agriculture technology press to map product positioning and pricing logic. Where needed, we leaned on paid subscriptions for company financials and intelligence, plus news and financials coverage, so that revenue discussion and deal activity could be validated over time. These examples are not exhaustive, and many other public and paid references were also used for data collection, cross-checking, and clarification.
Primary Interviews and Surveys
Primary work focused on validating what is actually purchased and used on farms, and how budgets are split between hardware, software, and connected services. We spoke with a mix of solution providers, channel partners, farm operators, and advisers across major regions so that adoption rates, average spend patterns, and the pace of upgrades could be confirmed and then used to tighten model assumptions.
Distribution of primary research fieldwork respondents
| Company type | Respondent position | Region |
|---|---|---|
| Top tier: 34% | CXOs: 13% | APAC: 49% |
| Mid tier: 49% | Functional/Unit leaders: 35% | EMEA: 29% |
| Smaller Players: 17% | Managers: 52% | Americas: 22% |
Market-Sizing & Forecasting
We sized the market using a top-down and bottom-up approach, where the top-down view was built by reconstructing the addressable demand pool from farm activity and digital adoption, and then translating that into spend. In practice, the model starts with indicators such as cultivated area and farm output intensity, then applies practical adoption and replacement cycles for connected sensors, precision-enabled machinery attachments, and farm software usage.
To keep the totals realistic, the results were corroborated with selective bottom-up approximations, such as sampled average selling price ranges multiplied by estimated shipped or deployed units in key use cases, followed by channel checks on how much spend is recurring versus one-time. Inputs that were tracked (illustrative) include connectivity availability in rural areas, rates of precision practice adoption, remote sensing use in crop monitoring, typical contract lengths for digital advisory, and the pace of feature upgrades that can shift average pricing.
For forecasting, we used scenario analysis supported by expert consensus, since policy pushes, weather volatility, and farm income cycles can move adoption faster or slower depending on the region and crop mix. When data was missing for smaller countries or niche applications, gaps were handled using proxy indicators and peer-region benchmarking, and then corrected after interview feedback on what is truly deployable and affordable.
Data Validation & Update Cycle
Validation was done through triangulation across independent signals, followed by a structured variance check before final sign-off. We compared outputs against indicators such as farm equipment digitization trends, connectivity progress, and reported demand commentary, and any outliers were reviewed to confirm whether they came from scope, timing, or pricing assumptions.
Draft models go through multiple analyst reviews, and re-contact is triggered when an assumption creates an unusual jump in spend per farm or an adoption curve that does not match field feedback. Reports are refreshed annually, with interim updates when material events occur, and a final pre-delivery pass is completed so clients receive the latest updated view.
Mordor Intelligence's Digital Agriculture Market Size Versus Other Published Estimates
Published market sizes for digital agriculture can vary even when the topic sounds the same, because authors make different choices on what to count and which year best represents the current market. Differences also come from how recurring software revenue is treated, how hardware replacement is modeled, and whether the estimate is refreshed after major shifts in farm spending or connectivity.
In the table below, the gaps mainly come from whether the scope stops at the farm gate or extends into downstream digital platforms, and whether pricing is built from realistic adoption curves or from aggressive expansion assumptions. Currency conversion timing and the treatment of bundled offerings (for example, hardware sold with a service contract) also create spread, particularly when regions are aggregated quickly without a second validation step.
Benchmark comparison
| Source | Market Size | Gaps in Research Methodology |
|---|---|---|
| Mordor Intelligence | USD 26.82 B (2026) | |
| Global Consultancy A | USD 29.78 B (2026) | Uses a broader demand perimeter that can pull in adjacent downstream digital platforms and assumes faster monetization of bundled services, which raises average spend per farm in early years. |
| Industry Study B | USD 22.53 B (2025) | Anchors the market in an earlier year and applies conservative adoption and replacement cycles, and it appears to downweight recurring software and advisory revenue when it is packaged with hardware. |
The table shows a fairly tight band around the mid-20s in the mid-decade, and the remaining spread is explained by scope and timing rather than a single data point. In Mordor Intelligence's model, value is counted only for on-farm digital solutions through the farm gate, and packaged offerings are separated into hardware and recurring service components before forecasts are applied.


Key Questions Answered in the Report
What is driving growth in digital agriculture through 2031?
Growth is being supported by input optimization, labor-saving automation, climate compliance, carbon data monetization, and lower onboarding friction from public digital infrastructure. The sector is projected to rise from USD 24.3 billion in 2025 to USD 43.7 billion by 2031 at a 10.3% CAGR.
Which technology segment leads digital agriculture revenue today?
Guidance systems lead the technology segment with 29.4% of 2025 revenue because they deliver broad, proven value across many crop types and machinery fleets.
Which application is expanding the fastest in this space?
Drone analytics is the fastest-growing application, with a projected 10.7% CAGR through 2031, helped by wider drone deployment and simpler operating rules in major farm markets.
Why is software gaining importance compared with hardware?
Hardware still held 43.2% of 2025 component revenue, but software is growing faster at 10.8% CAGR because vendors are shifting to subscriptions, recurring services, and integrated agronomy workflows.
Page last updated on:


 Your data is secure and never sold or shared.


