Digital Accessibility Software Market Size and Share
Market Overview
| Study Period | 2020 - 2031 |
|---|---|
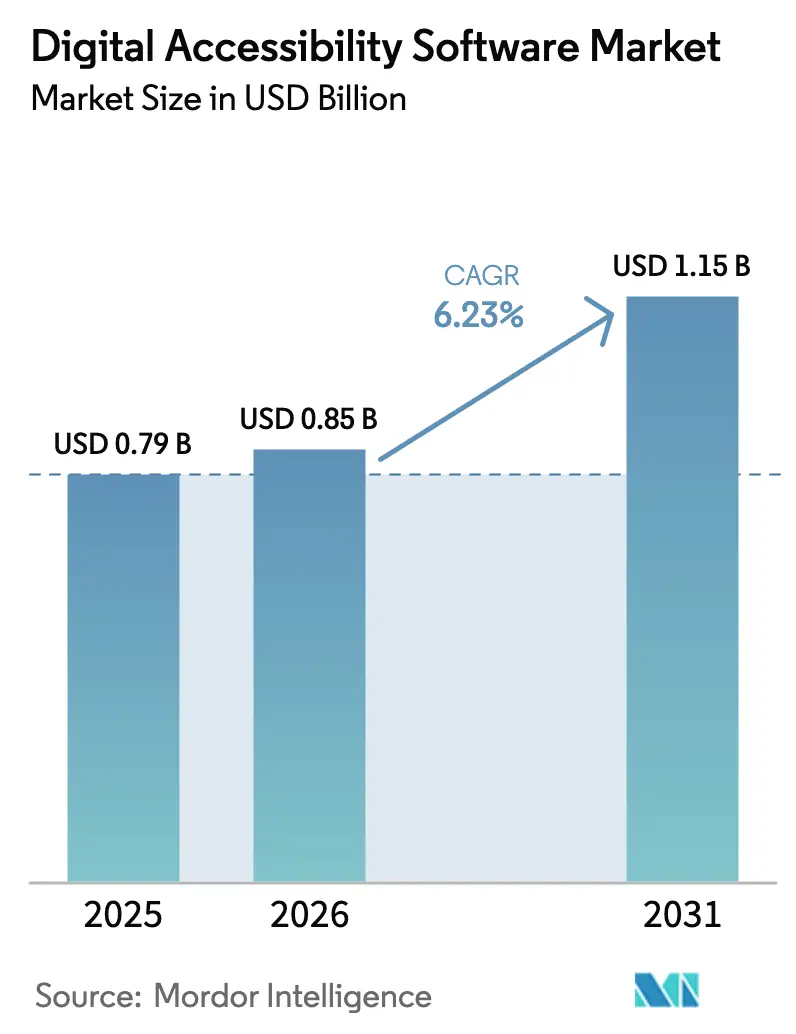
| Market Size (2026) | USD 0.85 Billion |
| Market Size (2031) | USD 1.15 Billion |
| Growth Rate (2026 - 2031) | 6.23% CAGR |
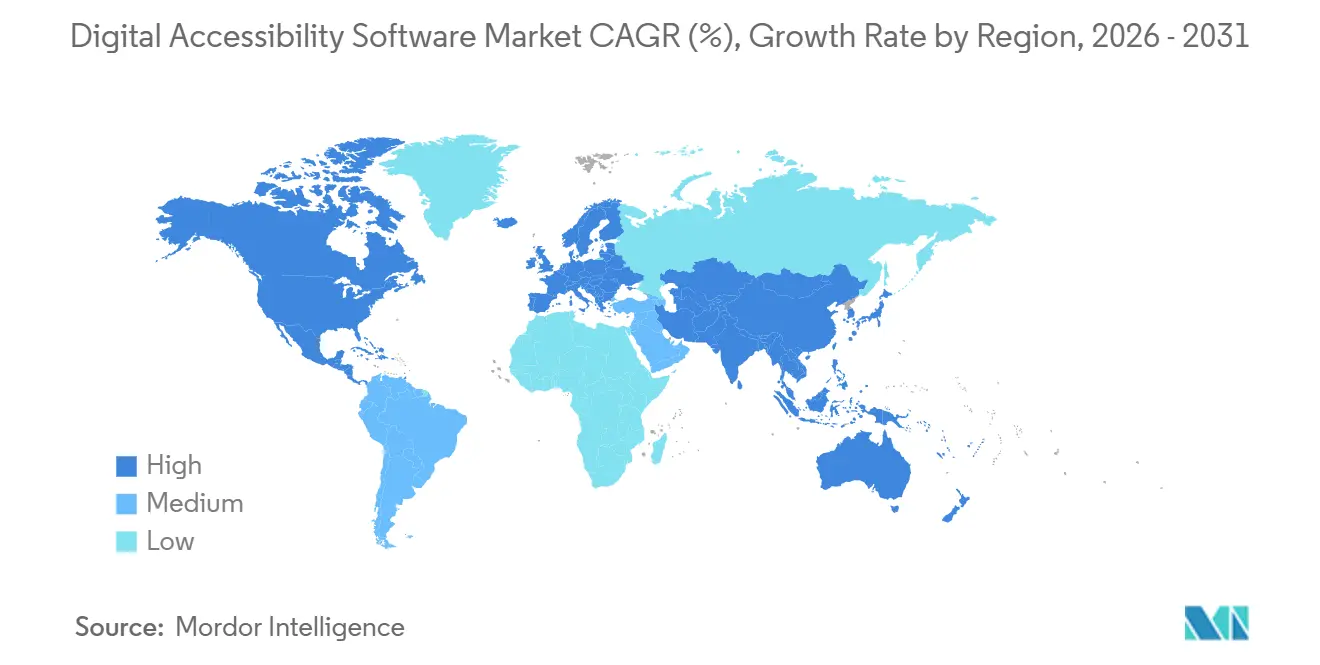
| Fastest Growing Market | Asia Pacific |
| Largest Market | North America |
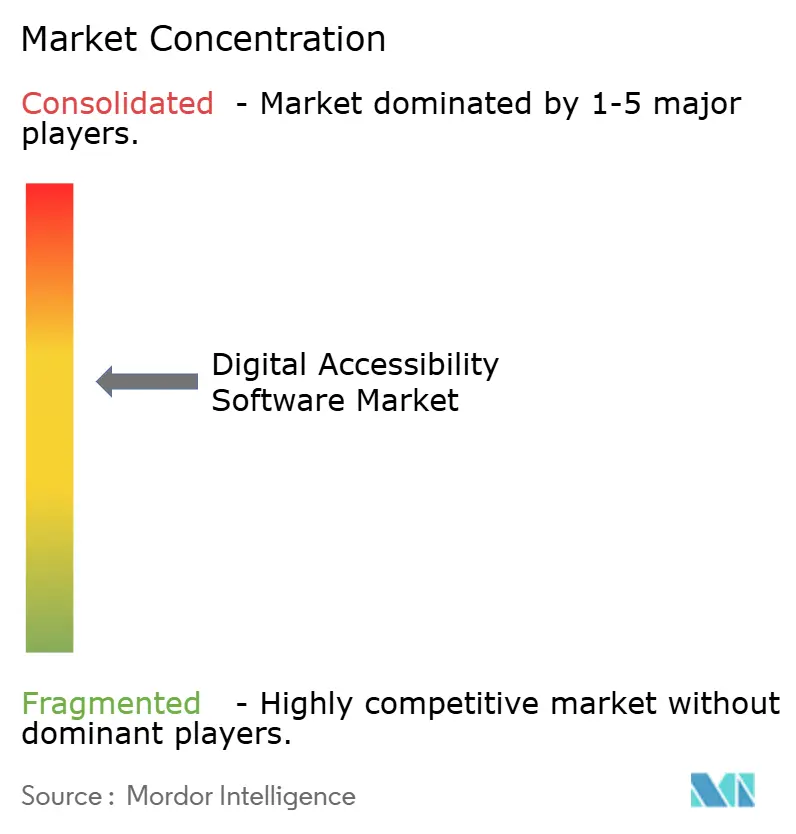
| Market Concentration | Medium |
Major Players *Disclaimer: Major Players sorted in no particular order Image © Mordor Intelligence. Reuse requires attribution under CC BY 4.0. | |
Digital Accessibility Software Market Analysis by Mordor Intelligence
The digital accessibility software market size is projected to be USD 0.79 billion in 2025, USD 0.85 billion in 2026, and reach USD 1.15 billion by 2031, growing at a CAGR of 6.23% from 2026 to 2031. Growth now comes from recurrent subscriptions rather than one-time audits because buyers must show continuous conformance in government tenders and ESG scorecards. October 2025 ISO adoption of WCAG 2.2 and June 2025 enforcement of the European Union Accessibility Act re-positioned accessible design as a revenue prerequisite instead of a legal afterthought. Cloud APIs that scan code during every commit, AI models that propose instant fixes, and procurement toolkits that auto-populate Accessibility Conformance Reports have turned conformance into a DevOps metric. North American demand remains anchored by Section 508 rules, yet Asia-Pacific is set to lead incremental spending as Japan, India, and Australia align private-sector contracts with mandatory guidelines. Platform differentiation now pivots on AI accuracy, mobile-first testing, and the depth of human audit services that validate machine output.
Key Report Takeaways
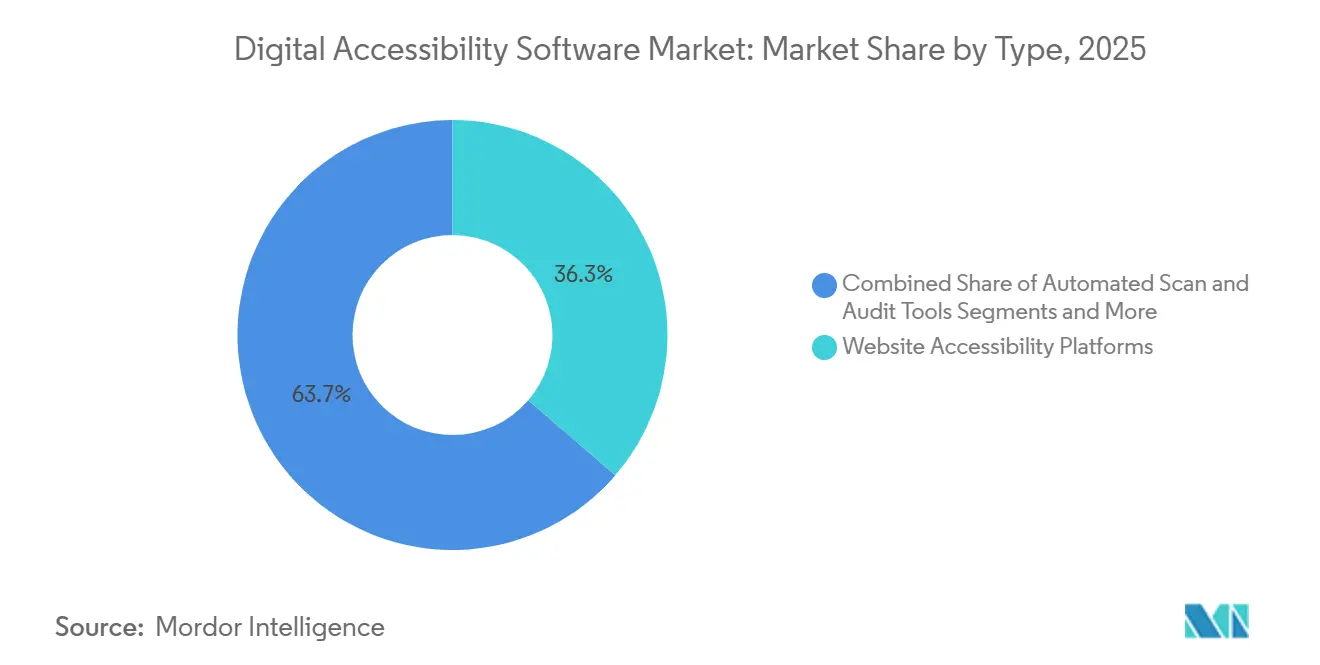
- By type, website accessibility platforms captured 36.32% share in 2025, while mobile and app accessibility suites are forecast to increase at a 7.39% CAGR.
- By deployment mode, cloud-based solutions commanded 64.13% of the digital accessibility software market share in 2025 and are projected to grow at a 6.61% CAGR to 2031.
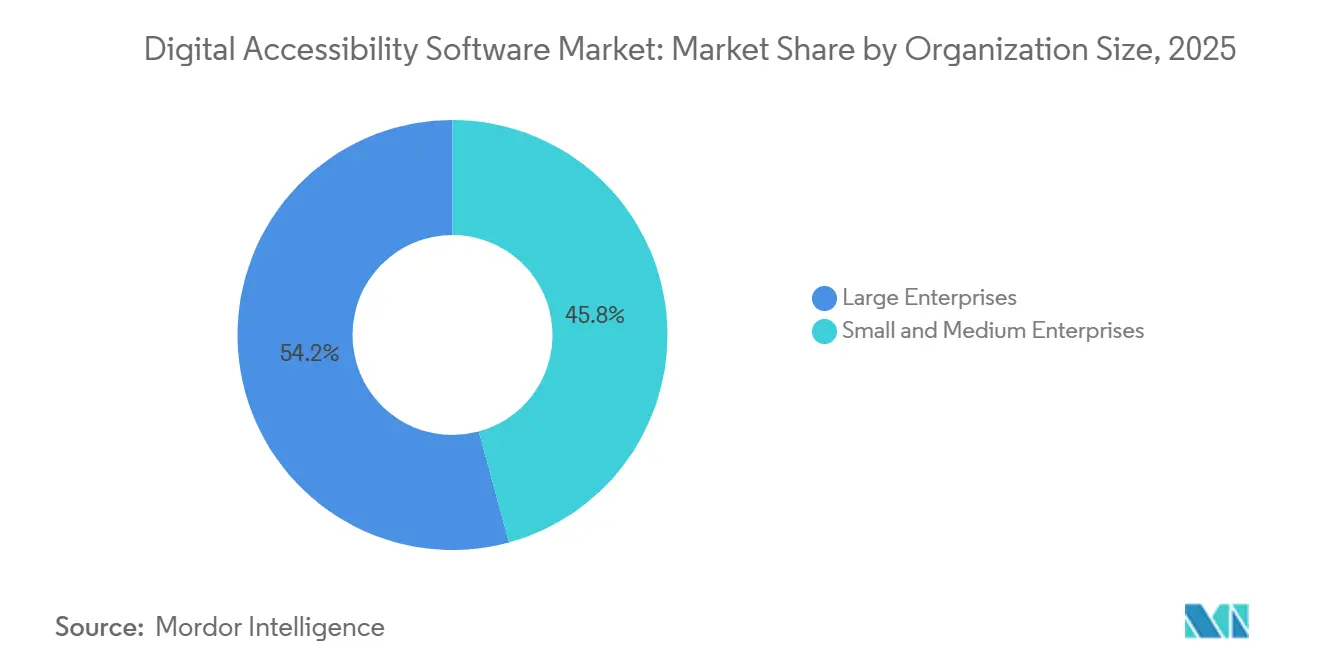
- By organization size, large enterprises accounted for 54.23% of 2025 revenue, whereas small and medium enterprises are advancing at a 6.59% CAGR.
- By end-user industry, e-commerce and retail led with 22.76% of 2025 spending, and the government and public sector are on track for a 7.41% CAGR through 2031.
- By geography, North America held 39.87% share of the digital accessibility software market in 2025, while Asia-Pacific is forecast to expand at a 7.21% CAGR through 2031.
Note: Market size and forecast figures in this report are generated using Mordor Intelligence’s proprietary estimation framework, updated with the latest available data and insights as of 2026.
Global Digital Accessibility Software Market Trends and Insights
Drivers Impact Analysis*
| Driver | (~) % Impact on CAGR Forecast | Geographic Relevance | Impact Timeline |
|---|---|---|---|
| Rapid Adoption of WCAG 2.2 Standards | +1.8% | Global, Strongest in North America and Europe | Medium Term (2–4 Years) |
| AI-Driven Remediation Accuracy Exceeding 90 Percent | +1.5% | North America and Asia-Pacific | Short Term (≤2 Years) |
| Government Procurement Rules Mandating Section 508 Compliance | +1.3% | North America, Emerging in Australia and Singapore | Long Term (≥4 Years) |
| Low-Code and No-Code Tools Reducing Buyer TCO | +0.9% | Global SME Segment | Medium Term (2–4 Years) |
| ESG Scorecards Adding Digital-First CX KPIs | +0.6% | Europe and North America | Long Term (≥4 Years) |
| Expansion of Streaming Services Requiring Accessible Video | +0.5% | Global, High in North America and Europe | Medium Term (2–4 Years) |
| Source: Mordor Intelligence | |||
Rapid Adoption of WCAG 2.2 Standards
ISO/IEC 40500:2025 elevated WCAG 2.2 from voluntary guidance to a formal benchmark, and Fortune 500 sourcing teams now list Level AA conformance as a mandatory bid criterion. European regulators allow members to upgrade from WCAG 2.1, so vendors must support multi-version testing to win continental contracts.[1]European Commission, “European Accessibility Act,” ec.europa.eu German and French agencies plan to adopt WCAG 2.2 by 2027, accelerating refresh cycles for legacy scanning engines. Platforms with modular rule libraries ingest new criteria faster, giving them a first-mover advantage when procurement deadlines tighten. Deque Systems’ January 2026 release claims four-fold faster testing after retraining models on the expanded rule set, highlighting how algorithmic agility influences renewal rates.
AI-Driven Remediation Accuracy Exceeding 90 Percent
Large language models fine-tuned on accessibility data reached 92% precision in 2025, reducing false positives that historically eroded buyer confidence. Automated code suggestions now cut developer fix time from hours to minutes, making continuous scanning economically viable for mid-market firms. Google’s March 2026 Natively Adaptive Interfaces framework pushes AI to the browser layer, letting UIs auto-adjust for motor impairments.[2]Google AI Team, “Natively Adaptive Interfaces Framework,” ai.googleblog.com As automation scales, organizations uncover hidden issues in legacy apps, which sustains consulting demand for edge-case validation. Vendors pairing AI triage with on-demand human auditors therefore capture both volume and complexity revenue streams.
Government Procurement Rules Mandating Section 508 Compliance
The 2024 update to the U.S. Section 508 Solicitation Review Tool auto-rejects bids lacking Accessibility Conformance Reports, closing loopholes that once delayed adoption. Twenty-three U.S. states replicated the rule in 2025, and Australia’s Digital Transformation Agency required WCAG 2.1 Level AA across federal services the same year. Singapore earmarked SGD 3 billion (USD 2.2 billion) for digital inclusion programs that mandate conformance audits, turning accessibility into a budget-line item rather than a discretionary spend. Vendors now market directly to procurement officers, bundling template generation and audit trails into subscription fees. This shift creates predictable renewal cycles tied to multi-year government frameworks.
Low-Code and No-Code Tools Reducing Buyer TCO
Overlay widgets can be installed in minutes on Shopify or Wix stores, compressing the sales cycle to a 2-week self-service trial. Monthly fees between USD 50 and USD 500 put entry-level conformance within reach of micro-sellers. Yet disability advocates warn that overlays can hide, not fix, root-code issues, a stance validated by the Federal Trade Commission's January 2025 USD 1 million fine against accessiBe for deceptive claims. The market has consequently bifurcated: overlays drive first-time adoption among cost-sensitive buyers, while enterprises favor full-stack suites that integrate scans into continuous pipelines. Vendors straddling both segments must reconcile contrasting expectations on price and proof.
Restraint Impact Analysis*
| Restraint | (~) % Impact on CAGR Forecast | Geographic Relevance | Impact Timeline |
|---|---|---|---|
| Lack of Unified Global Enforcement Mechanisms | −0.7% | Global, Acute in Asia-Pacific and Middle East and Africa | Long Term (≥4 Years) |
| High False-Positive Rates in Legacy Engines | −0.5% | Global Users of Pre-2024 Tools | Short Term (≤2 Years) |
| Shortage of Certified Accessibility Auditors | −0.4% | North America and Europe, Severe in Asia-Pacific | Medium Term (2–4 Years) |
| Overlay-Fatigue Backlash Among Disability Advocates | −0.3% | North America and Europe | Short Term (≤2 Years) |
| Source: Mordor Intelligence | |||
Lack of Unified Global Enforcement Mechanisms
Corporations operating across continents juggle WCAG 2.0, 2.1, and 2.2 plus country-specific acts, each with unique timelines and penalties, elevating compliance overhead.[3]Government of Japan, “Act on Elimination of Discrimination against Persons with Disabilities,” 8.cao.go.jp Vendors must maintain multiple rule sets, which inflates R&D and sales enablement costs. Adoption in jurisdictions without fines, such as several Indian states, lags below 40%, diluting the total demand pool. Regional incumbents thrive by tailoring offerings to local nuances, complicating global platform rollouts. The absence of a unifying body akin to the ITU means certifications rarely transfer across borders, capping economies of scale.
High False-Positive Rates in Legacy Engines
Tools built before 2024 often misclassify dynamic single-page apps, resulting in false-positive rates above 30% and requiring costly manual triage.[4]International Association of Accessibility Professionals, “IAAP Certification Programs,” accessibilityassociation.org Enterprises that are locked into multi-year contracts now face either re-platforming costs or inflated consulting bills. Start-ups touting AI accuracies above 90% use these pain points as a wedge in competitive takeovers. Yet the migration path can be disruptive, because new engines require codebase re-indexing and staff retraining. This friction dampens short-term spending even as it sets the stage for a replacement cycle in the medium term.
*Our updated forecasts treat driver/restraint impacts as directional, not additive. The revised impact forecasts reflect baseline growth, mix effects, and variable interactions.
Segment Analysis
By Type: Mobile Suites Accelerate App-First Commerce
Mobile suites delivered the fastest growth trajectory, posting a projected 7.39% CAGR from 2026 to 2031 as banking, payments, and retail activity shifted to smartphone-centric super-apps in India, Indonesia, and Brazil. While website platforms still held 36.32% of the digital accessibility software market share in 2025, their growth tempers as desktop traffic plateaus. Mobile testing demands distinct capabilities, gesture simulation, biometric workflow checks, and API coverage for UIAccessibility and TalkBack, that many legacy scanners lack. Vendors such as Deque Systems cut mobile scan time by 75% after embedding gesture AI, giving them an edge with app-first enterprises.
Pressure on niche categories is rising. Color-contrast analyzers and captioning helpers are increasingly bundled into broader suites, pushing single-function products toward commoditization. Document and PDF remediation software enjoys sticky demand in government and finance, but loses share where workflows migrate to born-digital formats. Platforms that weave these tasks into one dashboard capture higher average selling prices and lower churn, reinforcing consolidation trends in the digital accessibility software market.


By Deployment Mode: Cloud Dominance Reflects API-First Architectures
Cloud deployments accounted for 64.13% of 2025 revenue thanks to elastic pricing and instant integration with GitHub, GitLab, and Bitbucket pipelines. Continuous scans at every commit reduce defect escape rates, so development teams see accessibility the same way they treat security testing. On-premise tools persist in defense and healthcare segments that must isolate source code, yet their growth lags behind the broader digital accessibility software market by several points. Hyperscalers intensified price pressure by embedding baseline scans in DevOps templates, forcing independent vendors to differentiate on accuracy, rule depth, or industry-specific presets.
The digital accessibility software market size for cloud subscriptions will expand as API-metered models align costs with surges in web traffic during holiday campaigns or live-streamed events. Conversely, perpetual-license models tied to on-premise installations face revenue headwinds because they lack usage-based upsell levers.
By Organization Size: Freemium Overlays Attract SMEs
Large enterprises still anchored 54.23% of 2025 sales, purchasing end-to-end suites that embed scans, remediation, and developer training. However, Small and Medium Enterprises, record a 6.59% CAGR because browser-based widgets can be activated without code changes on Shopify or Wix storefronts. The overlay backlash adds churn risk: the FTC penalty against accessiBe highlighted liabilities when automation masks rather than fixes violations.
Enterprise buyers, wary of fines and reputational damage, now ask vendors for proof of human review layers, which extend deal cycles but increase average contract values. Vendors that can upsell SMEs from freemium overlays to managed programs stand to expand their footprint across the digital accessibility software industry.
By End-User Industry: Public-Sector Rules Reconfigure Demand
E-commerce and retail maintained a 22.76% share of revenue in 2025 after high-profile lawsuits underscored that web stores are places of public accommodation under the Americans with Disabilities Act. Yet the government and public sector is rising faster at a 7.41% CAGR because updated solicitations auto-reject bids lacking Accessibility Conformance Reports. Vendors that can auto-generate these documents in hours rather than weeks enjoy a competitive moat.
Finance and insurance remain compliance heavyweights due to consent decrees, yet growth aligns with the overall digital accessibility software market, as many banks have already completed first-wave remediation. Media and entertainment spending is propelled by captioning mandates and the push for audio descriptions, while healthcare adoption lags as hospitals juggle electronic record upgrades alongside new accessibility tasks. The divergence confirms that litigation and procurement rules, not voluntary CSR, still dictate purchase urgency.
Geography Analysis
North America retained 39.87% of 2025 spending because of two decades of Section 508 oversight and a deep bench of certified auditors. Conformance budgets have now shifted from project implementations to continuous monitoring subscriptions, moderating regional growth. Asia-Pacific is projected to record a 7.21% CAGR to 2031, the fastest among all regions, driven by Japan’s private-sector mandate effective 2024, India’s extension of WCAG requirements to state portals, and Australia’s deadline for Level AA government sites. Singapore’s SGD 3 billion (USD 2.2 billion) inclusion program further accelerates regional demand.
Europe’s trajectory depends on the European Union Accessibility Act, which began enforcement in June 2025. Regulators have granted a soft grace period, focusing on guidance rather than penalties, creating a temporary plateau. German and French intentions to adopt WCAG 2.2 by 2027 will restart upgrade cycles, forcing vendors to juggle dual rule sets within a single platform.
South America shows rising interest as Brazil’s law requires digital services to be accessible, yet uneven enforcement slows procurement. Middle East and Africa adoption is nascent; South Africa’s 2025 draft Digital Inclusion Policy and the United Arab Emirates’ Smart Dubai framework hint at future momentum. Vendors eye channel partnerships with regional system integrators to navigate local tenders, while self-service overlays cater to cash-constrained buyers. The digital accessibility software market therefore evolves at uneven velocities, compelling suppliers to tailor commercial models to regional maturity levels.

Competitive Landscape
The top five suppliers, Level Access, Siteimprove, AudioEye, Deque Systems, and UserWay, captured roughly 45% of 2025 revenue, reflecting moderate concentration. Consolidation trends intensified when Level Access bought UserWay for USD 98.7 million in March 2024, folding overlay technology into an enterprise suite. Evinced’s USD 55 million Series C in December 2024 underscores investor appetite for AI-driven rule engines.
Strategic advantage now hinges on precision rates above 90%, mobile-app coverage, and rapid rule-set updates aligned with WCAG 2.2. Patent activity clusters around machine-generated code fixes; Deque Systems filed three patents in 2025 on this front. Hyperscaler moves may reshape the field: Microsoft embedded Accessibility Insights into Visual Studio Code in 2025, and Google unveiled adaptive interfaces in March 2026, commoditizing entry-level scanning. Vendors therefore differentiate through vertical-specific presets for finance or healthcare, or through premium customer-success programs that shorten time-to-conformance.
Reputational risk sharpens competitive lines. The FTC’s USD 1 million fine against accessiBe spotlighted the dangers of overstating overlay efficacy, prompting enterprises to demand transparent accuracy metrics and human validation. Platforms offering hybrid AI plus auditor services meet that bar, commanding higher prices yet longer sales cycles. Market entrants chasing the SME overlay niche must accept higher churn but enjoy viral adoption across app marketplaces. This duality keeps rivalry active, fueling further mergers as vendors seek end-to-end capability portfolios.
Digital Accessibility Software Industry Leaders
Siteimprove A/S
Level Access, Inc.
AudioEye, Inc.
Deque Systems, Inc.
accessiBe Ltd.
- *Disclaimer: Major Players sorted in no particular order

Recent Industry Developments
- February 2026: Google introduced Natively Adaptive Interfaces, an on-device machine-learning framework that autonomously adjusts UI elements for users with motor impairments, positioning accessibility as a differentiator in cloud negotiations.
- January 2026: Deque Systems released AI mobile testing that trims scan time by 75% through automated gesture simulation, closing a critical gap in native app conformance checks.
- October 2025: DevAlly secured EUR 2 million (USD 2.3 million) in seed funding to scale developer-centric accessibility tools across Europe.
- September 2025: Level Access launched AI routines that auto-generate Accessibility Conformance Reports, shortening federal bid documentation from weeks to hours.


Global Digital Accessibility Software Market Report Scope
The Digital Accessibility Software Market Report is Segmented by Type (Website Accessibility Platforms, Automated Scan and Audit Tools, Color-Contrast and Readability Checkers, Mobile and App Accessibility Suites, Video and Captioning Assist Tools, Document and PDF Remediation Software), Deployment Mode (Cloud-Based, On-Premise), Organization Size (Large Enterprises, Small and Medium Enterprises), End-User Industry (E-Commerce and Retail, Banking Financial Services and Insurance, Government and Public Sector, Healthcare and Life Sciences, Education, Media and Entertainment), and Geography (North America, South America, Europe, Asia-Pacific, Middle East and Africa). The Market Forecasts are Provided in Terms of Value (USD).
| Website Accessibility Platforms |
| Automated Scan and Audit Tools |
| Color-Contrast and Readability Checkers |
| Mobile and App Accessibility Suites |
| Video and Captioning Assist Tools |
| Document and PDF Remediation Software |
| Cloud-Based |
| On-Premise |
| Large Enterprises |
| Small and Medium Enterprises |
| E-Commerce and Retail |
| Banking, Financial Services and Insurance |
| Government and Public Sector |
| Healthcare and Life Sciences |
| Education |
| Media and Entertainment |
| North America | United States |
| Canada | |
| Mexico | |
| South America | Brazil |
| Argentina | |
| Colombia | |
| Rest of South America | |
| Europe | Germany |
| United Kingdom | |
| France | |
| Italy | |
| Spain | |
| Russia | |
| Netherlands | |
| Rest of Europe | |
| Asia-Pacific | China |
| Japan | |
| South Korea | |
| India | |
| Australia | |
| Singapore | |
| Rest of Asia-Pacific | |
| Middle East | Saudi Arabia |
| United Arab Emirates | |
| Rest of Middle East | |
| Africa | South Africa |
| Egypt | |
| Rest of Africa |
| By Type | Website Accessibility Platforms | |
| Automated Scan and Audit Tools | ||
| Color-Contrast and Readability Checkers | ||
| Mobile and App Accessibility Suites | ||
| Video and Captioning Assist Tools | ||
| Document and PDF Remediation Software | ||
| By Deployment Mode | Cloud-Based | |
| On-Premise | ||
| By Organization Size | Large Enterprises | |
| Small and Medium Enterprises | ||
| By End-User Industry | E-Commerce and Retail | |
| Banking, Financial Services and Insurance | ||
| Government and Public Sector | ||
| Healthcare and Life Sciences | ||
| Education | ||
| Media and Entertainment | ||
| By Geography | North America | United States |
| Canada | ||
| Mexico | ||
| South America | Brazil | |
| Argentina | ||
| Colombia | ||
| Rest of South America | ||
| Europe | Germany | |
| United Kingdom | ||
| France | ||
| Italy | ||
| Spain | ||
| Russia | ||
| Netherlands | ||
| Rest of Europe | ||
| Asia-Pacific | China | |
| Japan | ||
| South Korea | ||
| India | ||
| Australia | ||
| Singapore | ||
| Rest of Asia-Pacific | ||
| Middle East | Saudi Arabia | |
| United Arab Emirates | ||
| Rest of Middle East | ||
| Africa | South Africa | |
| Egypt | ||
| Rest of Africa | ||


Key Questions Answered in the Report
How fast will spending on cloud-based digital accessibility platforms grow?
Cloud subscriptions are projected to register a 6.61% CAGR through 2031 as API-first testing becomes standard in DevOps pipelines.
Which region will add the most new revenue by 2031?
Asia-Pacific is forecast to outpace all other regions with a 7.21% CAGR, propelled by mandates in Japan, India, and Australia.
Why are small businesses adopting accessibility tools now?
Freemium overlay widgets that install on Shopify or Wix stores reduce upfront costs, accelerating SME entry even though some buyers later upgrade to full-stack suites.
What triggered the recent rise in government demand?
Updated procurement portals in the United States and similar rules in Australia and Singapore now auto-reject bids without Accessibility Conformance Reports, forcing agencies to budget for continuous compliance.
How are vendors differentiating their products?
Leading platforms combine AI accuracy above 90%, mobile-app coverage, rapid WCAG 2.2 rule updates, and optional human audit services to reduce false positives and speed remediation.
What risk do overlay-only solutions face?
The Federal Trade Commission’s USD 1 million fine against accessiBe highlighted legal exposure when overlays mask rather than fix violations, leading enterprises to demand transparent efficacy data and human validation layers.
Page last updated on:


