
Diatomite Market Size and Share
Market Overview
| Study Period | 2021 - 2031 |
|---|---|
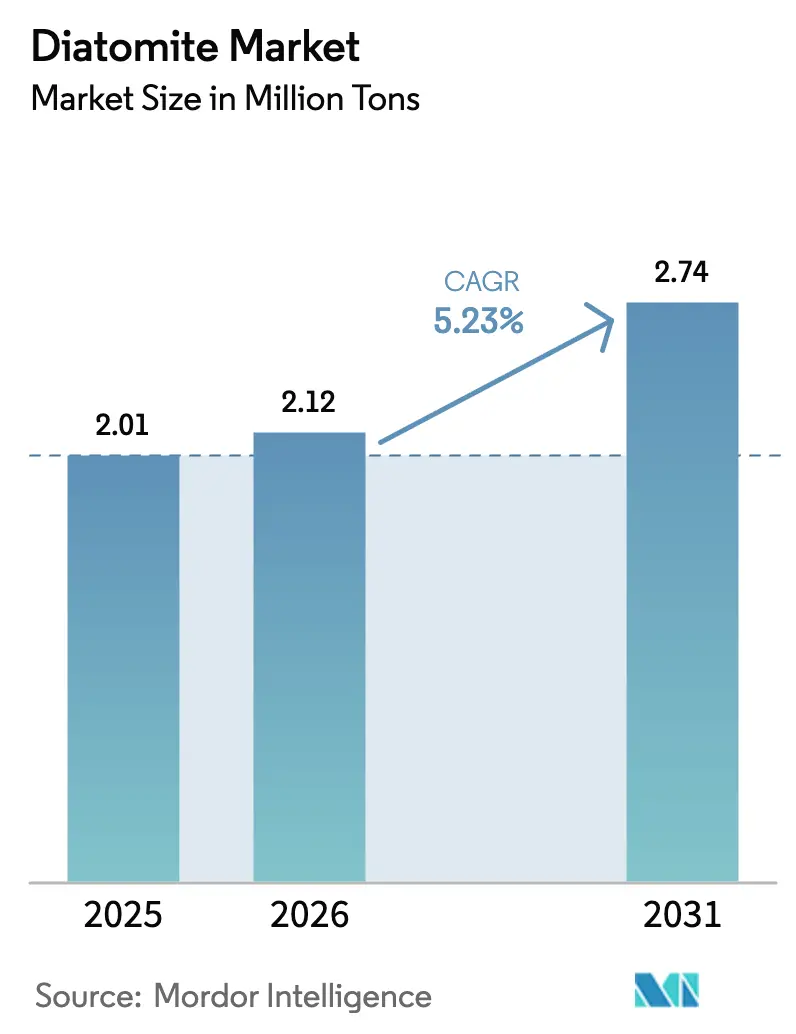
| Market Volume (2026) | 2.12 Million tons |
| Market Volume (2031) | 2.74 Million tons |
| Growth Rate (2026 - 2031) | 5.23 % |
| Fastest Growing Market | Asia Pacific |
| Largest Market | Asia Pacific |
| Market Concentration | Medium |
Major Players *Disclaimer: Major Players sorted in no particular order Image © Mordor Intelligence. Reuse requires attribution under CC BY 4.0. | |
Diatomite Market Analysis by Mordor Intelligence
The Diatomite Market size is expected to grow from 2.01 Million tons in 2025 to 2.12 Million tons in 2026 and is forecast to reach 2.74 Million tons by 2031 at 5.23% CAGR over 2026-2031. Structural shifts in beverage filtration, water treatment, and lightweight construction are reshaping demand, while deposit depletion in the Western U.S. accelerates the development of marine sources. Asia-Pacific dominates current trade flows, supplying almost one-half of worldwide tonnage and absorbing sizable volumes for cement additives and municipal water schemes. Flux-calcined grades are displacing standard calcined material in high-throughput brewery operations, and the insecticides segment is benefiting from organic-farming mandates. Competitive rivalry remains moderate because mine ownership is regional and logistics-intensive, yet scale advantages in kiln control and technical servicing allow the top five suppliers to capture the most profitable food-grade contracts.
Key Report Takeaways
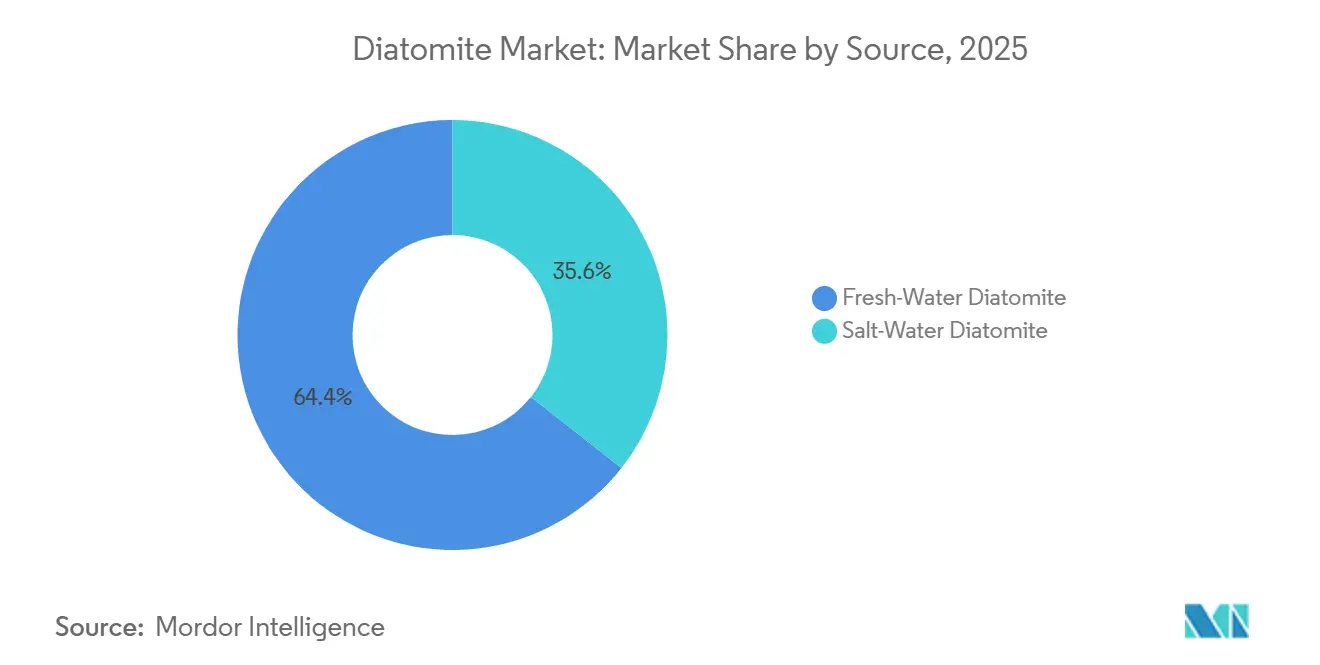
- By source, freshwater material commanded 64.38% of the 2025 volume, while saltwater grades are projected to grow at a 5.84% CAGR to 2031.
- By process, calcined grades led with 46.27% of the 2025 supply, whereas flux-calcined variants record the highest 6.18% CAGR.
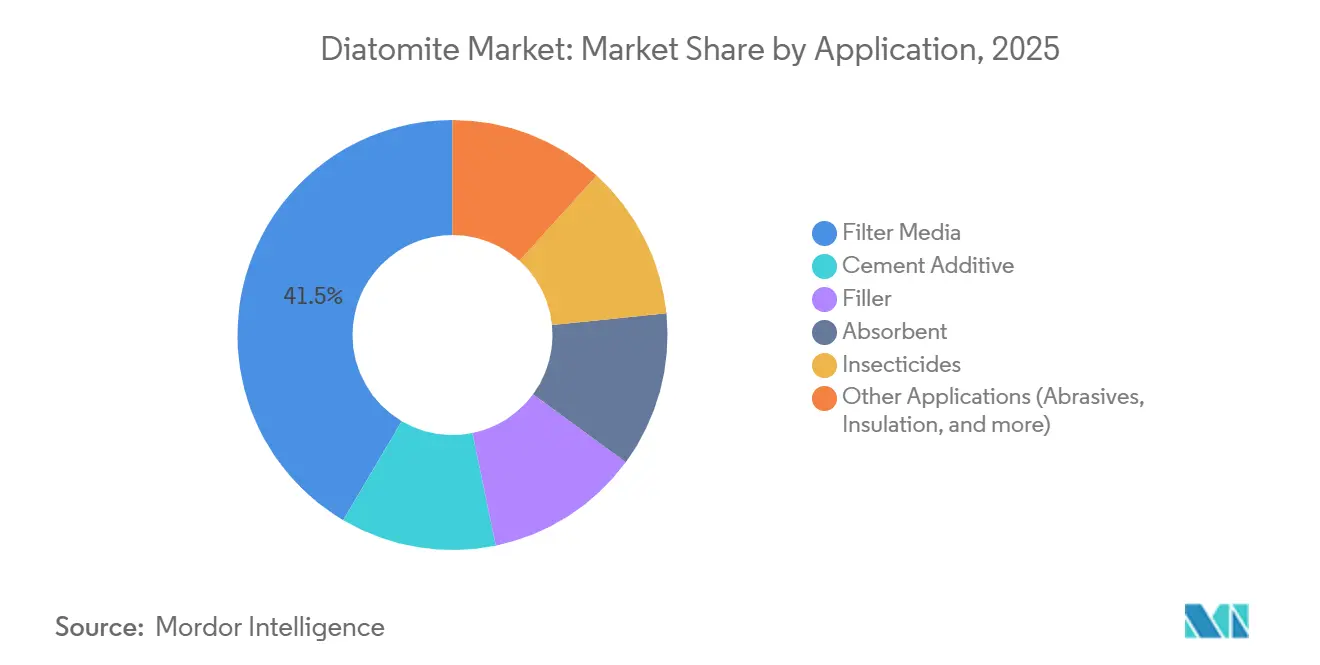
- By application, filter media accounted for 41.52% of 2025 demand; insecticides are advancing at a 6.27% CAGR.
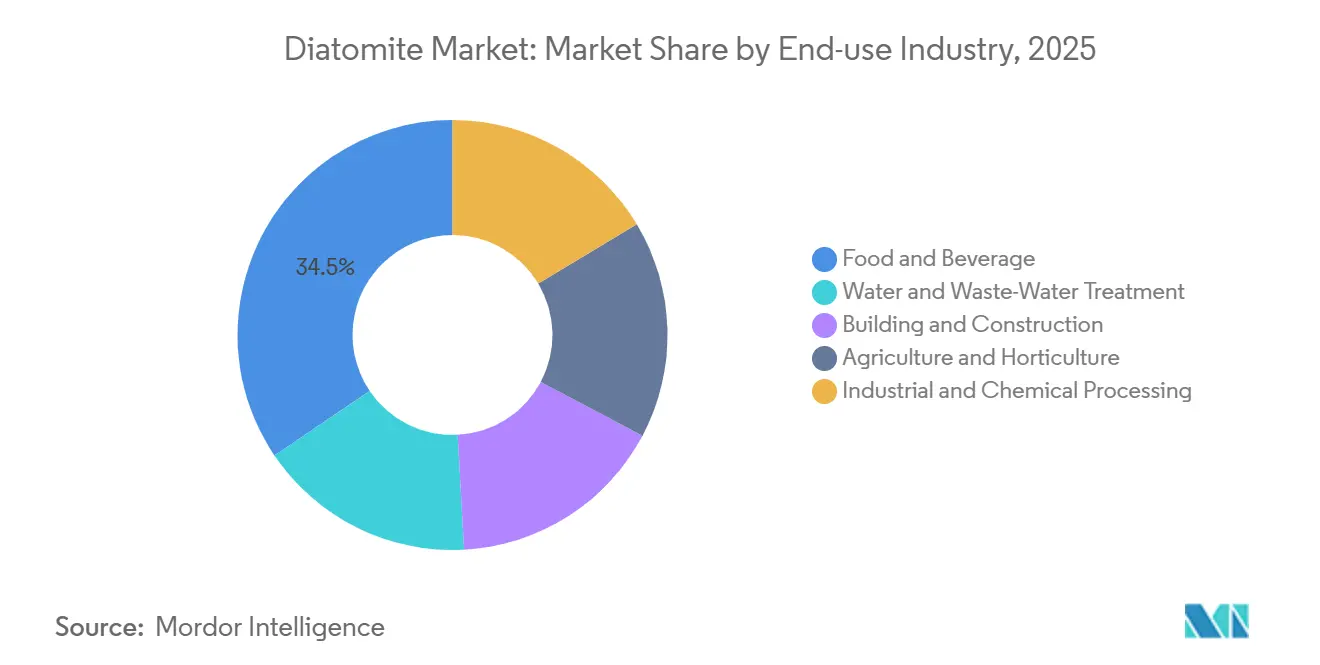
- By end-use industry, food and beverage held 34.46% of 2025 tonnage, but water and wastewater treatment is expanding at the fastest 6.34% pace.
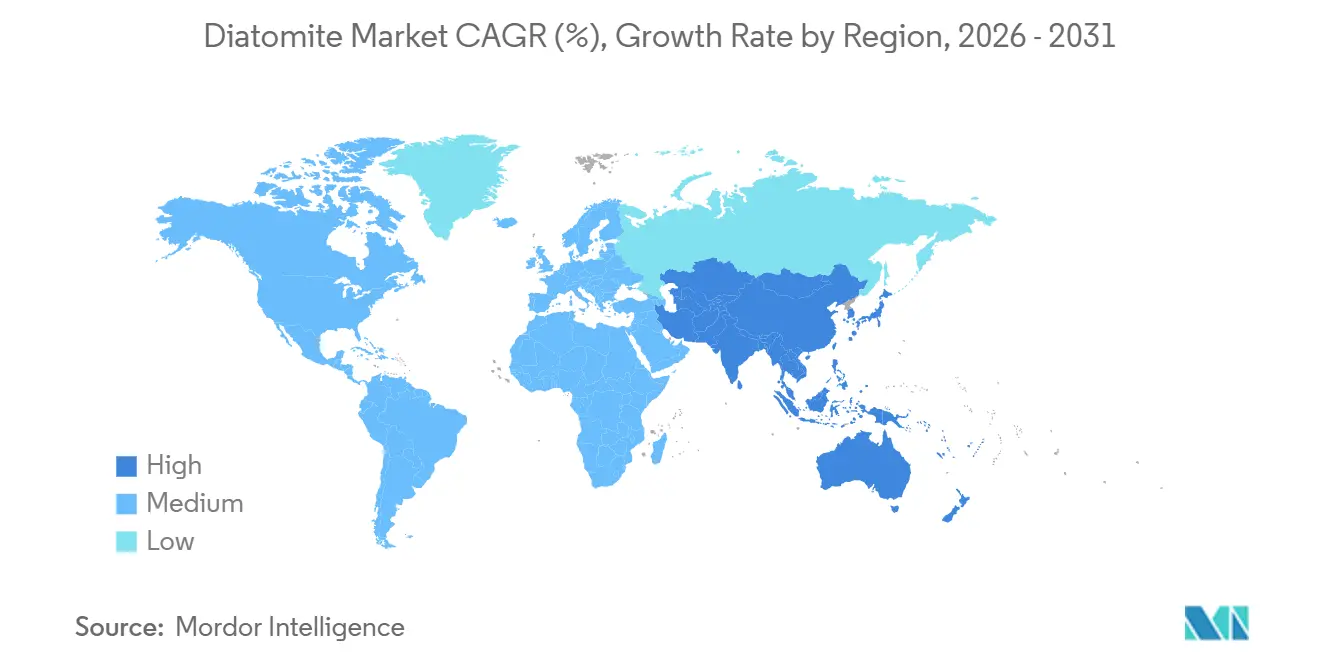
- Asia-Pacific captured 47.63% of 2025 shipments and is set to rise at a 5.91% CAGR through 2031.
Note: Market size and forecast figures in this report are generated using Mordor Intelligence’s proprietary estimation framework, updated with the latest available data and insights as of January 2026.
Market Trends and Insights
Drivers Impact Analysis of Diatomite Market*
| Driver | (~) % Impact on CAGR Forecast | Geographic Relevance | Impact Timeline |
|---|---|---|---|
| Rising demand for diatomite as filter media in beverages and water treatment | +1.2% | Global, with concentration in Asia-Pacific (India, China) and North America | Medium term (2-4 years) |
| Expansion of water and wastewater treatment infrastructure worldwide | +1.4% | Asia-Pacific (India, Southeast Asia), Middle East, North Africa | Medium term (2-4 years) |
| Growing use of calcined grades in lightweight concrete and cement additives | +0.9% | Asia-Pacific (China, India), Europe (Germany, Italy, Spain) | Long term (≥ 4 years) |
| Increasing consumption as absorbent in agricultural and pet-litter products | +0.7% | North America, Europe, emerging markets in South America | Short term (≤ 2 years) |
| Scale-up of diatomite-derived silicon for Li-ion battery anodes | +0.6% | Asia-Pacific (China, Japan, South Korea), North America (battery gigafactories) | Long term (≥ 4 years) |
| Source: Mordor Intelligence | |||
Rising Demand for Diatomite as Filter Media in Beverages and Water Treatment
Breweries and wineries specify diatomite because its multi-level pore structure removes yeast, bacteria, and haze while preserving flavor and operating at low pressure. The U.S. FDA continues to affirm the material as GRAS for food filtration, and the International Organisation of Vine and Wine maintains its approval, giving producers regulatory certainty[1]U.S. Food and Drug Administration, “GRAS Notice No. 87,” fda.gov. Municipal utilities employ diatomite precoat filters that meet the U.S. EPA’s 3-log protozoan-removal standard, and India’s Jal Jeevan Mission allocates more than USD 50 billion for rural schemes that mandate low-maintenance filtration media. Lower sludge generation than coagulation methods further reduces disposal cost in water-scarce regions.
Expansion of Water and Wastewater Treatment Infrastructure Worldwide
Programs such as India’s AMRUT 2.0, China’s rural wastewater mandate, and Middle East desalination upgrades collectively underpin long-cycle demand. Diatomite filters suit decentralized plants serving smaller populations because they require minimal energy and short replacement intervals, creating a stable offtake for producers. Pilot data from Saudi Arabia show a reduction in reverse-osmosis fouling that cuts the levelized water cost up to 12%.
Growing Use of Calcined Grades in Lightweight Concrete and Cement Additives
Calcined diatomite reacts with calcium hydroxide to form dense calcium silicate hydrates, trimming concrete thermal conductivity 20–30% with negligible strength loss, a property welcomed by European building codes focused on energy efficiency. China’s green-building program also incentivizes pozzolanic substitution. Consistency hinges on a narrow firing window; producers investing in real-time X-ray diffraction monitoring secure higher-value contracts.
Increasing Consumption as Absorbent in Agricultural and Pet-Litter Products
The U.S. EPA lists diatomite as a minimum-risk pesticide, enabling organic growers to replace synthetic actives. Premium pet litters in North America and Western Europe shift to diatomite blends that suppress odor and dust, expanding value per ton. Competition from super-absorbent polymers persists where extremely high uptake is required, but disposal advantages keep diatomite cost-competitive in moderate-volume uses[2]U.S. Environmental Protection Agency, “Surface Water Treatment Rule,” epa.gov.
Restraints Impact Analysis of Diatomite Market*
| Restraint | (~) % Impact on CAGR Forecast | Geographic Relevance | Impact Timeline |
|---|---|---|---|
| Substitution threat from expanded perlite, silica sand and synthetic media | -0.8% | Global, with higher intensity in Europe and North America (mature markets) | Short term (≤ 2 years) |
| Limited availability of high-purity deposits drives cost inflation | -0.5% | North America (Western U.S.), Europe (Spain, France) | Medium term (2-4 years) |
| Rising ESG-driven controls on crystalline-silica exposure | -0.4% | North America, Europe, Australia (stringent OSHA/EU enforcement) | Long term (≥ 4 years) |
| Source: Mordor Intelligence | |||
Substitution Threat from Expanded Perlite, Silica Sand and Synthetic Media
Expanded perlite offers similar insulation at lower density, while silica sand undercuts diatomite on price in filler applications. Ceramic and polymer membranes lure pharmaceutical users needing sterile, closed systems that reduce batch variability. These pressures are strongest in mature Western markets that emphasize lifecycle cost and sealed operation.
Limited Availability of High-Purity Deposits Drives Cost Inflation
Near-surface zones in California and Nevada are depleting, elevating strip ratios and clay contamination, and tightening supply for food-grade customers. Shipping economics limit profitable reach to about 500 km by truck and 1,500 km by rail, encouraging development of marine deposits in Turkey, Peru, and Mexico that still require costly washing to remove soluble salts.
*Our forecasts treat driver/restraint impacts as directional, not additive. The impact forecasts reflect baseline growth, mix effects, and variable interactions.
Diatomite Market Segment Analysis
By Source:
Freshwater Dominance Masks Emerging Coastal PotentialFreshwater deposits held 64.38% of the 2025 volume, reflecting their superior purity and well-documented performance in beverage filtration. Marine resources are expanding at a 5.84% CAGR as high-purity inland basins mature. Investors are funding coastal projects in Peru, Turkey, and Mexico to reduce inland haulage, despite extra USD 20–35 per-ton beneficiation charges. Species variation demands tight beneficiation to match pore-size profiles required by long-standing customer specifications.
Marine producers can leverage port proximity to ship directly to Asian buyers, offsetting higher processing costs. Standardizing quality remains the main barrier; breweries conduct rigorous validation, and any deviation from legacy grades risks production downtime. Suppliers integrating on-site labs and ISO-certified protocols are the first to win approvals. Long-term, broader adoption of saltwater material could rebalance regional supply and stabilize pricing.


By Process:
Flux-Calcined Grades Gain Traction in High-Throughput FiltrationCalcined material accounted for 46.27% of the 2025 supply because of its mechanical strength and low turbidity in the filtrate. Flux-calcined grades are the fastest-growing slice, climbing 6.18% yearly as breweries seek 30–50% lower pressure drop. Soda-ash addition during firing partially fuses frustules, producing wider channels without collapsing the structure. Producers must monitor residual sodium to keep it below 0.5% for wine compliance, which requires precise flux control and washing.
Capital intensity restricts flux-calcination to a few multinationals equipped with automated kilns and real-time XRD. These firms command premium margins by bundling technical support that improves throughput at customer sites. Smaller players focus on natural grades for absorbents and fillers where price, not pore architecture, dictates purchase choices.
By Application:
Insecticides Segment Rides Organic Agriculture WaveFilter media retained the top slot with 41.52% of 2025 demand, underpinned by food and beverage processing and municipal water projects. Insecticides, however, register the quickest 6.27% CAGR as regulatory bans on neonicotinoids and consumer preference for residue-free produce fuel uptake. Diatomite operates mechanically, abrading insect exoskeletons and averting resistance issues plaguing chemical actives.
Europe’s organic acreage and California’s specialty-crop sector illustrate this growth, while tropical regions utilize diatomite to safeguard stored grain where cold-chain infrastructure is sparse. Efficacy depends on a 10–50 µm particle band and low crystalline content for worker safety, encouraging suppliers to refine air classification lines.

By End-Use Industry:
Water Treatment Outpaces Food and BeverageFood and beverage maintained 34.46% of 2025 tonnage but is slowing as large brewers adopt centrifuges and haze-reducing recipes. Water and wastewater treatment is accelerating 6.34% yearly on the back of India’s USD 50 billion rural-water push and the U.S. EPA’s revised Lead and Copper Rule that mandates filtration upgrades. Builders continue to employ diatomite in cement and lightweight panels, yet clinker-reduction policies nudge some demand toward alternative binders.
Geography Analysis
APAC Diatomite Market
Asia-Pacific supplied 47.63% of 2025 demand and is forecast to expand 5.91% CAGR to 2031 as China mines roughly 1.5 million tons yearly and ramps wastewater spending under the 14th Five-Year Plan. India’s Jal Jeevan Mission and AMRUT 2.0 contribute repeat orders for filter media, while Japan and South Korea pilot diatomite-based silicon for batteries. Southeast Asia adopts diatomite for textile-sector effluent polishing where low energy and moderate capital outlay fit cluster economics.
North America Diatomite Market
North America grows slower because mature users switch to membranes. U.S. Silica’s Lovelock, Nevada mine remains the world’s largest, and recent operational gains delivered segment revenue of USD 142.8 million in Q1 2024. Canada imports for oil-sands filtration, and Mexico consumes for tequila clarification, two niche uses that reward consistent pore profiles.
Europe Diatomite Market
Europe’s share faces compliance headwinds. Imerys’ 2025 purchase of Chemviron’s assets consolidates regional supply with three new sites in France and Italy and about EUR 50 million (USD 56.53 million) revenue, allowing closer-to-customer delivery and perlite cross-selling. Ultrahigh energy-performance building codes encourage calcined pozzolan blends, but free fly ash and slag limit growth. Strict crystalline-silica exposure proposals may further elevate costs.
South America and MEA Diatomite Market
South America and the Middle East and Africa remain emerging. Brazilian housing adopts diatomite-lightened panels for thermal relief, and Argentina’s wine sector imports for clarification. Saudi Arabia studies diatomite as a supplementary cementitious material to reduce clinker in its 52.4 million-ton cement industry. South African mineral processors use diatomite absorbents, but local perlite and vermiculite temper volumes.

Value Chain Analysis
The diatomite value chain begins with deposit exploration and permitting, followed by surface mining of diatomaceous earth ore and primary beneficiation to remove clays and soluble salts, especially for salt-water sources. The key conversion step is thermal processing (natural drying, calcination, and flux-calcination), which depends on reliable fuel and tight kiln control to deliver low-turbidity, application-specific pore structures. As a result, many leading suppliers integrate mining with calcination and beneficiation to safeguard food and beverage and municipal filtration quality requirements.
Finished products move through two main routes: direct-to-customer supply for filtration applications (breweries, wineries, and water utilities) supported by on-site technical service, and distributor-led routes for absorbents, fillers, and agriculture. Logistics is a structural bottleneck because diatomite is bulky and low-to-mid value by weight for many grades, so proximity to rail spurs, ports, and regional warehouses can support cost competitiveness. Trade bodies also play a visible role in safe-use alignment and regulatory dialogue, including the International Diatomite Producers Association (IDPA), which supports coordination on handling practices and exposure controls across producing regions.
Competitive Landscape
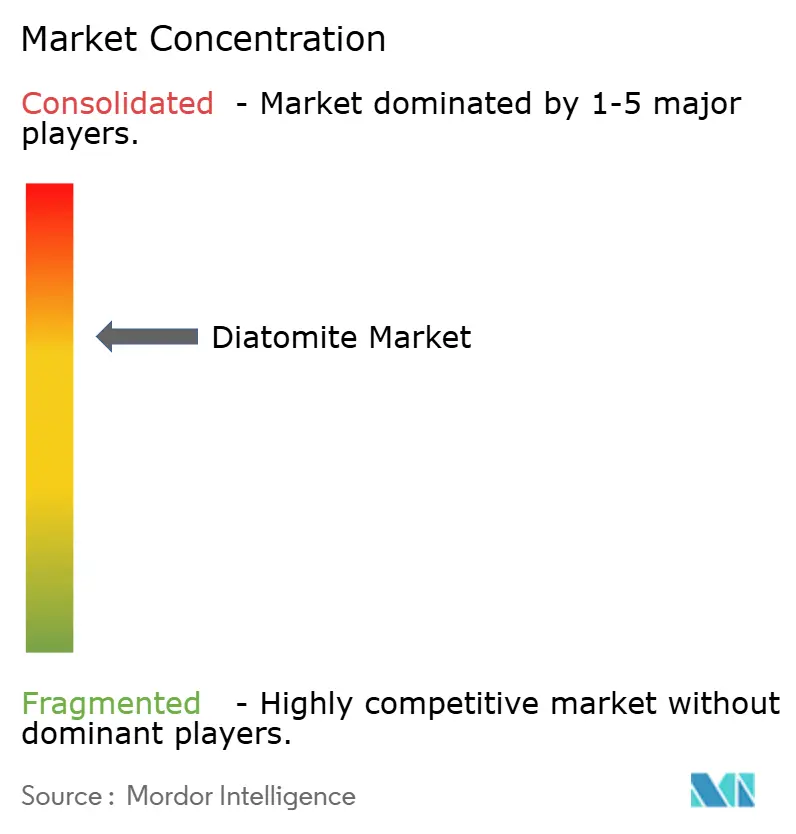
The Diatomite market is moderately consolidated. Vertical integration and technical service differentiate leaders. Firms owning rail spurs or coastal terminals achieve 15–25% freight savings, critical because logistics can exceed mine-gate value. On-site process-optimization teams help breweries and water utilities fine-tune dosing, reinforcing stickiness. Innovation white spaces include battery-grade silicon, photocatalytic air filters, and depth-filter sheets integrating cellulose fibers. Asian challengers are upgrading acid-leach capacity to move into premium beverage grades, but certification barriers remain.
Diatomite Industry Leaders
EP Minerals
Showa Chemical Industry Co., Ltd
Imerys
Dicalite Management Group, LLC
Diatomit CJSC
- *Disclaimer: Major Players sorted in no particular order
Diatomite Market Companies Covered in this Report
- American Diatomite Inc.
- Calgon Carbon Corporation
- Calgon Carbon Corporation
- Caltron Clays
- Chuanshan International
- Diatomit CJSC
- Diatomite Direct
- Dicalite Management Group, LLC
- Domolin
- EP Minerals
- Imerys
- Jilin Yuan Tong Mineral Co., Ltd.
- Nova Filtration Technologies Inc.
- Perma-Guard, Inc.
- Qingdao Best Diatomite Co., Ltd.
- Reade
- Seema Minerals & Metals
- Shengzhou Huali Diatomite Products Co., Ltd
- Shenzhou Xinglong Products of Diatomite Co,.Ltd
- Showa Chemical Industry Co., Ltd.

Market Opportunities and Future Outlook
Opportunities remain tied to expanding non-traditional supply and upgrading pathways as high-purity inland basins mature and freight economics limit long-haul movement of bulky minerals. The report context points to development of marine deposits in Turkey, Peru, and Mexico despite added beneficiation cost, which creates openings for producers with port-adjacent processing, ISO-certified quality systems, and application labs to qualify salt-water grades into filtration and other premium segments while feeding Asia-Pacific trade flows.
Performance-led product design also extends beyond commodity fillers, particularly where customers pay for consistency and compliance. In filtration and water treatment, buyers increasingly specify tight particle-size distributions and low impurity profiles, which favors investments in automated thermal control, real-time quality monitoring, and technical service teams that optimize dosing and throughput at customer sites. The report also flags differentiation pathways such as diatomite-derived silicon for Li-ion battery anodes and functionalized grades for polymer compatibility or catalytic functionality, where repeatable purity, pore architecture, and qualification-ready documentation can help suppliers win new specifications.
Recent Industry Developments in Diatomite Market
- April 2026: Imerys entered into a binding agreement to acquire Great Lakes Minerals, a US-based processor and distributor serving refractory and abrasives markets. While not a pure-play diatomite move, it expands Imerys' mineral solutions footprint and strengthens downstream processing and distribution capabilities that can be leveraged across industrial mineral portfolios.
- February 2025: Imerys completed the acquisition of Chemviron's European diatomite and perlite operations, adding production assets in France and Italy. The deal strengthens Imerys' access to premium European supply and improves proximity to filtration and industrial customers that value consistent, certified grades.
- April 2024: Calgon Carbon Corporation (via its subsidiary Chemviron) announced the sale of its diatomaceous earth and perlite assets to Imerys. The divestment signaled further consolidation around integrated mineral platforms and reshaped European competitive positioning for diatomite and adjacent perlite products.


Diatomite Market Report Scope and Research Methodology
Market Definition and Coverage
This market covers diatomite (diatomaceous earth) supplied as a mineral input and used across common industrial and consumer applications, measured through the quantities sold and consumed across major regions.
Scope exclusions: We exclude downstream finished goods value (such as packaged filter cartridges or branded cat litter) and focus only on diatomite volumes moving through the supply chain.
Segments Covered in This Report
- By Source
- Fresh-Water Diatomite
- Salt-Water Diatomite
- By Process
- Natural Grades
- Calcined Grades
- Flux-Calcined Grades
- By Application
- Filter Media
- Cement Additive
- Filler
- Absorbent
- Insecticides
- Other Applications (Abrasives, Insulation, etc.)
- By End-Use Industry
- Food and Beverage
- Water and Waste-Water Treatment
- Building and Construction
- Agriculture and Horticulture
- Industrial and Chemical Processing
- Geography
- Asia-Pacific
- China
- India
- Japan
- South Korea
- Rest of Asia-Pacific
- North America
- United States
- Canada
- Mexico
- Europe
- Germany
- United Kingdom
- Italy
- France
- Spain
- Russia
- Rest of Europe
- South America
- Brazil
- Argentina
- Rest of South America
- Middle-East and Africa
- Saudi Arabia
- South Africa
- Rest of Middle-East and Africa
- Asia-Pacific
Data Sources, Market Sizing, and Validation
Desk Research
Desk work starts with building the fact base for diatomite supply and consumption, meaning where the material is mined, where it is processed (natural, calcined, and flux-calcined), and where it is used as an input across regions. We lean on public sources such as the USGS mineral commodity data, UN Comtrade trade statistics, government mining and geology agencies, and environmental or water agencies that publish filtration and treatment indicators. Peer reviewed papers and patents are also checked to understand grade shifts (natural, calcined, flux-calcined) and the pace of adoption in filtration and construction additives.
Next, we shape the supply side using company filings, investor presentations, association websites, and reputed press updates for capacity changes, plant restarts, and new uses. Where it helps, paid subscriptions for company financials and intelligence, news and financials, patent databases, and shipment-level import and export records are used to confirm timelines and directional volumes. The sources listed here are illustrative only, and many other public documents were also used for data collection, validation, and clarification.
Primary Interviews and Surveys
Primary work is used to pressure-test the volume model and to fill gaps that public data does not explain well, such as grade mix, typical loss factors in processing, and how demand moves with filtration and construction activity. We speak with a mix of producers, processors, distributors, and large end users across APAC, EMEA, and the Americas so assumptions hold up across different supply chains and application patterns.
Distribution of primary research fieldwork respondents
| Company type | Respondent position | Region |
|---|---|---|
| Top tier: 29% | CXOs: 12% | APAC: 47% |
| Mid tier: 52% | Functional/Unit leaders: 31% | EMEA: 32% |
| Smaller Players: 19% | Managers: 57% | Americas: 21% |
Market-Sizing & Forecasting
The core sizing is built using a top-down approach where production and trade data reconstruct the apparent consumption pool by region, then it is adjusted using application-level demand signals. To keep the totals realistic, we corroborate the outcome with selective bottom-up approximations, such as sampled supplier and distributor checks, typical grade splits, and volume ranges discussed in interviews.
A few inputs matter more than others in this market, so we track them carefully. Examples include mined output and processing capacity utilization, import and export flows by major ports, grade mix shifts toward calcined and flux-calcined material, filtration media demand tied to beverages and municipal water treatment activity, and construction and cement additive trends that change usage intensity. For forecasting, scenario analysis is used around these variables because diatomite demand can swing with industrial output and water-treatment projects, and then the final path is aligned to expert consensus on realistic ramp-up rates. When local data is thin, gaps are handled with proxy indicators like regional trade patterns and installed processing capacity, followed by a re-check with primary inputs before finalizing.
Data Validation & Update Cycle
Outputs are checked through multiple steps so the story and the math agree. We compare model results against independent signals such as trade balances, capacity announcements, and major end-use activity indicators, then outliers are traced back to the specific assumption that caused the jump. If a variance is too large to explain with known events, we re-contact sources and re-check the desk inputs before sign-off.
The report is refreshed annually, and interim updates are made when material events occur (such as capacity additions, policy changes affecting mining, or sharp trade shifts). Before delivery, an analyst performs a fresh pass on key numbers so clients receive the most current view available at the time of publication.
Mordor Intelligence's Diatomite Market Estimate Compared With Other Published Estimates
It is normal to see different market sizes for diatomite because not everyone measures the same thing, and the timing of the numbers can differ. The gaps usually come from whether the estimate is volume or revenue based, how grade definitions are handled, and how much checking is done against real world supply and demand signals.
Key gap drivers in this market are mainly about unit choice and scope boundaries. Some publications report USD value, which depends heavily on assumed price levels, grade premiums, and currency timing, and those assumptions can move the headline number quickly. Others also bundle adjacent processed products or downstream finished goods value, which makes the total look bigger even if the mined and processed tonnage base is similar.
Benchmark comparison
| Source | Market Size | Gaps in Research Methodology |
|---|---|---|
| Mordor Intelligence | USD 2.12 M (2026) | |
| Industry Publisher A | USD 1.25 B (2025) | This is revenue-based and depends on price and grade-premium assumptions, so it will not line up with a tonnage model when average selling prices vary by region and processing level. |
| Industry Publisher B | USD 1.40 B (2024) | The estimate is value-based with a different base year, and the implied pricing path can widen results if it assumes faster price appreciation or a broader inclusion of processed grades. |
Trade-flow checks and regional capacity utilization bounds are the evidence that keep Mordor Intelligence tied to a physical tonnage pool for 2026, which is why the table shows a unit-driven spread against USD-based figures that lean on pricing assumptions. When the scope is kept to mined and processed diatomite volumes, the steps stay transparent and can be repeated with the same public signals and interview inputs.


Key Questions Answered in the Report
How large is the global diatomite market in 2026 and how fast is it growing?
The diatomite market size is 2.12 million tons in 2026 and is forecast to grow at a 5.23% CAGR to reach 2.74 million tons by 2031.
Which region leads global consumption?
Asia-Pacific holds 47.63% of 2025 volume, driven by China’s cement, filtration, and water-treatment demand.
What application segment is expanding the fastest?
Insecticide use of diatomite is rising at a 6.27% CAGR as organic farming spreads.
Why are flux-calcined grades gaining share?
Breweries and wineries adopt flux-calcined diatomite because its larger pore channels cut filtration pressure drop 30–50% and raise throughput.
Which end-use industry offers the quickest growth?
Water and wastewater treatment leads with a 6.34% CAGR, supported by large infrastructure programs in India and regulatory upgrades in North America.
Who are the major players in the sector?
Who are the major players in the sector?
Page last updated on:


 Your data is secure and never sold or shared.


