DevSecOps Market Size and Share
Market Overview
| Study Period | 2020 - 2031 |
|---|---|
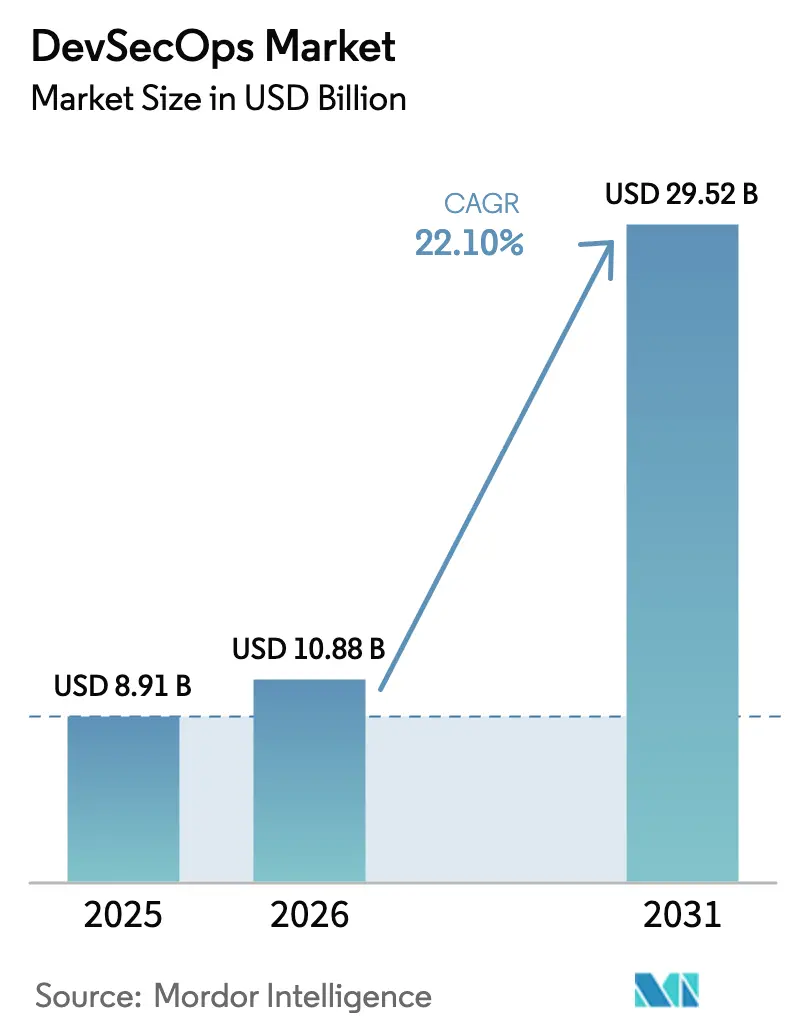
| Market Size (2026) | USD 10.88 Billion |
| Market Size (2031) | USD 29.52 Billion |
| Growth Rate (2026 - 2031) | 22.10% CAGR |
| Fastest Growing Market | Asia Pacific |
| Largest Market | North America |
| Market Concentration | Medium |
Major Players *Disclaimer: Major Players sorted in no particular order Image © Mordor Intelligence. Reuse requires attribution under CC BY 4.0. | |
DevSecOps Market Analysis by Mordor Intelligence
The DevSecOps market size is expected to grow from USD 8.91 billion in 2025 to USD 10.88 billion in 2026 and is forecast to reach USD 29.52 billion by 2031 at 22.10% CAGR over 2026-2031. Enterprises are accelerating adoption because quarterly security gates cannot keep pace with daily or even hourly code deployments. Simultaneous regulatory pressurefrom the United States’ Executive Order 14028 to Europe’s NIS2 directive forces organizations to embed security controls directly into software delivery pipelines rather than rely on downstream audits. Vendors that fuse application security testing, compliance automation, and AI-driven analytics into unified platforms gain clear traction, while managed service providers benefit from enterprises that lack specialist talent. Demand also rises in small and midsized enterprises (SMEs) as cloud-native tools lower entry barriers and quantify returns in months rather than years.
Key Report Takeaways
- By offering, Solutions captured 71.68% of the DevSecOps market share in 2025; Services are forecast to expand at a 25.4% CAGR through 2031.
- By deployment model, On-premise installations held 49.95% of the DevSecOps market size in 2025, while cloud deployments are projected to advance at a 26.6% CAGR between 2026-2031.
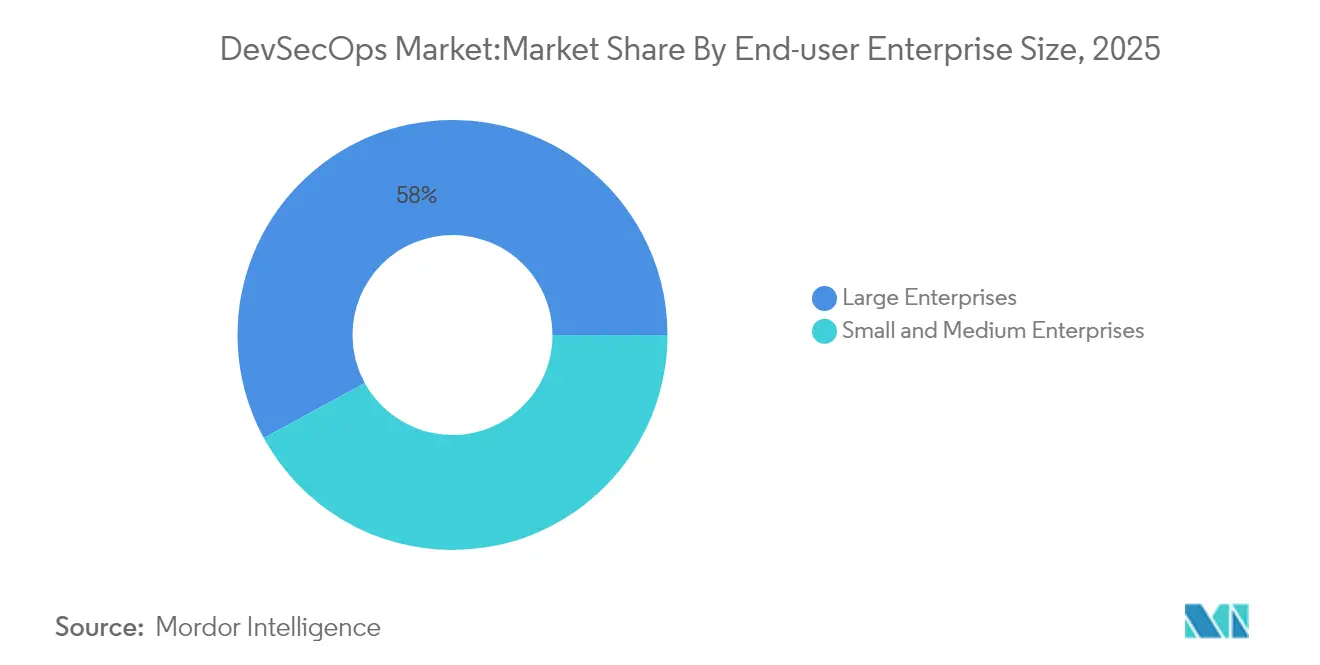
- By end-user enterprise size, Large enterprises commanded 57.95% of the DevSecOps market share in 2025, whereas the SME segment is set to grow at a 24.1% CAGR through 2031.
- By end-user industry, IT and Telecom led with 27.62% revenue share in 2025; Banking, Financial Services and Insurance (BFSI) is expected to post the fastest 25.2% CAGR to 2031.
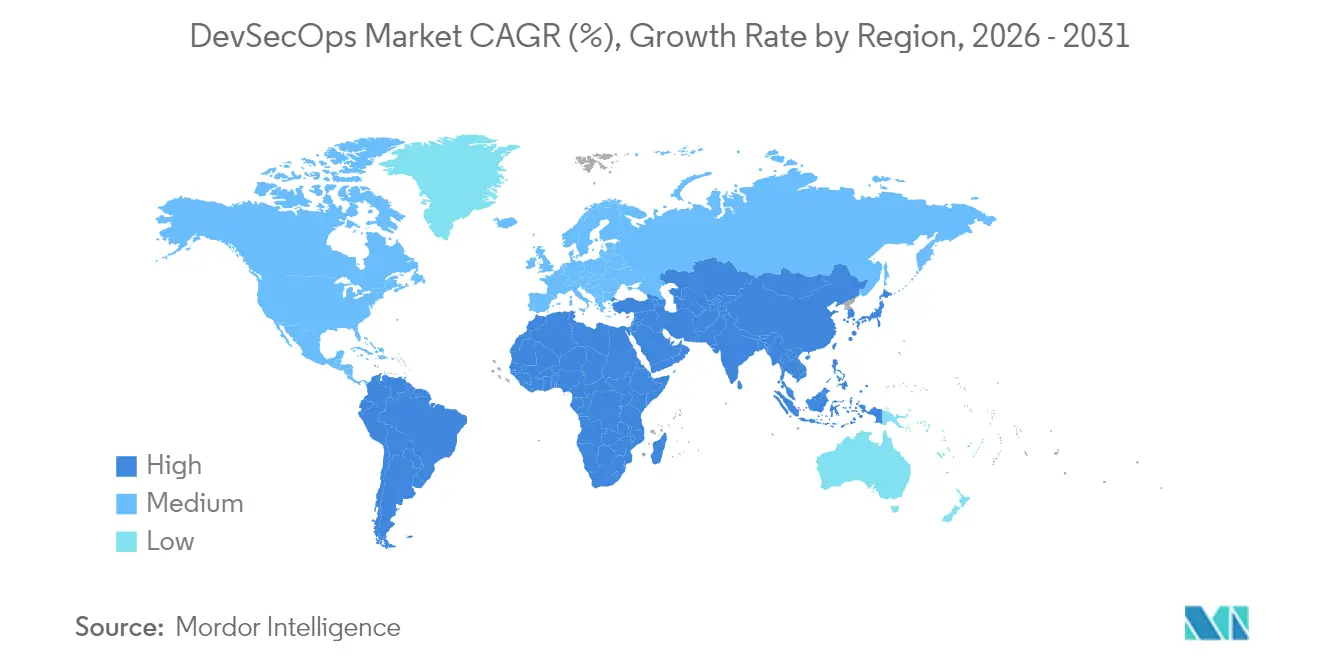
- By geography, North America accounted for 35.88% of global revenue in 2025; Asia-Pacific is the fastest-growing region with a 22.45% CAGR to 2031.
Note: Market size and forecast figures in this report are generated using Mordor Intelligence’s proprietary estimation framework, updated with the latest available data and insights as of 2026.
Global DevSecOps Market Trends and Insights
Drivers Impact Analysis*
| Driver | (~) % Impact on CAGR Forecast | Geographic Relevance | Impact Timeline |
|---|---|---|---|
| Rising focus on security and regulatory compliance | +4.2% | North America and EU | Medium term (2-4 years) |
| Need for continuous and automated application delivery | +3.8% | Global, led by North America and Asia-Pacific | Short term (≤ 2 years) |
| Shift to cloud-native and micro-service architectures | +3.5% | Global, highest adoption in Asia-Pacific | Medium term (2-4 years) |
| AI-generated code expanding attack surface | +2.9% | Tech-forward regions worldwide | Short term (≤ 2 years) |
| Mandates for Software Bills of Materials (SBOMs) | +2.1% | Primarily North America and EU | Medium term (2-4 years) |
| GenAI-powered security automation advantages | +3.0% | Early adoption in North America | Long term (≥ 4 years) |
| Source: Mordor Intelligence | |||
Rising focus on security and regulatory compliance
Executive Order 14028 obliges United States federal agencies and suppliers to produce Software Bills of Materials by February 2025, while Europe’s NIS2 directive and forthcoming Cyber Resilience Act apply similar security-by-design principles to roughly 350,000 entities across critical sectors [1]European Union Agency for Cybersecurity, “NIS2: Expanding EU-wide Cyber Resilience,” enisa.europa.eu. Organizations now treat compliance as competitive advantage rather than overhead, with continuous controls monitoring reducing audit workloads and accelerating procurement cycles. Standardized expectations across jurisdictions propel the DevSecOps market because unified platforms can map technical controls to multiple regulations simultaneously, cutting redundant tooling costs.
Need for continuous and automated application delivery
Microservices, containers, and serverless frameworks enable hundreds of daily code pushes, but manual penetration tests cannot scale to that cadence. Continuous integration / continuous delivery (CI/CD) pipelines embed real-time static, dynamic, and dependency scans that block vulnerable builds before production. Enterprises cite measurable returns when automated security gating parallels development flow, as downtime drops and feature velocity rises. AI copilots inside integrated development environments now flag insecure code during authoring, shifting remediation left and compressing release cycles.
Shift to cloud-native and micro-service architectures
Seventy-five percent of enterprises keep at least one production workload in Kubernetes clusters, moving security boundaries from static hosts to dynamic orchestration layers. Each micro-service multiplies inter-service traffic, secrets, and image registries that must be monitored without adding latency. Cloud Native Application Protection Platforms streamline posture management across workloads, scanning Infrastructure-as-Code templates and container images within the same pipeline. Security teams gain consolidated dashboards that adapt automatically when DevOps teams spin up new clusters.
AI-generated code expanding attack surface
Generative AI assistants supply large blocks of boilerplate code, but hidden defects such as prompt injections, insecure cryptography, or data-poisoning routines can slip through traditional scanners. Security operations likewise rely on AI to triage alerts and suggest fixes, creating a dual-use dynamic. Vendors now train machine-learning models on curated vulnerability datasets so they can recognize patterns specific to AI-originated code. Chief information security officers increasingly require tools that enumerate code provenance and track whether any autogenerated segment bypassed policy.
Restraints Impact Analysis*
| Restraint | (~) % Impact on CAGR Forecast | Geographic Relevance | Impact Timeline |
|---|---|---|---|
| Cultural and skills gap in secure-by-design practices | -3.1% | Global, acute in emerging markets | Medium term (2-4 years) |
| Toolchain sprawl and integration complexity | -2.4% | Global, pronounced in large enterprises | Short term (≤ 2 years) |
| Budget compression amid platform consolidation | -1.8% | Worldwide, linked to macro-economic cycles | Short term (≤ 2 years) |
| Legacy process inertia in heavily regulated sectors | -1.5% | North America and EU | Long term (≥ 4 years) |
| Source: Mordor Intelligence | |||
Cultural and skills gap in secure-by-design practices
Demand for professionals who grasp both code delivery speed and security nuance far exceeds supply. European companies report that 32% of open cybersecurity roles remain vacant even as NIS2 heightens staffing requirements. Inside many engineering teams, performance metrics still reward feature throughput rather than vulnerability closure, fostering friction between DevOps and security units. Training can triple remediation productivity, yet rolling such programs across distributed workforces requires sustained budget and leadership endorsement. SMEs feel the constraint most acutely because they compete for talent against large cloud providers.
Toolchain sprawl and integration complexity
Enterprises often maintain dozens of separate scanners, policy engines, and observability dashboards purchased piecemeal over years. Each new layer introduces additional agents, APIs, and license fees while obscuring root-cause context. Integration burdens fall heavily on security engineers who must normalize vulnerability data formats, correlate alerts, and orchestrate remediation workflows. The DevSecOps market thus tilts toward platforms that aggregate functionalities behind common metadata schemas and bidirectional connectors with issue trackers, ticketing systems, and cloud control planes. Organizations that retire redundant tools recover analyst time and lower mean time-to-resolution.
*Our updated forecasts treat driver/restraint impacts as directional, not additive. The revised impact forecasts reflect baseline growth, mix effects, and variable interactions.
Segment Analysis
By Offering: Platform solutions dominate while services accelerate
Solutions held 71.68% of 2025 revenue because buyers prefer centralized dashboards that cover code, container, and cloud posture from a single interface. These suites fold static analysis, software composition analysis, and runtime protection into identical workflows, reducing the learning curve. In contrast, services recorded a 25.4% CAGR and attract organizations lacking internal specialists. Professional service providers design governance models, integrate pipelines, and conduct red-team assessments, while managed services teams run ongoing scans and patching on behalf of clients. The DevSecOps market size for managed services is projected to climb steadily as AI features require continuous tuning. Enterprises often begin with shrink-wrapped products before seeking consulting help to optimize configuration, customize policy packs, and link ticketing systems. Once pipelines stabilize, they outsource day-to-day monitoring to service partners that guarantee response-time agreements. This sequential pattern sustains revenue for both license and service vendors, though forward-looking suppliers increasingly bundle advisory hours into software subscriptions to shorten sales cycles.


By Deployment Model: Cloud strategies outpace on-premise incumbency
On-premise held 49.95% share in 2025. Yet cloud pipelines grow at a 26.6% CAGR as chief information officers migrate monoliths into container services and serverless runtimes. Cloud-hosted security engines elastically handle burst testing during build windows and stream results back to developers in seconds. They also tap native cloud logs and identity services, simplifying policy inheritance. Hybrid deployments serve as transitional states where sensitive data remains on-premise while less regulated workloads shift to cloud. Over time, firms often consolidate either way; those leaning cloud-first expand controls across multiple availability zones, while those retaining local compute invest in private-cloud toolchains that mimic public-cloud experience. Vendors must demonstrate symmetric policy coverage across these permutations to preserve account stickiness.
By End-user Enterprise Size: SMEs democratize enterprise-grade defenses
Large enterprises, with 57.95% of 2025 revenue, were early adopters because they possessed DevOps teams, compliance budgets, and merger-driven complexity. They remain anchor clients for premium tiers that bundle AI threat modeling and advanced risk dashboards. Yet SMEs grow fastest at 24.1% CAGR thanks to pay-as-you-go SaaS models that eliminate capex. Portal-based onboarding, pre-tuned policies, and wizard-guided integrations let lean teams secure pipelines without full-time specialists. Cloud marketplaces further level the field by allowing SMEs to activate DevSecOps market services directly on existing invoices and shut them off when projects end. Vendors courting this base must automate renewal reminders, deliver prescriptive remediation playbooks, and prove value within one sprint. As SME cohorts mature, they often up-sell into higher tiers for compliance mapping or runtime protection, extending lifetime value for providers.
By End-User Industry: Financial services raise the compliance bar
IT and Telecom remained the largest buyer set in 2025 because software houses and carriers treat rapid feature delivery as existential imperative. They pioneer zero-trust architectures and exploit AI-assisted code reviews to compress cycle times. Banking, Financial Services and Insurance races ahead at a 25.2% CAGR, driven by Basel III, DORA, and SEC breach-report rules that impose stiff penalties for insecure change management . Lenders also modernize core systems onto micro-services to launch digital wallets and real-time payments, expanding attack surfaces that require embedded security. Healthcare entities invest to protect electronic health records under HIPAA and the EU General Data Protection Regulation, while public-sector buyers follow top-down mandates to attest to software supply-chain integrity. Manufacturers integrate DevSecOps into industrial edge gateways to shield operational technology, and retailers seek to prevent checkout-skimming malware that erodes trust. Cross-vertical uptake shows that secure-by-design is no longer a niche engineering practice but a broad board-level priority.
Geography Analysis
North America generated 35.88% of global revenue in 2025 and preserves leadership because federal procurement rules mandate SBOM submission for any supplier to public agencies. Technology ecosystems in Silicon Valley, Seattle, and Austin foster a dense mix of tool vendors, integrators, and open-source communities that accelerate best-practice diffusion. Canada supports adoption through its National Cyber Security Strategy, whereas Mexico’s fintech regulations drive banks toward continuous compliance to access cross-border payment corridors. Asia-Pacific registers the highest 22.45% CAGR as cloud-native startups leapfrog legacy architectures. China’s Cybersecurity Law, Japan’s Digital Agency guidelines, and India’s Computer Emergency Response Team (CERT-In) vulnerability disclosure timelines all encourage integrated security testing. Singapore’s financial authority (MAS) and Australia’s Prudential Regulation Authority tighten controls for digital banking, nudging vendors to embed encryption scanning into CI/CD. Local hyperscalers—Alibaba Cloud, Tencent Cloud, and AWS Asia Pacific Regions—partner with platform providers to pre-package DevSecOps blueprints for regional compliance regimes. Europe follows a regulation-first path. The NIS2 directive widens mandatory incident reporting across energy, transport, and healthcare, while the Digital Operational Resilience Act stipulates continuous controls testing for financial entities. Organizations therefore adopt unified security portals that align to ENISA guidance and emit machine-readable evidence for auditors. Germany, France, and the United Kingdom contribute the bulk of spending, but Eastern European software outsourcing hubs also upgrade pipelines to meet customer expectations. Elsewhere, Brazil’s LGPD privacy law and the United Arab Emirates’ National Cybersecurity Strategy catalyze spending across Latin America and the Middle East.

Competitive Landscape
Traditional network and endpoint vendors intensify platform mergers to meet buyer consolidation goals. Palo Alto Networks purchased IBM’s QRadar assets for USD 500 million and integrated them into its Prisma Cloud suite, then followed with rumored bids for supply-chain specialist Protect AI. Synopsys offloaded its Software Integrity Group for USD 2.1 billion to focus core resources on design-automation, reflecting the premium investors place on end-to-end security platforms in the Market.
Developer-first players in the market scale rapidly by embedding security into familiar workflows. GitLab posted 27% year-over-year revenue to USD 214.5 million in Q1 2026, crediting the expansion of its Ultimate tier that packages scanning, policy, and compliance audits [3]Sid Sijbrandij, “GitLab Q1 FY2026 Shareholder Letter,” about.gitlab.com. Snyk surpassed USD 300 million in annual recurring revenue following its machine-learning engine that prioritizes exploitable vulnerabilities. These successes validate a strategy of bridging developer experience with hardened security controls rather than forcing context-switches into separate portals.
Emerging specialists tackle frontier risks such as AI supply-chain poisoning, confidential computing, and runtime memory safety in Rust adoption. Their niche focus makes them attractive acquisition targets for larger suites that lack domain depth. Buyers evaluate differentiation on breadth of language coverage, false-positive suppression, and automated fix-merging. The DevSecOps market therefore balances consolidation against continuous innovation, with open-source communities feeding novel heuristics into commercial pipelines.
DevSecOps Industry Leaders
Checkmarx Ltd
Snyk Limited
Veracode, Inc.
Palo Alto Networks, Inc.
GitLab Inc.
- *Disclaimer: Major Players sorted in no particular order

Recent Industry Developments
- June 2025: Intellipaat launched an Agentic AI-enabled DevOps curriculum including advanced DevSecOps modules.
- March 2025: JFrog unveiled an end-to-end platform for building and deploying enterprise AI applications within a single DevSecOps workflow.
- January 2025: VicOne partnered with Microsoft to integrate GitHub Advanced Security into automotive software pipelines for threat-intelligent vehicle development.
- December 2024: AWS and GitLab released a combined GitLab Duo and Amazon Q offering to embed AI-powered code and security guidance directly into developer environments.


Research Methodology Framework and Report Scope
Market Definitions and Key Coverage
Our study defines the DevSecOps market as all software tools and related managed services that embed automated security checks inside continuous integration and continuous delivery pipelines across cloud and on-premise environments. According to Mordor Intelligence, coverage spans integrated platforms, standalone testing solutions, and implementation or monitoring services that enable "shift-left" security for any size development team.
Scope exclusion: pure-play traditional AppSec testing suites that are not integrated into CI/CD workflows are outside this market.
Segmentation Overview
- By Offering
- Solutions
- Services
- Professional Services
- Managed Services
- By Deployment Model
- Cloud
- On-Premise
- Hybrid
- By End-user Enterprise Size
- Small and Medium Enterprises
- Large Enterprises
- By End-User Industry
- IT and Telecom
- BFSI
- Healthcare and Life Sciences
- Government and Public Sector
- Manufacturing
- Retail and E-commerce
- Others (Energy, Education, etc.)
- By Geography
- North America
- United States
- Canada
- Mexico
- South America
- Brazil
- Argentina
- Rest of South America
- Europe
- Germany
- United Kingdom
- France
- Italy
- Spain
- Russia
- Rest of Europe
- Asia-Pacific
- China
- Japan
- India
- South Korea
- Australia and New Zealand
- Rest of Asia-Pacific
- Middle East and Africa
- Middle East
- Saudi Arabia
- United Arab Emirates
- Turkey
- Rest of Middle East
- Africa
- South Africa
- Nigeria
- Egypt
- Rest of Africa
- Middle East
- North America
Detailed Research Methodology and Data Validation
Primary Research
We interview CISOs, DevOps directors, platform architects, and leading service integrators across North America, Europe, Asia Pacific, and the Middle East. These conversations confirm adoption hurdles, average seat pricing, and regional procurement rhythms, letting us reconcile secondary datapoints and fine-tune scenario assumptions.
Desk Research
Mordor analysts start with foundational datasets from open bodies such as NIST's National Vulnerability Database, OWASP community trend logs, U.S. Bureau of Labor Statistics cyber-talent data, the Cloud Native Computing Foundation's annual DevSecOps survey, and ENISA threat landscape updates. Company filings, 10-Ks, investor decks, and respected technology press supply pricing moves and contract volumes. To validate financial signals, we also mine paid resources including Dow Jones Factiva and D&B Hoovers. The sources cited illustrate the breadth of inputs; many additional public and subscription repositories are tapped during each refresh cycle.
Market-Sizing & Forecasting
A top-down model begins with global software spend, filtered by enterprise DevOps penetration and the percent of pipelines running automated security gates. Supplier revenue roll-ups, channel checks, and sampled ASP-times-user counts serve as selective bottom-up anchors to cross-verify totals. Key variables include active DevOps engineer workforce, mean pipelines per engineer, average annual security tool spend per pipeline, frequency of critical CVE disclosures, and cloud workload share. Multivariate regression projects these drivers through 2030, while gap areas such as private tool spend are back-filled using proxy ratios from disclosed deals before the forecast is locked.
Data Validation & Update Cycle
Outputs pass variance screens against historic breach costs and vendor revenue growth. Senior analysts review anomalies, and any material deviations trigger re-contact with sources. Reports are rebuilt annually, with mid-year updates when major funding rounds, regulatory shifts, or market-moving incidents occur.
Why Mordor's Devsecops Baseline Earns Decision-Maker Confidence
Published estimates often diverge because firms apply different scopes, refresh cadences, and pricing yardsticks. Our disciplined variable selection and annual rebuild ensure a dependable reference point.
Key gap drivers include alternate publishers limiting scope to high-income regions, treating adjacent AppSec revenue as DevSecOps, or relying on single-wave vendor surveys without financial backstops.
Benchmark comparison
| Market Size | Anonymized source | Primary gap driver |
|---|---|---|
| USD 8.91 B (2025) | Mordor Intelligence | |
| USD 10.87 B (2025) | Regional Consultancy A | Narrow geographic panel and biennial updates |
| USD 10.10 B (2025) | Global Consultancy B | Includes partial DevOps tooling revenue and static pricing |
| USD 9.08 B (2025) | Trade Journal C | Vendor survey extrapolation without financial triangulation |
These comparisons show that while other analyses often over-inflate totals or miss emerging regions, Mordor's balanced mix of bottom-up checks and real-time driver monitoring delivers a transparent, repeatable baseline clients can trust for budgeting and strategy.


Key Questions Answered in the Report
What is driving the strong CAGR in the DevSecOps market?
Growing regulatory mandates, the shift to cloud-native architectures, and the need for automated security in daily software releases combine to propel a 22.10% CAGR through 2031.
Which region leads the DevSecOps market today?
North America holds 35.88% of 2025 revenue owing to early enterprise adoption and federal SBOM requirements.
Why are services the fastest-growing offering segment?
Enterprises struggle with skills gaps and integration complexity, so they increasingly hire professional and managed services to operationalize platform investments, driving a 25.4% CAGR.
How are AI coding assistants affecting DevSecOps?
They enlarge the attack surface with machine-generated code yet simultaneously supply real-time vulnerability detection, pushing organizations to adopt platforms that can evaluate AI-originated code in the pipeline.
Page last updated on:


