
DevOps Market Size and Share
Market Overview
| Study Period | 2020 - 2031 |
|---|---|
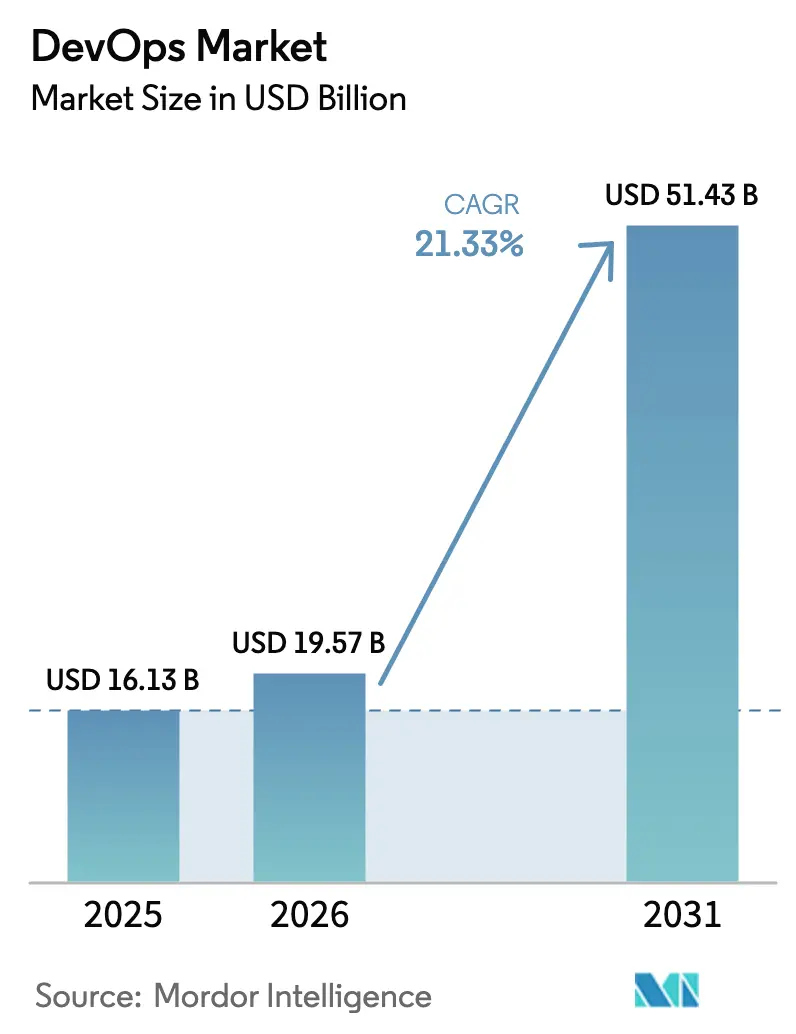
| Market Size (2026) | USD 19.57 Billion |
| Market Size (2031) | USD 51.43 Billion |
| Growth Rate (2026 - 2031) | 21.33% CAGR |
| Fastest Growing Market | Asia Pacific |
| Largest Market | North America |
| Market Concentration | Medium |
Major Players *Disclaimer: Major Players sorted in no particular order Image © Mordor Intelligence. Reuse requires attribution under CC BY 4.0. | |
DevOps Market Analysis by Mordor Intelligence
The DevOps market size is expected to grow from USD 16.13 billion in 2025 to USD 19.57 billion in 2026 and is forecast to reach USD 51.43 billion by 2031 at 21.33% CAGR over 2026-2031. Intensifying demand for shorter software delivery cycles, rising enterprise-wide automation, and the mainstreaming of artificial-intelligence-assisted workflows are accelerating adoption rates. North America leads early uptake owing to a mature cloud ecosystem, while Asia-Pacific’s rapid digitalization is shaping the fastest growth runway. Toolchains are evolving toward integrated DevSecOps platforms as security moves “left” in the development lifecycle. Hybrid-cloud strategies, skills shortages, and the pivot from monoliths to microservices are defining the competitive battleground and creating service-led growth opportunities.
Key Report Takeaways
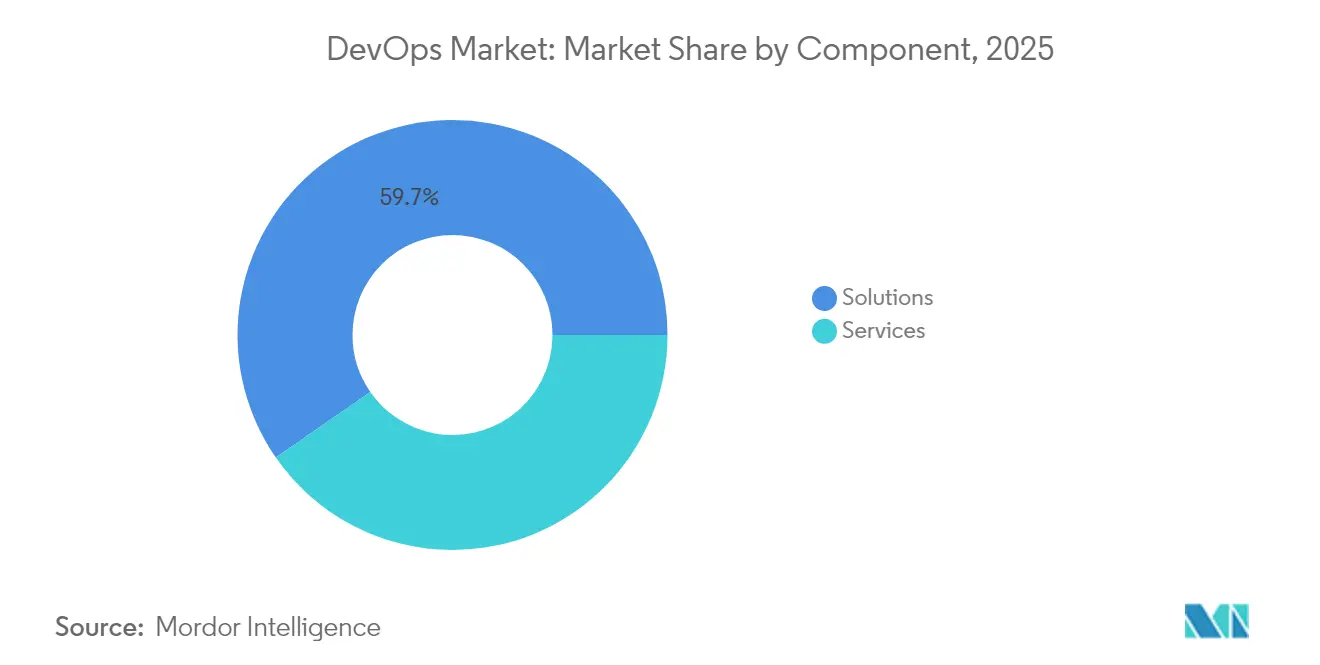
- By component, solutions held 59.65% of DevOps market share in 2025; services are projected to expand at a 23.1% CAGR to 2031.
- By deployment model, the public-cloud segment accounted for 44.70% of the DevOps market size in 2025, while the hybrid cloud is advancing at a 24.1% CAGR through 2031.
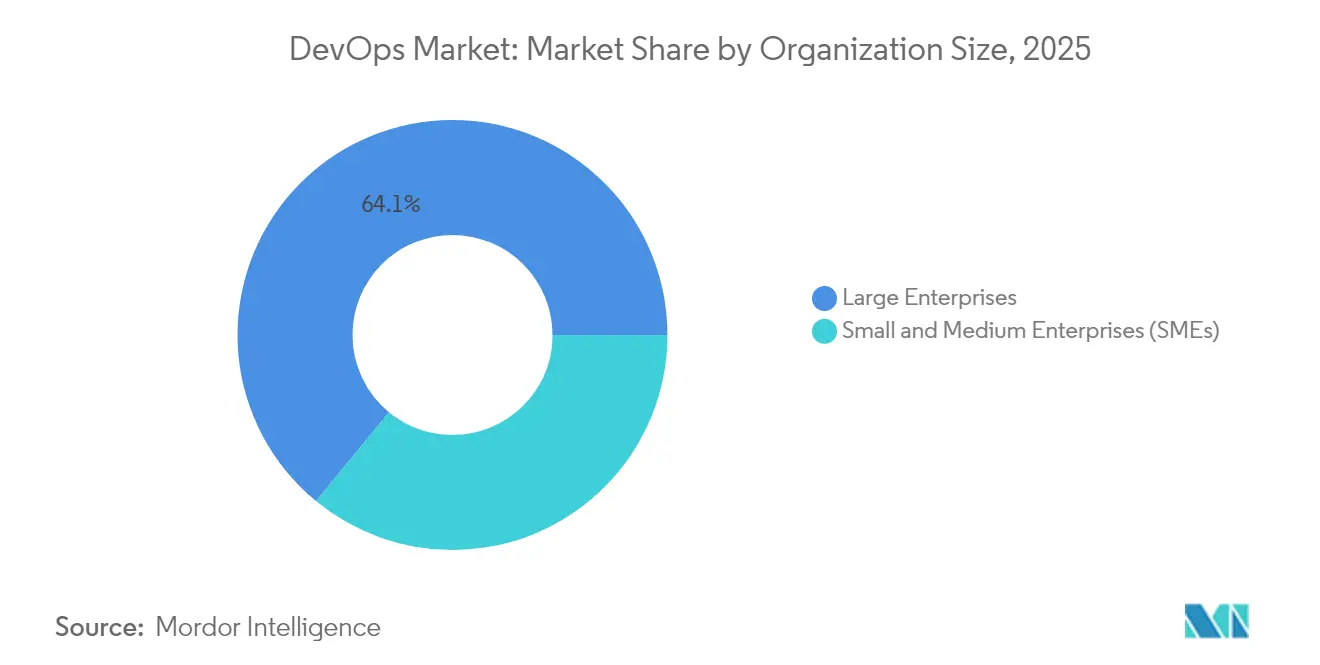
- By organization size, large enterprises led with 64.05% revenue share in 2025; SMEs post the highest expected CAGR of 21.2% between 2026-2031.
- By end-user industry, IT and telecommunications commanded 25.05% of DevOps market size in 2025, whereas healthcare and life sciences are forecast to grow at 28.1% CAGR to 2031.
- By geography, North America captured 37.85% of the DevOps market share in 2025; Asia-Pacific is set to grow at a 25.4% CAGR to 2031.
Note: Market size and forecast figures in this report are generated using Mordor Intelligence’s proprietary estimation framework, updated with the latest available data and insights as of 2026.
Global DevOps Market Trends and Insights
Drivers Impact Analysis*
| Driver | (~) % Impact on CAGR Forecast | Geographic Relevance | Impact Timeline |
|---|---|---|---|
| Need to shorten software development lifecycle | +5.2% | Global, with higher impact in North America and Europe | Medium term (2-4 years) |
| Growing enterprise adoption of automation and CI/CD | +4.8% | Global, with early adoption in North America | Short term (≤ 2 years) |
| Cloud-native and micro-services proliferation | +4.3% | Global, with concentration in North America and APAC | Medium term (2-4 years) |
| Large-scale digital-transformation and agile uptake | +3.7% | Global, with higher impact in APAC and Europe | Medium term (2-4 years) |
| AI/ML-centred predictive DevOps (AIOps) | +2.9% | North America, Europe, and advanced APAC economies | Long term (≥ 4 years) |
| Mandatory shift to DevSecOps for zero-trust compliance | +2.6% | North America, Europe, and regulated industries globally | Medium term (2-4 years) |
| Source: Mordor Intelligence | |||
Need to shorten software development lifecycle
Organizations using mature DevOps practices report a 200% rise in deployment frequency and a 50% fall in time-to-market. [1]Continuous Delivery Foundation, “State of CI/CD Report,” linuxfoundation.org Regulated sectors such as healthcare see 83% of developers engaged in DevOps to keep pace with compliance-driven release schedules. Earlier defect detection through continuous testing cuts quality-related costs by 60%. Cross-functional teams replace siloed structures to sustain faster iteration, and demand for platform tooling that simplifies governance is climbing.
Growing enterprise adoption of automation and CI/CD
Seventy percent of enterprises intend to deploy Infrastructure-as-Code by end-2025, cutting deployment failures 40%. Manufacturing firms report lower factory downtime and swifter innovation cycles, while 93% of financial institutions drive rapid service delivery with embedded security. [2]Microsoft Corp., “FY25 Second Quarter Earnings Call,” microsoft.comAutomation improves code quality 30% and trims mean-time-to-recovery 25%, shifting staff focus from repetitive tasks to innovation.
Cloud-native and micro-services proliferation
Cloud services are used by 94% of enterprises to heighten scalability. [3]IEEE Computer Society, “How DevOps and Cloud-Native Architecture Go Hand-in-Hand,” computer.org Banks anticipate that 75% will adopt hybrid strategies by 2026, allowing sensitive workloads on-premises while exploiting cloud elasticity for development. DevOps aligned with microservices supports frequent feature releases and limits systemic failure risk. Talent demand now favors engineers fluent in both cloud-platform tooling and DevOps methodologies.
Large-scale digital-transformation and agile uptake
Digital-transformation spending in BFSI stood at USD 93.04 billion in 2024 and is set to reach USD 108.51 billion in 2025. DevOps integration with agile programs yields 29% faster releases and 20% higher customer satisfaction. Industry 4.0 in manufacturing counts on Industrial DevOps for synchronized IT and OT delivery cycles. Skills-based hiring is rising as 81% of organizations widen candidate pools to secure DevOps talent.
Restraints Impact Analysis*
| Restraint | (~) % Impact on CAGR Forecast | Geographic Relevance | Impact Timeline |
|---|---|---|---|
| Legacy–to–micro-services migration complexity | -2.1% | Global, with higher impact in industries with significant legacy systems | Medium term (2-4 years) |
| Multi-cloud security and compliance risks | -1.8% | Global, with higher impact in highly regulated industries | Medium term (2-4 years) |
| Shortage of skilled DevOps engineers and cultural inertia | -2.5% | Global, with varying impact based on regional talent pools | Short term (≤ 2 years) |
| Toolchain sprawl causing observability blind-spots | -1.6% | Global, with higher impact in large enterprises | Short term (≤ 2 years) |
| Source: Mordor Intelligence | |||
Legacy-to-micro-services migration complexity
Sixty percent of firms deem DevSecOps adoption technically challenging. [4]Zscaler Inc., “Q2 FY2025 Results,” sec.gov Financial institutions face cost overruns exceeding 30% due to unforeseen integration hurdles. SMEs with limited budgets experience amplified risk, prompting vendors to offer automated refactoring and data-integrity safeguards to ease transitions.
Multi-cloud security and compliance risks
Fifty-three percent of APAC organizations encounter high-impact outages each week. Governance gaps raise vulnerability exposure as 73% of enterprises struggle with policy consistency across clouds. Zero-trust frameworks gain traction, and DevSecOps spending is projected to reach USD 41.66 billion by 2030.
*Our forecasts treat driver/restraint impacts as directional, not additive. The impact forecasts reflect baseline growth, mix effects, and variable interactions.
Segment Analysis
By Component: Solutions Lead, Services Accelerate
Solutions accounted for 59.65% of 2025 revenue, anchoring automation, integration, and collaboration workflows across the DevOps market. Source-control management and CI/CD attracted the highest deployment rates, delivering 40% higher release throughput and 25% lower error incidence. Vendors are layering AI modules that predict pipeline failures and optimize resource use, improving operational resilience.
The services segment is forecast to record a 23.1% CAGR to 2031. Enterprises rely on consulting, training, and managed offerings to bridge skills gaps and handle complex toolchains. Demand spikes for managed DevSecOps platforms that combine advisory and execution. Average US DevSecOps engineer compensation of USD 140,000 illustrates talent scarcity, channeling budget toward external providers.


By Deployment Model: Hybrid Cloud Ascendancy
Public cloud captured 44.70% of 2025 revenue, reflecting ease of access to native tool ecosystems. Mature marketplaces from AWS, Microsoft, and Google let teams onboard DevOps pipelines with reduced integration overhead. Yet regulated workloads often remain on private infrastructure.
Hybrid-cloud adoption will post a 24.1% CAGR through 2031, creating the largest incremental opportunity for the DevOps market. Financial services institutions anticipate 75% hybrid utilization by 2026, balancing sovereignty with scalability. Organizations deploy unified policy engines and observability layers to preserve a consistent experience across on-premises and cloud assets.
By Organization Size: Enterprise Dominance, SME Momentum
Large enterprises generated 64.05% of 2025 sales, supported by cross-business mandates and capital for end-to-end platform rollouts. DevOps centers of excellence embed standardized practices, governance, and talent pipelines. This scale lowers per-unit tooling costs and accelerates innovation.
SMEs will expand at a 21.2% CAGR, narrowing capability gaps with larger peers. Cloud-based starter kits reduce upfront investment, and pay-as-you-grow pricing aligns with constrained budgets. Successful SME pilots report 200% deployment-frequency gains and 50% faster time-to-market, driving peer adoption. Methodologies tailored for SME constraints, such as lean DevOps frameworks, are gaining traction.
By End-User Industry: Healthcare Acceleration
IT & telecom firms held 25.05% of 2025 revenue as early adopters and creators of core DevOps tooling. Telecommunications operators lean on pipeline automation to roll out network functions and customer-facing apps reliably.
Healthcare and life sciences will be the fastest segment at 28.1% CAGR to 2031, propelled by telehealth growth, AI diagnostics, and stringent uptime needs. Continuous deployment enables rapid clinical software updates while sustaining compliance. Emerging use cases such as connected medical devices demand stable, repeatable deployment models.
Geography Analysis
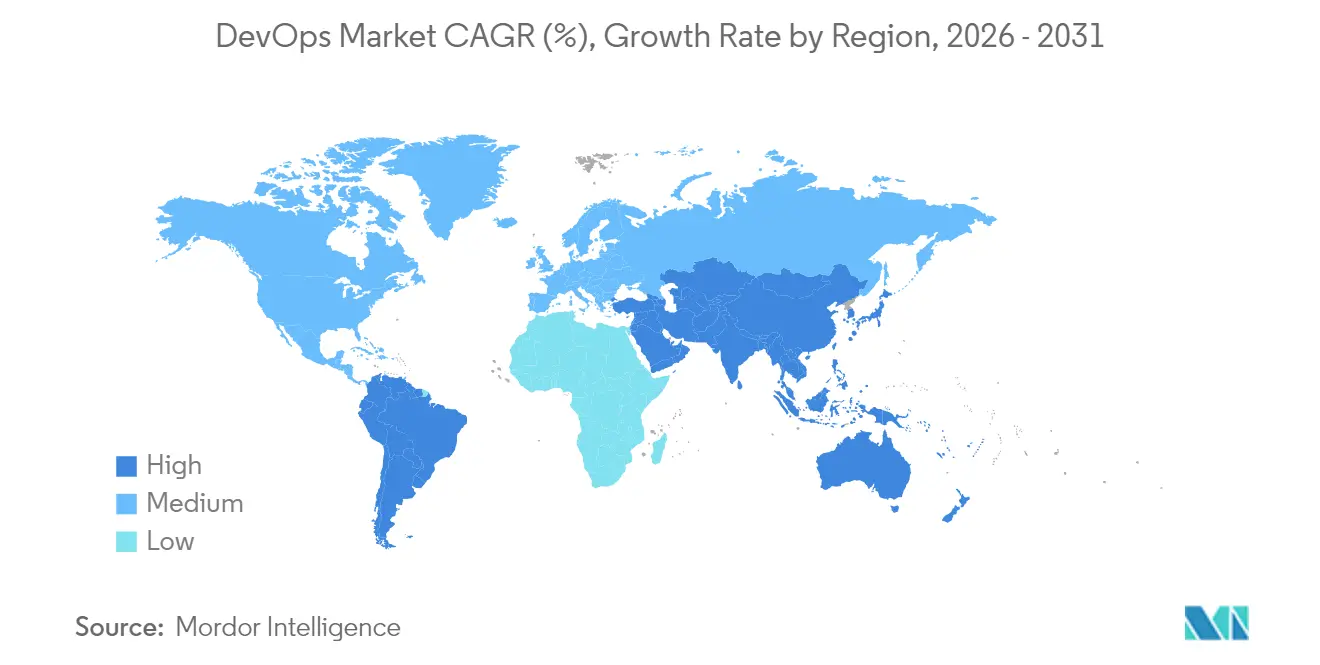
North America contributed 37.85% of 2025 revenue. A dense concentration of hyperscale cloud providers, venture-backed software vendors, and early adopter enterprises underpins regional leadership. The IT sector produced 39% of regional DevOps market revenue in 2024, and AI-enabled tool launches maintain the innovation cycle.
Asia-Pacific will post the highest regional CAGR of 25.4% through 2031. India, China, and ASEAN economies accelerate cloud spending to support digital objectives. In India, 65% of organizations report high-impact outages, raising urgency for resilient DevOps practices. South Korea records the highest outage cost bracket, exceeding USD 1 million per hour for 92% of firms, reinforcing adoption impetus.
Europe is scaling rapidly under tightening regulations. Germany is projected to log USD 1.13 billion in cloud-based DevOps tools revenue by 2031. GDPR drives DevSecOps implementation for data-protection alignment. Consolidation is visible; Eficode’s acquisition of Solidify strengthens GitHub services across the region, mirroring a trend toward specialist consultancies.

Regulatory Landscape
DevOps adoption is increasingly shaped by secure software and operational-resilience requirements that push governance into CI/CD workflows. In the United States, NIST guidance such as SP 800-218 (Secure Software Development Framework) and NIST NCCoE DevSecOps practices formalize controls that translate into automated testing, code signing, SBOM generation, and auditable pipeline evidence, particularly for government and regulated buyers. Federal acquisition requirements also tightened as OMB Memorandum M-26-05 took effect on January 23, 2026, reinforcing supplier attestations and software supply chain transparency expectations.
In Europe, DevOps toolchains and service delivery models are being aligned to cyber resilience and liability regimes. The EU Digital Operational Resilience Act (DORA) raises expectations for documented ICT risk management, incident readiness, and third-party oversight for financial entities and key ICT providers, accelerating embedded compliance reporting within DevSecOps platforms. In parallel, the Cyber Resilience Act and updates to product liability rules increase attention on secure-by-design processes for software-enabled products, pushing organizations to standardize vulnerability management, dependency control, and release governance across hybrid and multi-cloud environments.
Value Chain Analysis
The DevOps value chain spans cloud and runtime infrastructure providers, developer platforms and tool vendors (SCM, CI/CD, IaC, testing, artifact management, observability), security and compliance layers (SAST/DAST, secrets, SBOM and provenance, policy-as-code), and services (consulting, integration, managed DevSecOps). Hyperscalers such as AWS, Microsoft, and Google increasingly anchor reference architectures and marketplaces, while integrated platforms consolidate toolchain functions to reduce sprawl and improve auditability. In 2026, software supply chain security requirements emphasize end-to-end chain of custody from development to production, with SBOMs, attestations, and provenance becoming common procurement checkpoints.
Downstream, enterprises operationalize DevOps through platform engineering teams and internal developer platforms that standardize pipelines, golden paths, and governance across business units. Sector workflows shape implementation patterns, for example, telecom operators industrializing infrastructure management through Infrastructure as Code and Git-based operating models, and media organizations integrating AI-led content pipelines with observability and asset management. Channel partners and systems integrators also figure in legacy modernization and hybrid deployments by packaging tooling, policy, and managed operations into outcome-oriented engagements.
Competitive Landscape
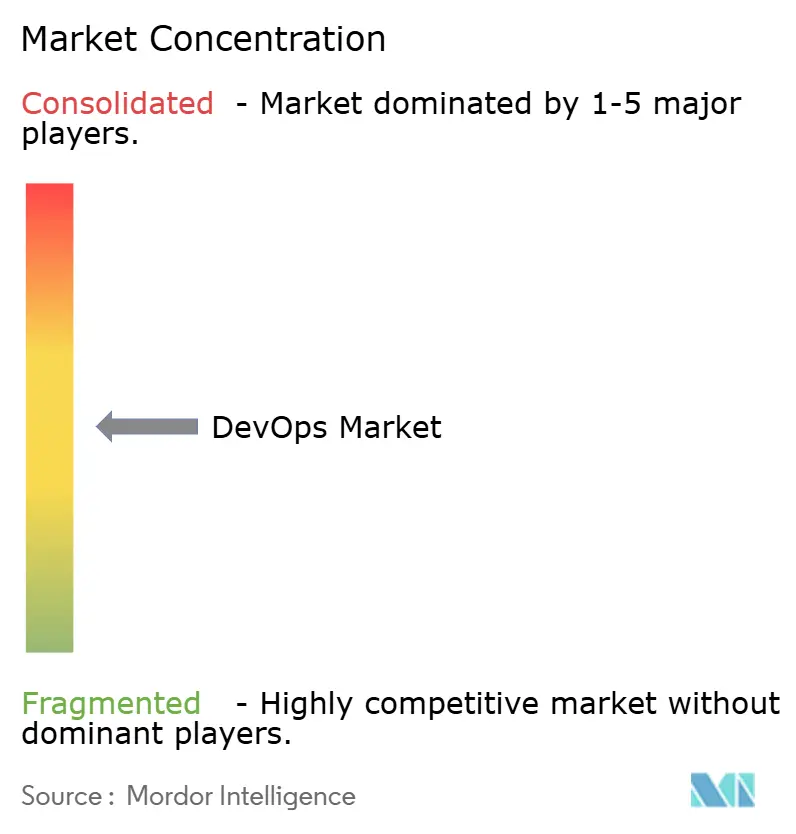
The DevOps market shows moderate concentration as cloud hyperscalers, integrated-platform specialists, and niche innovators vie for share. AWS, Microsoft, and Google bundle infrastructure with pipeline tooling, lowering entry friction and locking in workloads. GitLab’s integrated DevSecOps platform recorded USD 759.2 million revenue in FY 2025, up 31% year over year.
Consolidation is intensifying. Eficode’s Solidify takeover broadens GitHub consulting depth and AI capabilities. Strategic alliances, such as JFrog’s partnership with Hugging Face, embed ML model management within secure pipelines and broaden platform stickiness. Vendors differentiate by automating security scans, dependency checks, and policy enforcement to meet zero-trust mandates.
White-space opportunities include AI-driven observability, verticalized solutions for regulated industries, and simplified packages for SMEs. Providers able to fuse low-code, security, and compliance in an integrated experience are poised to capture incremental DevOps market demand.
DevOps Industry Leaders
Google LLC
Microsoft Corporation
IBM Corporation
Oracle Corporation
Amazon Web Services, Inc.
- *Disclaimer: Major Players sorted in no particular order

Market Opportunities and Future Outlook
Regulated and security-sensitive deployments create whitespace for DevSecOps platforms and services that automate evidence, attestations, and control enforcement across toolchains. In the US public sector procurement context, OMB Memorandum M-26-05 (effective January 23, 2026) elevates SBOM and supplier assurance practices, increasing demand for automated software compliance capabilities that fit CI/CD. NIST NCCoE DevSecOps practices and NIST SSDF alignment also encourage repeatable pipeline patterns, benefiting vendors and service providers that can deliver pre-mapped controls, auditable logging, and standardized policy-as-code across hybrid environments.
Agentic AI and platform engineering are emerging as buyer priorities, creating opportunities for integrated offerings that combine model governance, secure build and release automation, and developer experience in one operating model. GitLab expanded collaborations with AWS (April 2026) and Google Cloud (June 2026) to connect its Duo Agent Platform with services such as Amazon Bedrock and Google Cloud AI models, signaling a shift toward AI-assisted software delivery within existing cloud commitments. Services-led modernization also remains a key opportunity as enterprises consolidate fragmented toolchains and refactor legacy systems, exemplified by the February 2026 TCS and GitLab partnership focused on AI-powered orchestration and DevSecOps at scale. Large vendor investments in open source and supply chain security, including IBM and Red Hat committing USD 5 billion in May 2026, reinforce demand for secure, governed delivery pipelines and managed operational support.
Recent Industry Developments
- July 2026: Microsoft launched Microsoft Frontier Company, a $2.5 billion unit deploying 6,000 specialists to assist enterprise customers with AI system deployment. The move accelerates AI enabled enterprise deployment. It embeds specialized capabilities into enterprise operations, altering DevOps enabled AI rollout dynamics.
- July 2026: Amazon Web Services expanded AWS DevOps Agent with AI powered release readiness and autonomous release testing capabilities. The upgrade strengthens AWS in AI integrated DevOps, enabling autonomous testing workflows. This expansion strengthens AWS leadership in AI integrated DevOps and shifts user adoption toward AWS backed agentic workflows.
- July 2026: Microsoft and 3M announced partnership to deploy 3M Expanded Beam Optical technology in Microsoft AI data centers. The arrangement boosts optical networking throughput for AI workloads. It improves infrastructure efficiency and AI deployment scale, reinforcing Microsoft's data center capabilities.


Research Methodology Framework and Report Scope
Market Definition and Coverage
This market covers spending on DevOps tools and related services that help teams plan, build, test, release, monitor, and improve software faster and more reliably across cloud and on-prem environments.
Scope exclusions: It excludes general IT outsourcing and broad infrastructure spend that is not directly tied to DevOps toolchains or DevOps-specific professional services.
Segmentation Overview
- By Component
- Solutions
- Services
- By Deployment Model
- Public Cloud
- Private Cloud
- Hybrid Cloud
- On-Premises
- By Organization Size
- Small and Medium Enterprises (SMEs)
- Large Enterprises
- By End-User Industry
- BFSI
- Retail and eCommerce
- Government and Public Sector
- Manufacturing
- IT and Telecommunications
- Healthcare and Life Sciences
- Media and Entertainment
- Other End-user Industries
- By Geography
- North America
- United States
- Canada
- Mexico
- Europe
- Germany
- United Kingdom
- France
- Italy
- Spain
- Russia
- Rest of Europe
- Asia-Pacific
- China
- India
- Japan
- South Korea
- ASEAN
- Australia and New Zealand
- Rest of Asia-Pacific
- South America
- Brazil
- Argentina
- Rest of South America
- Middle East and Africa
- Middle East
- Saudi Arabia
- United Arab Emirates
- Turkey
- Rest of Middle East
- Africa
- South Africa
- Nigeria
- Rest of Africa
- Middle East
- North America
Data Sources, Market Sizing, and Validation
Desk Research
Desk research is used to build the basic demand story and set guardrails for what can be reasonably counted as DevOps spend. We rely on public sources such as the US Bureau of Labor Statistics for software and IT employment context, OECD digital economy indicators, and World Bank macro and enterprise digitization data to estimate investment capacity by region.
We also review standards and security guidance that affect DevOps process requirements, along with public cloud and software adoption signals published by bodies such as NIST and ENISA. Additional inputs come from company filings, earnings transcripts, investor presentations, credible press interviews, and product documentation that describes typical DevOps workflows and buying patterns. Where needed, paid subscriptions are used for company financials and intelligence, plus patent databases to track activity in pipeline automation and software delivery. This list is not exhaustive, and many other public sources were reviewed to collect data, validate assumptions, and clarify open questions.
Primary Interviews and Surveys
Primary work is used to confirm what buyers actually bundle under DevOps spending, how tool and service mixes change across cloud and hybrid delivery, and how budgets shift by industry and organization size. We spoke with a mix of toolchain users, implementation partners, and subject matter experts across major regions, so gaps from desk research could be closed and assumptions could be checked before finalizing the model.
Distribution of primary research fieldwork respondents
| Company type | Respondent position | Region |
|---|---|---|
| Top tier: 30% | CXOs: 18% | APAC: 41% |
| Mid tier: 48% | Functional/Unit leaders: 26% | EMEA: 37% |
| Smaller Players: 22% | Managers: 56% | Americas: 22% |
Market-Sizing & Forecasting
Sizing starts with a top-down build where IT and software delivery spending pools are reconstructed by region, and then filtered using DevOps adoption and usage intensity assumptions that were validated through interviews. To keep the totals grounded, we corroborate the result using selective bottom-up checks, such as sampled average contract values for DevOps platforms, services attach rates, and volume proxies like active development team counts.
A few key inputs that shape the model include the pace of cloud migration and hybrid use, release frequency and automation maturity (CI/CD penetration), DevSecOps shift-left adoption, the share of managed services in DevOps programs, and regional enterprise digitization investment cycles. When inputs are missing for smaller countries, we use proxy indicators such as ICT spend per employee and software workforce density, and then normalize results against regional peer groups.
For forecasting, we mainly use scenario analysis supported by multivariate regression on demand drivers like cloud workload growth, security and compliance intensity, and developer hiring trends, and then refine the slope based on what practitioners expect in budgets and tool consolidation over the next cycle.
Data Validation & Update Cycle
Outputs are cross-checked against independent signals, including published digital investment trends, workforce indicators, and the implied spend per development team that comes out of the model. Large jumps, unusual regional shares, or sudden pricing effects are flagged and reviewed, and follow-up outreach is triggered when a variance cannot be explained with available evidence.
Before sign-off, assumptions and calculations go through a multi-step analyst review so the logic remains consistent across countries, segments, and time periods. Reports are refreshed annually, and interim updates are made when material events shift demand or pricing in a meaningful way. Right before delivery, a fresh pass is completed so clients receive the latest view that matches the newest data releases.
Mordor Intelligence's Devops Market Sizing Compared With Other Published Estimates
Published DevOps market values can vary even when the growth story sounds similar, because each study draws the line differently around what counts as DevOps spending and which years are treated as the base. Differences also come from how pricing changes are handled, how services are bundled, and whether results are checked against real-world adoption signals.
By tracking pipeline automation maturity, cloud and hybrid deployment mix, and annual pricing resets, Mordor Intelligence keeps the DevOps estimate tied to toolchain and DevOps-specific service spend, rather than folding in broader IT operations programs.
Benchmark comparison
| Source | Market Size | Gaps in Research Methodology |
|---|---|---|
| Mordor Intelligence | USD 19.57 B (2026) | |
| Global Consultancy A | USD 35.42 B (2026) | Often expands scope to include broader IT operations automation and platform engineering budgets, and may apply aggressive services bundling without consistent checks against DevOps toolchain usage intensity. |
| Industry Research Note B | USD 25.50 B (2028) | Uses a later base and shorter horizon, and can rely on vendor-reported growth rates that do not fully adjust for pricing normalization, tool consolidation, and regional adoption differences. |
The table shows that the spread mostly comes from scope boundaries and how services are treated, followed by timing differences in the stated year. Our approach stays repeatable because the model is built from clear demand drivers and then pressure-tested with practical bottom-up checks, which helps avoid overcounting adjacent IT spend.


Key Questions Answered in the Report
What is the current value of the DevOps market and its growth outlook?
The DevOps market stands at USD 19.57 billion in 2026 and is projected to reach USD 51.43 billion by 2031, reflecting a 21.33% CAGR.
Which region is growing the fastest in DevOps adoption?
Asia-Pacific is forecast to grow at a 25.4% CAGR through 2031, supported by large-scale digital-transformation projects and expanding cloud investments.
Why is hybrid cloud important to DevOps strategies?
Hybrid cloud blends public-cloud scalability with private-infrastructure control, supporting consistent DevOps practices while meeting data-sovereignty and regulatory requirements.
What challenges do organizations face when migrating from legacy systems to micro-services?
Key hurdles include integration complexity, budget overruns, and compliance constraints, with 60% of firms labeling DevSecOps implementation technically difficult.
How are security concerns influencing DevOps tool selection?
The shift toward DevSecOps embeds automated vulnerability scanning and zero-trust principles directly into pipelines, driving demand for unified platforms that address security and compliance by design.
Which industry vertical is expected to adopt DevOps the fastest?
Healthcare and life sciences are projected to record a 28.1% CAGR to 2031 as telehealth, AI diagnostics, and data analytics heighten the need for agile, reliable software delivery.
Page last updated on:






