
Desalting And Buffer Exchange Market Size and Share
Market Overview
| Study Period | 2020 - 2031 |
|---|---|
| Market Size (2026) | USD 1.49 Billion |
| Market Size (2031) | USD 2.41 Billion |
| Growth Rate (2026 - 2031) | 10.12 % |
| Fastest Growing Market | Asia-Pacific |
| Largest Market | North America |
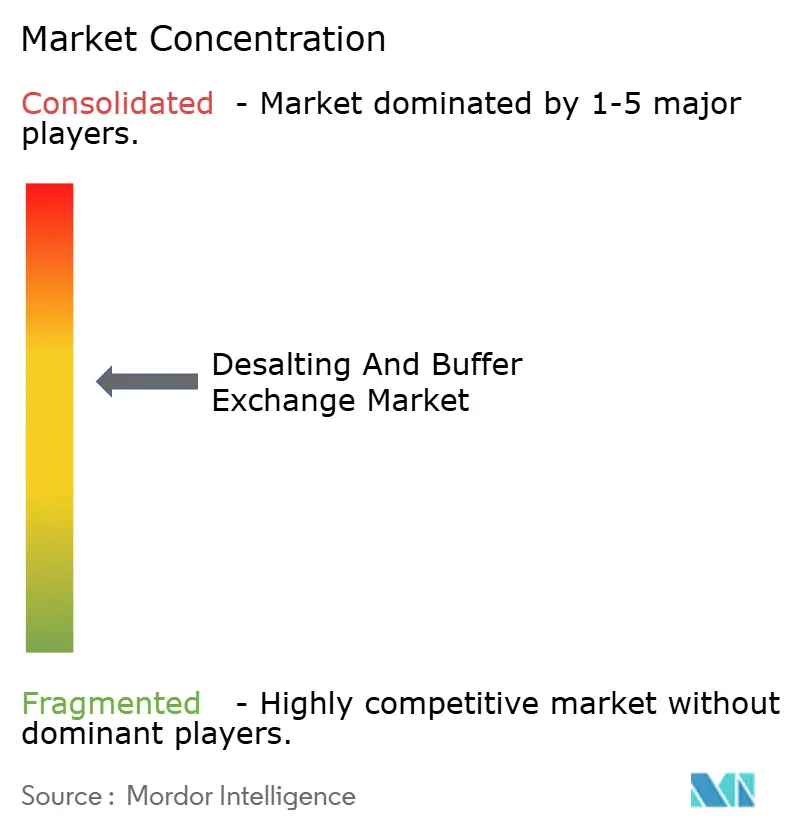
| Market Concentration | Medium |
Major Players *Disclaimer: Major Players sorted in no particular order Image © Mordor Intelligence. Reuse requires attribution under CC BY 4.0. | |
Desalting And Buffer Exchange Market Analysis by Mordor Intelligence
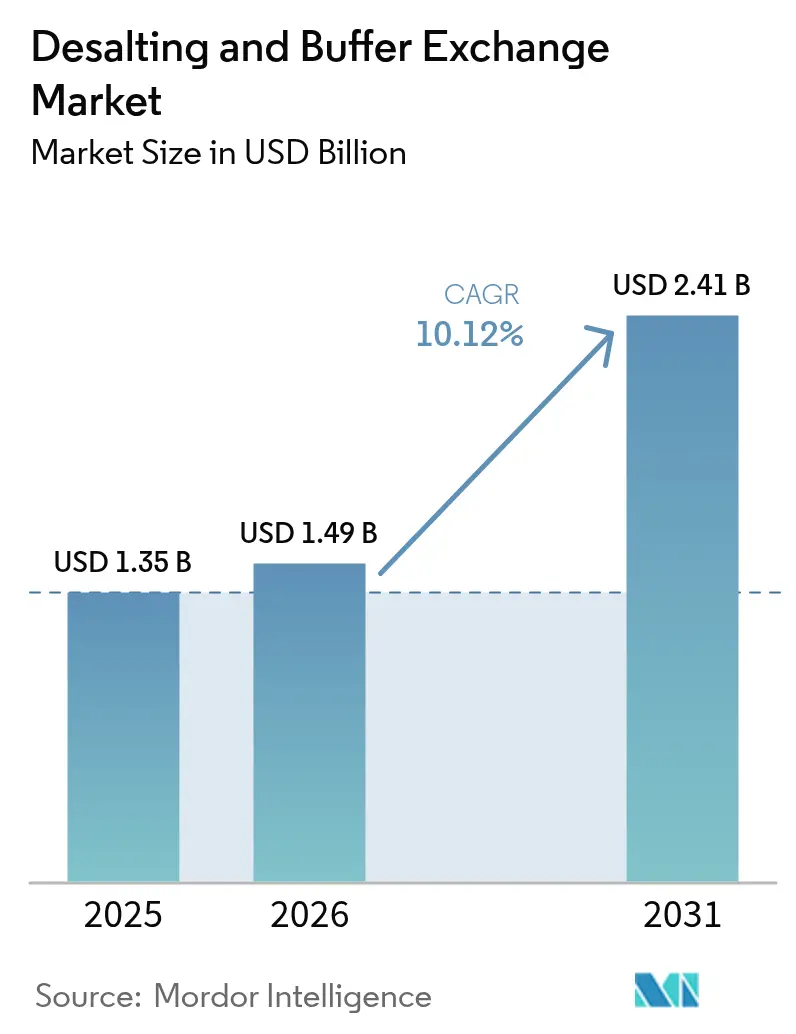
The desalting and buffer exchange market size was valued at USD 1.35 billion in 2025 and estimated to grow from USD 1.49 billion in 2026 to reach USD 2.41 billion by 2031, at a CAGR of 10.12% during the forecast period (2026-2031). Demand momentum is shaped by the rapid scale-up of global biologics production, heightened vaccine manufacturing capacity, and tightening regulatory expectations for downstream purity. Contract development and manufacturing organizations (CDMOs) channel substantial capital toward large-scale facilities, which expands the installed base for purification equipment and lifts recurring consumables sales. Spin columns remain the workhorse of research laboratories, yet centrifugal filter devices and single-use membranes see accelerating uptake as facilities seek higher throughput and reduced validation burden. Geographically, North America retains a technology leadership position, but sustained green-field expansion and policy support in Asia-Pacific give that region the steepest growth runway. Competitive dynamics favor suppliers able to bundle hardware, consumables, and analytics into integrated platforms that shorten tech-transfer timelines and improve regulatory compliance.
Key Report Takeaways
- By product, spin columns held 37.62% of the Desalting And Buffer Exchange market share in 2025, while centrifugal filter devices are forecast to advance at a 12.18% CAGR through 2031.
- By technique, chromatography captured 43.75% revenue share in 2025; filtration methods are expanding at a 12.41% CAGR to 2031.
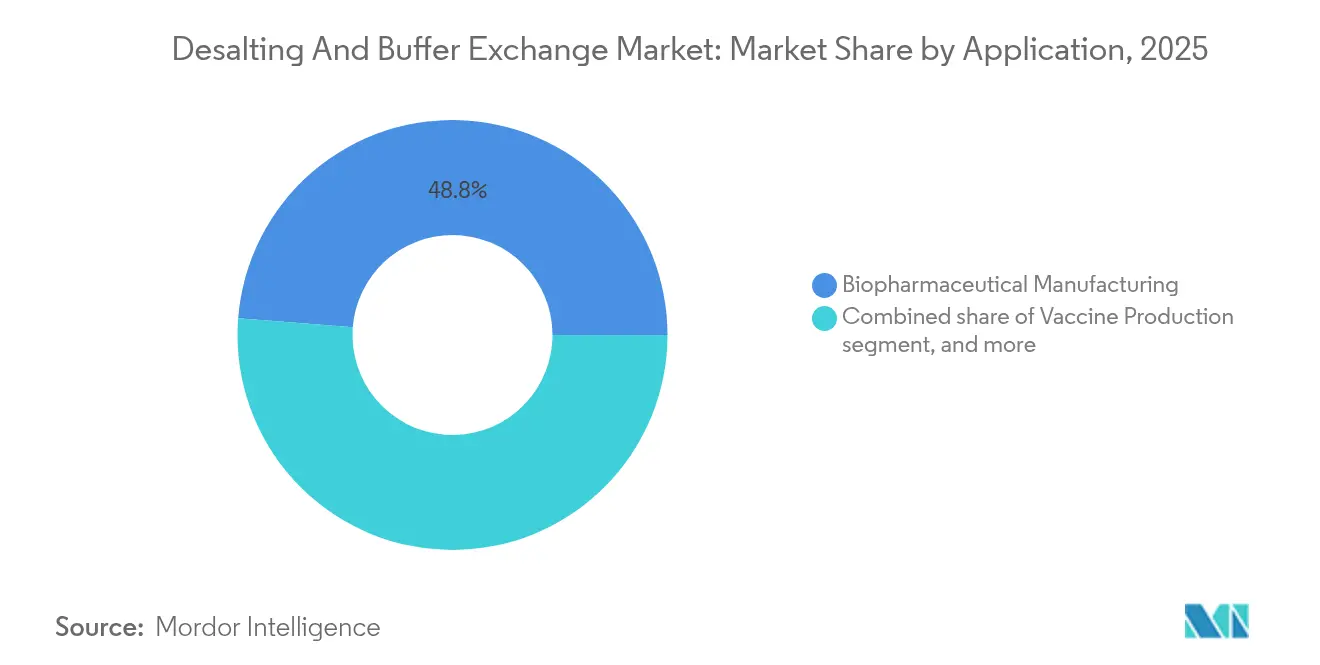
- By application, biopharmaceutical manufacturing accounted for 48.76% of the Desalting And Buffer Exchange market size in 2025, whereas vaccine production is projected to grow at a 13.47% CAGR through 2031.
- By scale, laboratory-level operations commanded 57.84% share in 2025, yet commercial manufacturing scale is rising at a 13.29% CAGR over the outlook period.
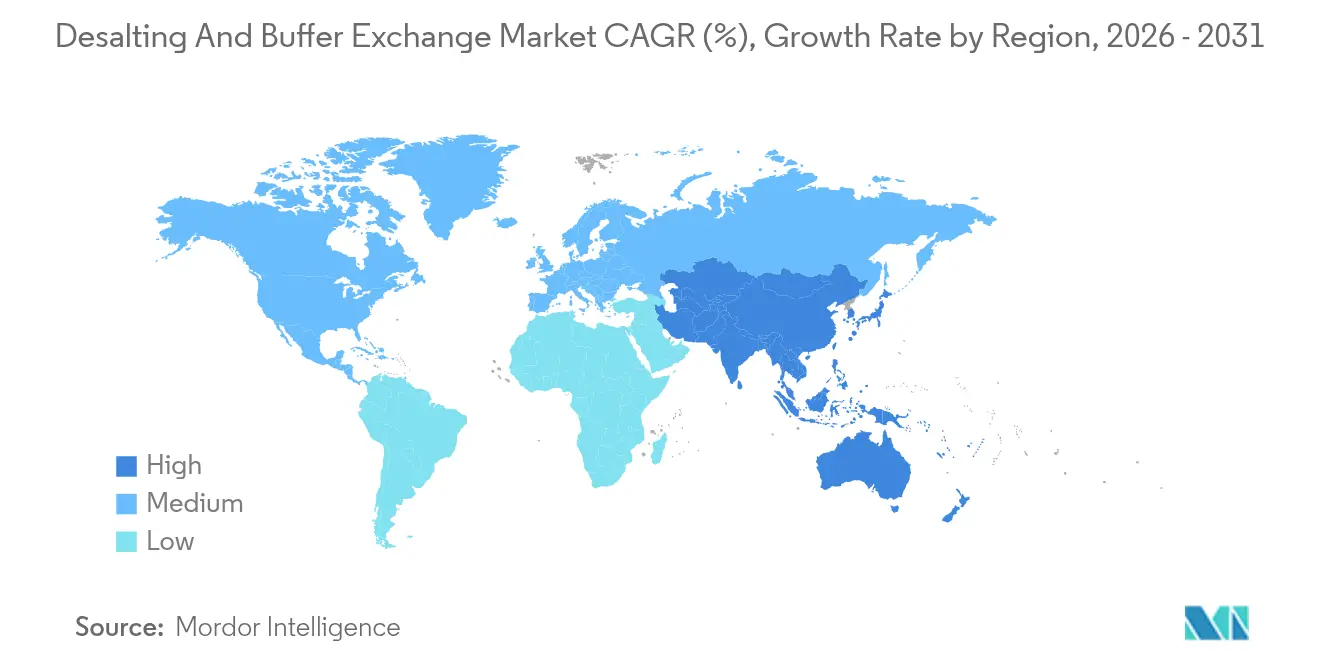
- By geography, North America led with 41.88% share in 2025, and Asia-Pacific registers the highest regional CAGR of 11.22% through 2031.
Note: Market size and forecast figures in this report are generated using Mordor Intelligence’s proprietary estimation framework, updated with the latest available data and insights as of 2026.
Market Trends and Insights
Drivers Impact Analysis of Desalting And Buffer Exchange Market*
| Driver | % Impact on CAGR Forecast | Geographic Relevance | Impact Timeline |
|---|---|---|---|
| Expansion of global biologics manufacturing capacity | +2.8% | North America, Europe, Asia-Pacific | Medium term (2-4 years) |
| Increasing investments in genomic and proteomic research | +2.1% | North America, Europe, Asia-Pacific | Long term (≥ 4 years) |
| Technological advancements in downstream purification platforms | +1.9% | Global | Medium term (2-4 years) |
| Growth of contract development and manufacturing organizations (CDMOs) | +2.3% | Global with Asia-Pacific surge | Short term (≤ 2 years) |
| Shift toward continuous bioprocessing and automation | +1.7% | North America and Europe | Long term (≥ 4 years) |
| Rising demand for high-throughput diagnostic sample preparation | +1.4% | Global with Asia-Pacific focus | Medium term (2-4 years) |
| Source: Mordor Intelligence | |||
Expansion of Global Biologics Manufacturing Capacity
Large-scale capacity announcements continue to reshape procurement patterns across the desalting and buffer exchange market. Samsung Biologics secured USD 3.3 billion worth of contracts in 2024, while Lonza purchased Roche’s Vacaville plant, adding 330,000 liters of bioreactor capacity to the global network[1]Staff Reporter, “Samsung Biologics lands record contract,” Fierce Pharma, fiercepharma.com. Every incremental bioreactor demands proportional downstream infrastructure, including desalting columns, filter cartridges, and buffer preparation modules. CDMOs such as Fujifilm Diosynth have earmarked more than USD 8 billion for site expansions that come online mid-2025, signaling a multi-year uplift in consumables demand. The economic stakes are significant because purification yields directly influence cost of goods. Consequently, biomanufacturers gravitate toward high-throughput devices that minimize hold times, reduce buffer consumption, and elevate batch consistency.
Increasing Investments in Genomic and Proteomic Research
Next-generation sequencing growth drives stringent requirements for ultra-pure nucleic acid and protein samples. Academic consortia and pharmaceutical discovery units invest in desalting kits that can process hundreds of micro-scale samples in parallel without cross-contamination[2]Editorial Team, “Continuous chromatography gains ground,” BioProcess International, bioprocessintl.com. China and India push toward good manufacturing practice (GMP) compliance, broadening the global footprint of advanced analytical laboratories. Artificial intelligence-enabled assay development further tightens buffer specifications, pressing operators to deploy automated buffer exchange systems that assure reproducibility over extended runs. The resulting rise in throughput requirements reinforces demand for scalable platforms that can migrate from discovery to pilot production with minimal protocol changes.
Technological Advancements In Downstream Purification Platforms
Continuous chromatography, single-pass tangential-flow filtration, and 3D-printed single-use chambers exemplify the technology leap underway in downstream operations. Modern multimodal resins show greater salt tolerance, which reduces the number of buffer exchange steps and shortens cycle time. Real-time sensors now track conductivity and product concentration, enabling feedback control that drives higher yields. Single-use assemblies cut cleaning validation and support multi-product flexibility, though they exacerbate waste-management challenges. Suppliers differentiate through resin chemistries that resist fouling and membranes that sustain high flux under continuous conditions, improving cost-per-gram metrics for high-volume biologics.
Growth Of Contract Development and Manufacturing Organizations (CDMOs)
The CPHI Annual Report anticipates CMOs and hybrids will control 54% of worldwide biologics capacity by 2028, magnifying the gate-keeping role of large-scale outsourcing partners. CDMOs standardize equipment across networks to leverage global validation packages and to negotiate bulk pricing on consumables. Flexible skid-mounted systems allow rapid line reconfiguration between antibodies, cell therapies, and nucleic acid vaccines. Smaller biotech firms, under capital pressure, rely on CDMOs’ turnkey downstream suites to compress development timelines, which reinforces demand for validated purification kits and ready-to-run columns.
Restraints Impact Analysis of Desalting And Buffer Exchange Market*
| Restraints Impact Analysis | (~) % Impact on CAGR Forecast | Geographic Relevance | Impact Timeline |
|---|---|---|---|
| Shortage of skilled downstream processing workforce | -1.8% | North America and Europe | Short term (≤ 2 years) |
| High capital and operating costs of advanced filtration systems | -2.1% | Emerging markets most affected | Medium term (2-4 years) |
| Sustainability and waste-disposal concerns for single-use consumables | -1.3% | Europe and North America | Long term (≥ 4 years) |
| Supply-chain vulnerabilities for specialty membranes and resins | -1.6% | Asia-Pacific sourcing hubs | Short term (≤ 2 years) |
| Source: Mordor Intelligence | |||
Shortage of Skilled Downstream Processing Workforce
Industry surveys underline a widening talent gap in membrane science, process analytics, and automation. Leading clusters such as Boston and Basel attract the limited pool of experienced engineers, leaving newer hubs short-staffed. Project delays and rising labor costs add friction to technology adoption in the desalting and buffer exchange market. Training programs struggle to keep curricula current with rapid equipment upgrades. To mitigate risk, facilities invest in highly automated platforms that reduce operator dependency, yet such systems command higher upfront capital.
Supply Chain Vulnerabilities for Specialty Membranes and Resins
Fluoropolymer films and high-capacity ion-exchange resins originate from a limited set of specialty chemical suppliers concentrated in Asia. Pandemic-era logistics disruptions spotlighted lead-time risk, prompting Western buyers to stockpile inventory[3]Policy Brief, “Supply-chain re-alignment post-Biosecure Act,” Carnegie Endowment, carnegieendowment.org. The US Biosecure Act discourages sourcing from certain Chinese entities, redirecting orders to alternate suppliers in Korea and India. Although diversification improves resilience, interim shortages elevate costs and extend qualification timelines.
*Our forecasts treat driver/restraint impacts as directional, not additive. The impact forecasts reflect baseline growth, mix effects, and variable interactions.
Desalting And Buffer Exchange Market Segment Analysis
By Product:
Spin Columns Lead Traditional ApplicationsIn 2025 spin columns contributed 37.62% to the desalting and buffer exchange market share, underscoring their entrenched value in routine lab protocols. Researchers prize the plug-and-play format, rapid processing times, and compatibility with a range of biomolecule sizes. The segment continues to innovate through higher-capacity resins and low-binding plastics that improve recovery rates. Conversely, centrifugal filter devices headline the growth narrative with a 12.18% CAGR through 2031, benefiting from escalating high-volume screening and micro-bioreactor usage. Suppliers such as Sartorius enhance membrane geometry to maintain flux at lower centrifugal forces, which protects fragile biologics.
The desalting and buffer exchange market size allocation for spin columns is expected to contract slightly in relative terms as labs migrate to higher-throughput cartridge and plate formats. Dialysis cassettes hold niche appeal where ultra-gentle conditions safeguard conformational integrity of complex proteins. Filter plates penetrate combinatorial chemistry and antibody engineering workflows that demand parallel processing. Bundled kits simplify procurement and validation, encouraging procurement managers to favor single-vendor solutions over piecemeal sourcing.


By Technique:
Chromatography Dominance Faces Filtration ChallengeChromatography retained 43.75% share of the desalting and buffer exchange market in 2025, anchored by size-exclusion and ion-exchange columns that deliver high selectivity for therapeutic proteins. Resin innovations with wider operational pH and salt ranges reduce the number of conditioning steps and drive cost-of-goods efficiency. Filtration methods, however, post a 12.41% CAGR to 2031 as continuous bioprocessing demands inline buffer exchange with minimal hold volumes. Ultrafiltration membranes capable of low protein binding and high flux rates bridge the gap between lab and manufacturing scale.
Precipitation techniques attract renewed attention in cost-sensitive vaccine installations, where polyethylene glycol (PEG) and ammonium sulfate achieve acceptable purity at a fraction of chromatographic consumable expense. Dialysis remains relevant for small-batch production where time penalties are tolerable. Hybrid workflows, combining a single-pass TFF step with polishing chromatography, illustrate how facilities optimize selectivity and throughput without extensive capital upgrades.
By Application:
Vaccine Production Accelerates Beyond Traditional BiologicsBiopharmaceutical manufacturing represented 48.76% of the desalting and buffer exchange market size in 2025, spanning monoclonal antibodies, fusion proteins, and recombinant enzymes. The pipeline shift toward antibody-drug conjugates and bispecific antibodies introduces higher molecular complexity, reinforcing purification stringency. Vaccine production, propelled by pandemic preparedness agendas, outpaces all segments at a 13.47% CAGR through 2031. mRNA vaccines require removal of template DNA, enzymes, and residual solvents, intensifying reliance on multimodal chromatography and inline diafiltration.
Diagnostic sample preparation gains momentum as decentralized testing and personalized medicine expand. Automated liquid-handling systems integrate plug-and-play desalting plates to maintain analytical throughput. Emerging applications, including food safety and environmental monitoring, diversify revenue streams, making the desalting and buffer exchange industry less dependent on monoclonal antibody cycles.
By Scale:
Commercial Manufacturing Gains MomentumLaboratory-level operations retained 57.84% share in 2025, reflecting academia’s pervasive role in early-stage discovery. Yet commercial manufacturing scale posts a 13.29% CAGR through 2031 as late-stage biologics secure regulatory approvals. Transitioning from gram-level runs to kilogram-level campaigns imposes new constraints on buffer supply, waste handling, and process analytics. The desalting and buffer exchange market size allocated to pilot-scale serves as a crucial bridge, allowing engineers to stress-test membrane lifetimes and resin capacities before multi-shift manufacturing begins.
Process intensification, characterized by continuous culture feeding directly into downstream skids, compels plants to adopt fully closed buffer exchange loops. Flexible single-use flow-paths promote rapid changeover between products, maximizing facility utilization. Vendors respond with filter cassettes rated for multi-use cycles without performance decay, trimming consumables cost per batch.
Geography Analysis
North America Desalting and Buffer Exchange Market
North America preserved its 41.88% revenue leadership in 2025, thanks to mature GMP frameworks, a dense cluster of CDMOs, and ready access to venture funding that accelerates technology refresh cycles. Regional demand also benefits from federal incentives aimed at reshoring critical bioprocessing components, which favor domestic suppliers of membranes and chromatography resins. The desalting and buffer exchange market size for North America will still expand at mid-single-digit rates as contract manufacturers add capacity to serve global clients.
Europe Desalting and Buffer Exchange Market
Europe follows with steady uptake rooted in stringent environmental and quality regulations. The bloc’s Green Deal nudges plants toward lower buffer consumption and recycling programs, stimulating interest in high-yield resins and membranes with extended lifetimes. Brexit-driven supply-chain adjustments redirect some procurement from UK-based distributors to continental hubs, but the overall technology adoption curve remains intact. Collaborative projects under the EU Horizon program support development of recyclable single-use plastics, which could alter consumables preferences over the long term.
APAC Desalting and Buffer Exchange Market
Asia-Pacific delivers the most dynamic outlook at an 11.22% CAGR through 2031. China’s pivot to Southeast Asian satellite facilities, combined with India’s bid to capture production displaced by the US Biosecure Act, fuels import demand for purification skids. Governments in Singapore and South Korea subsidize pilot-scale parks that bundle upstream and downstream assets, lowering barriers for domestic start-ups. The desalting and buffer exchange market share held by Asia-Pacific is therefore expected to rise steadily as new green-field plants come online and local reagent suppliers scale production.

Regulatory Landscape
Desalting and buffer exchange products used in regulated bioprocessing and analytical workflows fall under quality-system and intended-use requirements that differ by jurisdiction, with quality management alignment becoming more relevant for global suppliers. In the United States, FDA implemented the Quality Management System Regulation (QMSR) effective in February 2026, amending 21 CFR Part 820 by incorporating ISO 13485:2016 by reference and updating inspection expectations through the revised medical device manufacturer compliance program (7382.850). The update increases audit readiness for manufacturers that treat these tools as medical devices or as part of regulated device workflows.
In Europe, the EU Medical Device Regulation (Regulation (EU) 2017/745) governs device classification and conformity assessment expectations through Annex VIII rules, including specific considerations for devices intended to exchange or modify body liquids. That framework affects technical documentation and labeling for certain buffer exchange systems depending on claims and intended purpose. In research and QC environments, laboratory competence expectations also shape vendor qualification, with many analytical facilities operating to ISO/IEC 17025:2017 and tightening requirements around method validation, traceability, and documentation for desalting and buffer exchange steps used in release or stability testing.
Value Chain Analysis
The value chain begins with specialty raw materials and components, including polymer housings, membranes, and resins, which feed into device and consumable manufacturing for spin columns, filter devices and plates, dialysis formats, and chromatography media. Downstream steps include packaging, sterilization where relevant, and distribution through direct sales and life-science distributors to biopharma manufacturers, CDMOs, and research laboratories. At production scale, ultrafiltration/diafiltration (UF/DF) is the primary buffer exchange approach due to volume handling and integration into closed downstream skids, while gel filtration or size-exclusion chromatography remains central for analytical and smaller-scale desalting. Continuous biomanufacturing approaches increasingly combine inline dilution, staggered column cycles, and modular skid architectures to reduce hold tanks and footprint.
Key service nodes include application support, method development, and validation documentation that support tech transfer from lab to pilot and commercial operations, alongside after-sales support for automated platforms. Bottlenecks cluster around manual handling losses in small-scale workflows, time penalties associated with traditional dialysis, and dilution or throughput constraints in some chromatography set-ups. These constraints drive adoption of automation, including robotic and tip-based systems, and single-use, modular equipment from suppliers offering integrated filtration and chromatography workflows. Supply-chain resilience for membranes and resins remains a practical driver of lead times and qualification cadence, particularly for high-throughput consumables used across CDMO networks.
Competitive Landscape
Thermo Fisher Scientific’s USD 4.1 billion acquisition of Solventum’s Purification & Filtration unit marks a strategic push to own more of the downstream toolkit and cross-sell consumables with existing bioproduction hardware. Danaher’s merger of Cytiva and Pall forged a USD 7.5 billion entity boasting the industry’s broadest portfolio, enabling single-contract coverage from cell culture to final fill-finish. Such vertical integration pressures mid-tier players to find defensible niches in membrane coatings, specialty resins, or automation software.
Repligen’s purchase of chromatography innovator Tantti illustrates the scramble for differentiated intellectual property that can enhance flow-path performance or lower solvent use. Meanwhile, Sartorius focuses on modular single-use systems, launching TFF cassettes that promise 30% higher flux without compromising selectivity. Competitive advantage increasingly hinges on the ability to offer harmonized hardware-software ecosystems that collapse tech-transfer timelines for CDMO clients.
Environmental scrutiny prompts suppliers to invest in recyclable polymers and to quantify cradle-to-grave carbon footprints. Early-adopter firms position these metrics as value propositions during GMP audits. The expanding market pie also attracts newcomers specializing in 3D-printed flow-cells or AI-driven process control, adding incremental rivalry to incumbent portfolios. Overall, competition gravitates toward platform breadth, proven regulatory track records, and supply-chain resilience.
Desalting And Buffer Exchange Industry Leaders
Sartorius AG
Merck KGaA
Agilient Technologies, Inc.
Thermo Fisher Scientific Inc.
Danaher Corp. (Pall & Cytiva)
- *Disclaimer: Major Players sorted in no particular order
Desalting And Buffer Exchange Market Companies Covered in this Report
- Thermo Fisher Scientific
- Sartorius
- Merck
- Danaher Corp. (Pall & Cytiva)
- GE HealthCare Technologies
- Agilent Technologies
- Repligen
- Bio-Rad Laboratories
- 3M Purification
- Avantor
- Waters Corporation
- Lonza Group
- Genscript Biotech
- Tosoh
- Promega
- Creative Proteomics
- Norgen Biotek
- Bio-Works Technologies
- Asahi Kasei Bioprocess
- Spectrum Laboratories (Repligen)

Market Opportunities and Future Outlook
Process-intensification pressures are creating room for automated, single-use buffer exchange systems that reduce facility footprint associated with buffer operations and simplify validation across multi-product sites. A clear catalyst is the shift toward in-line buffer dilution and the associated redesign of buffer management, supported by industry reporting that buffer preparation and storage can consume up to 30% of total floor space in commercial-scale biomanufacturing. That makes compact buffer exchange and filtration platforms a lever for capacity utilization without adding large utility-heavy tanks.
Opportunities also track to technology pathways that reduce buffer and water usage while improving control in continuous or semi-continuous downstream operations. Academic work published in 2026 described asymmetric dialysis that reduced buffer consumption by up to 75% versus batch methods, along with new membrane cassette designs enabling simultaneous TFF diafiltration and ultrafiltration in closed configurations. On the commercialization side, automated smaller-scale manufacturing tools such as Cytiva's Akta readyflux TFF system 500 (introduced in July 2025) point to demand for turnkey, controlled UF/DF buffer exchange that bridges process development and clinical-to-small commercial production, particularly as CDMOs standardize platforms across sites.
Recent Industry Developments in Desalting And Buffer Exchange Market
- July 2026: Agilent expanded its Altura HPLC column portfolio with new inert size-exclusion (SEC) and PLRP-S columns for biotherapeutic analysis. The additions strengthen analytical chromatography workflows used to characterize desalting and buffer exchange outcomes, including aggregate and impurity profiling, supporting method consistency across development and QC labs.
- April 2026: Thermo Fisher Scientific opened a flagship U.S. Bioprocess Design Center in Plainville, Massachusetts. The center adds hands-on capability for customers to design and scale integrated bioprocess workflows, reinforcing vendor support around downstream purification and related buffer exchange steps during tech transfer.
- July 2024: Repligen agreed to acquire Tantti, adding chromatography technology to its portfolio. The acquisition broadened access to differentiated downstream purification capabilities that are often coupled with desalting and buffer exchange in end-to-end bioprocess workflows.


Desalting And Buffer Exchange Market Report Scope and Research Methodology
Market Definition and Coverage
This market covers products and techniques used to remove unwanted salts and small molecules from biomolecule samples, and to swap one buffer with another during research, development, and manufacturing workflows in life sciences.
Scope exclusions: We exclude unrelated downstream steps that do not perform desalting or buffer exchange (for example, full capture and polishing purification skids, broad analytical instruments, and general lab consumables).
Segments Covered in This Report
- By Product
- Spin Columns
- Dialysis Cassettes & Cartridges
- Centrifugal Filter Devices
- Kits
- Filter Plates
- Other Products
- By Technique
- Filtration
- Ultrafiltration / Diafiltration
- Dialysis
- Chromatography
- Size-Exclusion (Desalting)
- Ion-Exchange
- Precipitation
- PEG Precipitation
- Ammonium-Sulfate Precipitation
- Filtration
- By Application
- Biopharmaceutical Manufacturing
- Vaccine Production
- Diagnostic Sample Preparation
- Other Applications
- By Scale
- Laboratory-Scale
- Pilot-Scale
- Commercial Manufacturing-Scale
- Geography
- North America
- United States
- Canada
- Mexico
- Europe
- Germany
- United Kingdom
- France
- Italy
- Spain
- Rest of Europe
- Asia-Pacific
- China
- Japan
- India
- Australia
- South Korea
- Rest of Asia-Pacific
- Middle East & Africa
- GCC
- South Africa
- Rest of Middle East & Africa
- South America
- Brazil
- Argentina
- Rest of South America
- North America
Data Sources, Market Sizing, and Validation
Desk Research
Desk research started with public science and manufacturing signals that explain where desalting and buffer exchange demand comes from, and how it is typically purchased. We referenced sources such as the US FDA biologics approvals and guidance pages, NIH funding databases, CDC and WHO vaccine and biologics updates, and OECD health and R&D indicators to understand activity levels that typically translate into downstream processing needs.
To convert those demand signals into a workable sizing structure, we also reviewed sources such as USP and ICH quality expectations, which shape how buffer preparation and impurity control are handled in development and manufacturing, and then we reviewed peer reviewed articles on protein purification workflows. For supply context, we used trade association publications tied to bioprocessing and chromatography.
Company filings, investor decks, and press releases were used to map product portfolios, manufacturing footprint expansions, and category mix changes. For cross checks, we used paid subscriptions focused on company financials and intelligence, news and financials, and patent databases to confirm product launches and technology shifts. These desk research sources are illustrative and not exhaustive, and many other references were used for data collection, validation, and clarification.
Primary Interviews and Surveys
Primary work was used to pressure test what we saw in public sources, especially around average selling price ranges, replacement cycles for consumables, and how demand differs between R&D labs, CDMOs, and commercial manufacturing sites. We spoke with a mix of kit and consumable suppliers, instrument and workflow specialists, bioprocess users, and distribution-side contacts across key regions so the assumptions could be corrected before finalizing the model.
Distribution of primary research fieldwork respondents
| Company type | Respondent position | Region |
|---|---|---|
| Top tier: 25% | CXOs: 14% | APAC: 52% |
| Mid tier: 59% | Functional/Unit leaders: 33% | EMEA: 30% |
| Smaller Players: 16% | Managers: 53% | Americas: 18% |
Market-Sizing & Forecasting
Sizing was built using a top-down and bottom-up approach, where the top-down view reconstructs demand from bioprocessing activity and downstream workflow intensity, then gets checked against selective supplier-side math. In practice, we linked the demand pool to indicators such as biologics and vaccine production expansion, CDMO capacity additions, installed base growth for purification workflows, typical batch volumes, and the share of projects that require buffer exchange steps before key downstream operations.
For validation, bottom-up approximations were added using sampled price points and volume proxies across product types like spin columns, dialysis cassettes and cartridges, kits, and filter plates, followed by adjustments for channel mix and usage frequency. Where gaps existed, for example limited public visibility on smaller lab purchases, we used interview-based ranges for utilization and consumable replacement to avoid overcounting.
Forecasting used scenario analysis anchored on capacity and pipeline direction, then refined with expert input on variables that swing demand most, such as single-use adoption, shifts between chromatography and filtration approaches, and quality expectations that drive repeat runs. Assumptions were kept transparent so the model can be repeated when new approvals, capacity announcements, or pricing changes occur.
Data Validation & Update Cycle
Model outputs were triangulated across multiple checks, including region-level biologics momentum signals, consistency of implied consumption per facility, and alignment with observed price bands from interviews. When totals looked inconsistent with known production expansions or procurement patterns, the inputs were reworked and the assumptions were revisited with follow-up outreach.
Before sign-off, the dataset and calculations go through step-by-step analyst review so unit logic, currency handling, and growth drivers remain consistent across sections. The report is refreshed annually, and interim updates are triggered when material events occur, such as major capacity commissioning, regulatory shifts affecting downstream quality expectations, or notable pricing resets. Right before delivery, a final pass is completed so buyers receive the most current view available at that time.
Mordor Intelligence's Desalting and Buffer Exchange Market Size Versus Other Published Estimates
Published market values for desalting and buffer exchange often differ because the scope line is drawn differently, and because growth inputs such as pricing and capacity ramp timing are not always treated the same way. The table below summarizes how those choices can move the reported total even when everyone is tracking similar end-use demand.
The biggest gap drivers typically come from whether estimates count only consumables or also include related hardware, how they treat technique coverage (for example, including precipitation or narrowing coverage to chromatography only), and whether they assume steady ASP increases versus step changes tied to single-use formats. The benchmark table shows a tight spread around 2025, and in Mordor Intelligence's model the value reflects a defined mix of products and techniques used specifically for desalting and buffer exchange workflows, with 2025 as the valued year and a 2026-2031 forecast window.
Benchmark comparison
| Source | Market Size | Gaps in Research Methodology |
|---|---|---|
| Mordor Intelligence | USD 1.35 B (2025) | |
| Industry Research House A | USD 1.25 B (2025) | Uses a narrower product basket and leans more toward consumables, which can reduce the implied contribution from device-linked purchases in manufacturing settings. |
| Industry Research House B | USD 1.31 B (2025) | Applies a longer forecast framing and different pricing progression assumptions, which can shift the back-calculated base year value even if end use coverage looks similar. |
Overall, the comparison suggests that most of the variance comes from what gets counted around the core workflow and how pricing and timing assumptions are rolled forward. Our approach stays traceable to repeatable demand indicators and interview-tested usage patterns, which helps keep the estimate practical for planning and easy to update when conditions change.


Key Questions Answered in the Report
What is the projected value of the Desalting And Buffer Exchange market in 2031?
The market is forecast to reach USD 2.41 billion by 2031, reflecting a 10.12% CAGR.
Which product type currently dominates sales?
Spin columns lead with 37.62% revenue share in 2025 due to their ease of use in laboratory workflows.
Which region is expanding the fastest?
Asia-Pacific posts the highest growth rate at 11.22% CAGR as China and India scale biopharmaceutical capacity.
Why are centrifugal filter devices growing rapidly?
They support high-throughput screening and deliver higher recovery rates, driving a 12.18% CAGR through 2031.
What factor most constrains adoption of advanced filtration systems?
High capital outlays and operating costs reduce affordability, especially for emerging-market manufacturers.
How has industry consolidation altered supplier dynamics?
Large acquisitions such as Thermo Fisher–Solventum and Danaher’s Cytiva-Pall merger create integrated platforms that bundle hardware, consumables, and analytics.
Page last updated on:


 Your data is secure and never sold or shared.


