
Dermatology Devices Market Size and Share
Market Overview
| Study Period | 2020 - 2031 |
|---|---|
| Market Size (2026) | USD 18.12 Billion |
| Market Size (2031) | USD 31.19 Billion |
| Growth Rate (2026 - 2031) | 11.48 % |
| Fastest Growing Market | Asia Pacific |
| Largest Market | North America |
| Market Concentration | Medium |
Major Players *Disclaimer: Major Players sorted in no particular order Image © Mordor Intelligence. Reuse requires attribution under CC BY 4.0. | |
Dermatology Devices Market Analysis by Mordor Intelligence
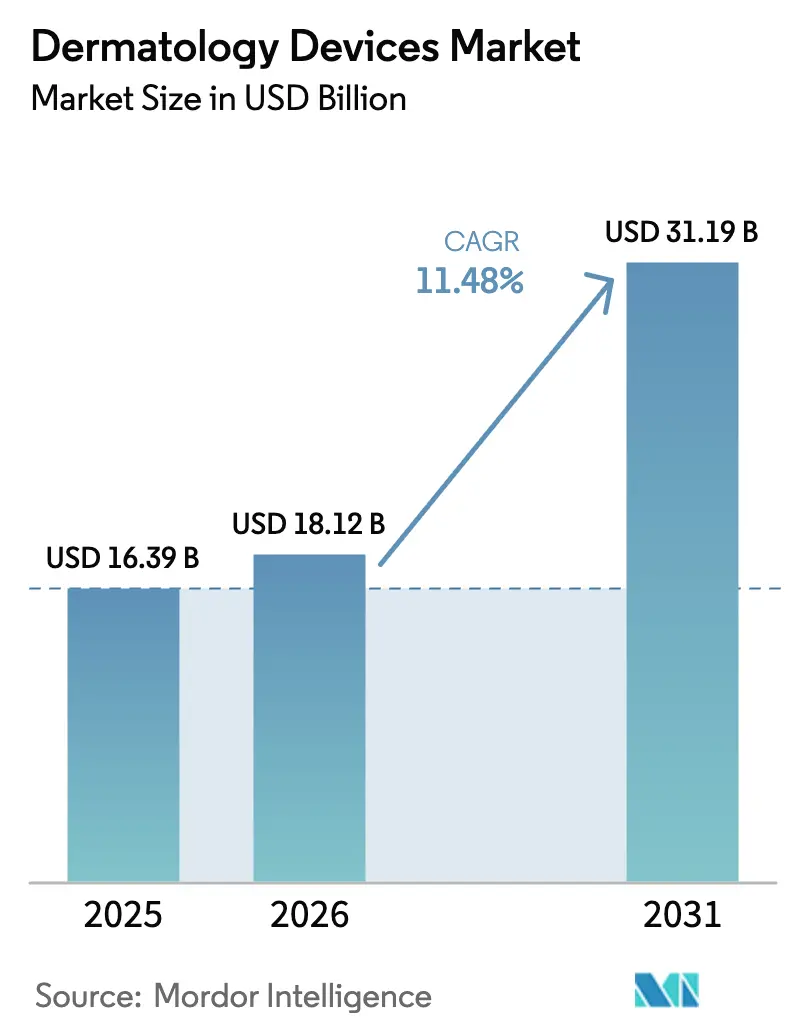
The Dermatology Devices Market size is expected to grow from USD 16.39 billion in 2025 to USD 18.12 billion in 2026 and is forecast to reach USD 31.19 billion by 2031 at 11.48% CAGR over 2026-2031.
Expanded insurance coverage for preventive imaging, a pivot toward multi-modality energy consoles, and subscription‐based equipment financing are collectively realigning capital from single-purpose aesthetic lasers to hybrid diagnostic–therapeutic platforms.[1]Centers for Medicare & Medicaid Services, “Telehealth Flexibilities and Reimbursement Policies,” Centers for Medicare & Medicaid Services, cms.gov Demand is also lifted by the 112,000 new U.S. melanoma cases expected in 2026 and the 28.2 million minimally invasive cosmetic procedures performed globally in 2025.[2]American Society of Plastic Surgeons, “2024 Plastic Surgery Statistics Report,” American Society of Plastic Surgeons, plasticsurgery.org Portable systems benefit from teledermatology reimbursements that now run through January 2026, while home-use IPL devices certified in 2025 expand consumer access. However, supply-chain exposure to Chinese rare-earth metals and rising scrutiny of 1–5 kW energy consumption under ISO 50001 threaten procurement for older consoles.
Key Report Takeaways
- By product type, treatment devices held 61.53% of Dermatology devices market share in 2025. Diagnostic devices are projected to grow at 13.75% CAGR between 2026-2031.
- By technology, laser platforms captured 41.77% revenue in 2025. Hybrid and other energy-based systems are forecast to advance at 14.54% CAGR to 2031.
- By device portability, fixed consoles commanded 67.84% of 2025 spending. Portable and handheld professional units will post a 15.63% CAGR through 2031.
- By application, skin cancer diagnosis accounted for 31.24% of 2025 revenue. Skin rejuvenation and resurfacing is set to rise at 13.84% CAGR over 2026-2031.
- By end user, dermatology clinics generated 44.74% demand in 2025. Homecare settings are on track for the fastest 15.93% CAGR during the outlook.
- By geography, North America led with 36.14% share in 2025. Asia-Pacific is predicted to grow at 13.43% CAGR through 2031.
Note: Market size and forecast figures in this report are generated using Mordor Intelligence’s proprietary estimation framework, updated with the latest available data and insights as of January 2026.
Market Trends and Insights
Drivers Impact Analysis of Dermatology Devices Market*
| Driver | (~) % Impact on CAGR Forecast | Geographic Relevance | Impact Timeline |
|---|---|---|---|
| Rising Prevalence of Skin Disorders and Skin Cancer | +2.3% | Global, highest in North America, Europe, Australia | Long term (≥ 4 years) |
| Growing Demand for Minimally Invasive Aesthetic Procedures | +2.8% | Global, concentrated in North America and Asia-Pacific cities | Medium term (2-4 years) |
| Advances in Laser and Imaging Technologies | +1.9% | Early adoption in North America and EU, spillover to Asia-Pacific | Medium term (2-4 years) |
| Increasing Disposable Income and Healthcare Spending in Emerging Markets | +2.1% | China, India, South Korea, GCC | Long term (≥ 4 years) |
| Teledermatology Uptake Spurring Portable Diagnostics | +1.6% | North America and EU, expanding to Asia-Pacific | Short term (≤ 2 years) |
| Subscription-Based Device Financing Models | +0.9% | North America and EU hospitals, pilots in Asia-Pacific | Medium term (2-4 years) |
| Source: Mordor Intelligence | |||
Rising Prevalence of Skin Disorders and Skin Cancer
Melanoma incidence is forecast to hit 112,000 new U.S. cases in 2026, and non-melanoma skin cancers cost payers USD 8.9 billion annually.[3]Surveillance, Epidemiology, and End Results Program, “Cancer Stat Facts: Melanoma of the Skin,” National Cancer Institute, cancer.gov This clinical burden accelerates uptake of AI-enabled diagnostic tools such as DermaSensor, cleared by FDA in 2024 for malignancy detection without biopsy. Psoriasis and acne collectively affect more than 150 million individuals worldwide, underpinning demand for excimer and 1,726 nm lasers that focus on sebaceous glands. Insurers now reimburse earlier detection, explaining why diagnostic imaging devices outpace treatment consoles. The trend is expected to persist as aging populations in North America and Europe move screening volumes higher.
Growing Demand for Minimally Invasive Aesthetic Procedures
The American Society of Plastic Surgeons logged 28.2 million minimally invasive treatments in 2025, led by neuromodulators and laser resurfacing. Fractional and hybrid lasers dominate new installations because they shorten recovery times yet cover multiple indications. An ASDS consumer survey showed 70% of respondents are considering a cosmetic procedure in 2025. Asia-Pacific’s rising disposable incomes turbocharge procedure counts, particularly within China’s CNY 178 billion aesthetic market in 2024. Fat-reduction demand contracted sharply in 2024, redirecting capital toward energy platforms that target collagen remodeling rather than adipocytes. Clinics therefore prefer consoles that allow quick pivoting among applications to maximize chair-time utilization.
Advances in Laser and Imaging Technologies
FDA clearances in 2024-2025 include the Accure 1,726 nm laser for acne and the multi-wavelength Stellar M22 IPL console. Hybrid systems that merge radio-frequency, ultrasound, and laser energy are expanding at 14.54% CAGR, far ahead of any single-technology category. AI-driven 3-D imaging from Canfield’s VECTRA and automated body mapping from FotoFinder further compress consultation-to-treatment cycles. Portable multiphoton microscopes now offer cellular-level imaging that plugs seamlessly into telehealth workflows. These advances improve diagnostic accuracy, reduce procedure downtime, and create a premium pricing tier that clinics willingly adopt when capital can be amortized across several indications.
Increasing Disposable Income and Healthcare Spending in Emerging Markets
China lifted healthcare spending to 7.1% of GDP in 2024, targeting 8-9% by 2030. India plans to reach 5% by 2025, and South Korea attracted more than 600,000 medical tourists in 2024 for dermatology-focused services. GCC governments under Vision 2030 fast-track device approvals, while Dubai positions itself to host 1 million medical tourists by 2027. Price-sensitive clinics in these regions increasingly select locally manufactured platforms that deliver acceptable efficacy at 30-40% lower cost than multinational equivalents. The net result is the highest regional CAGR at 13.43% for Asia-Pacific, with Latin America and the Middle East also accelerating as disposable incomes climb.
Restraints Impact Analysis of Dermatology Devices Market*
| Restraint | (~) % Impact on CAGR Forecast | Geographic Relevance | Impact Timeline |
|---|---|---|---|
| High Capital and Maintenance Costs of Advanced Devices | –1.4% | Global, stronger in emerging markets | Medium term (2-4 years) |
| Stringent and Heterogeneous Regulatory Approvals | –1.1% | Global, most complex in EU and China | Long term (≥ 4 years) |
| Energy-Efficiency and Sustainability Scrutiny in Procurement | –0.7% | EU and North America hospitals, spreading to Asia-Pacific | Medium term (2-4 years) |
| Supply-Chain Risk for Rare-Earth Laser Components | –0.9% | Global, North America and EU heavily dependent on Chinese inputs | Long term (≥ 4 years) |
| Source: Mordor Intelligence | |||
High Capital and Maintenance Costs of Advanced Devices
Multi-modality laser consoles range from USD 100,000 to USD 500,000, with annual service contracts adding 10-15% of purchase price. Consumables such as cooling cartridges and lamp replacements further erode margins. Small clinics in India and Brazil struggle to secure financing, often delaying upgrades until usage fees fall or leasing becomes available. Subscription models soften barriers yet transfer residual-value risk to manufacturers. Demand therefore skews to large aesthetic centers and academic hospitals that can amortize costs across higher patient throughput.
Stringent and Heterogeneous Regulatory Approvals
FDA 510(k) reviews average 6-12 months, but EU MDR certification now stretches to 24-36 months because of notified-body backlogs. China’s NMPA mandates domestic clinical studies for Class III devices, adding USD 1-3 million and up to 18 months before commercialization. These lags compress effective patent life and divert R&D capital toward compliance rather than innovation. Firms lacking global regulatory teams must partner or exit multi-region strategies, which in turn limits device availability in high-growth emerging markets.
*Our forecasts treat driver/restraint impacts as directional, not additive. The impact forecasts reflect baseline growth, mix effects, and variable interactions.
Dermatology Devices Market Segment Analysis
By Product Type:
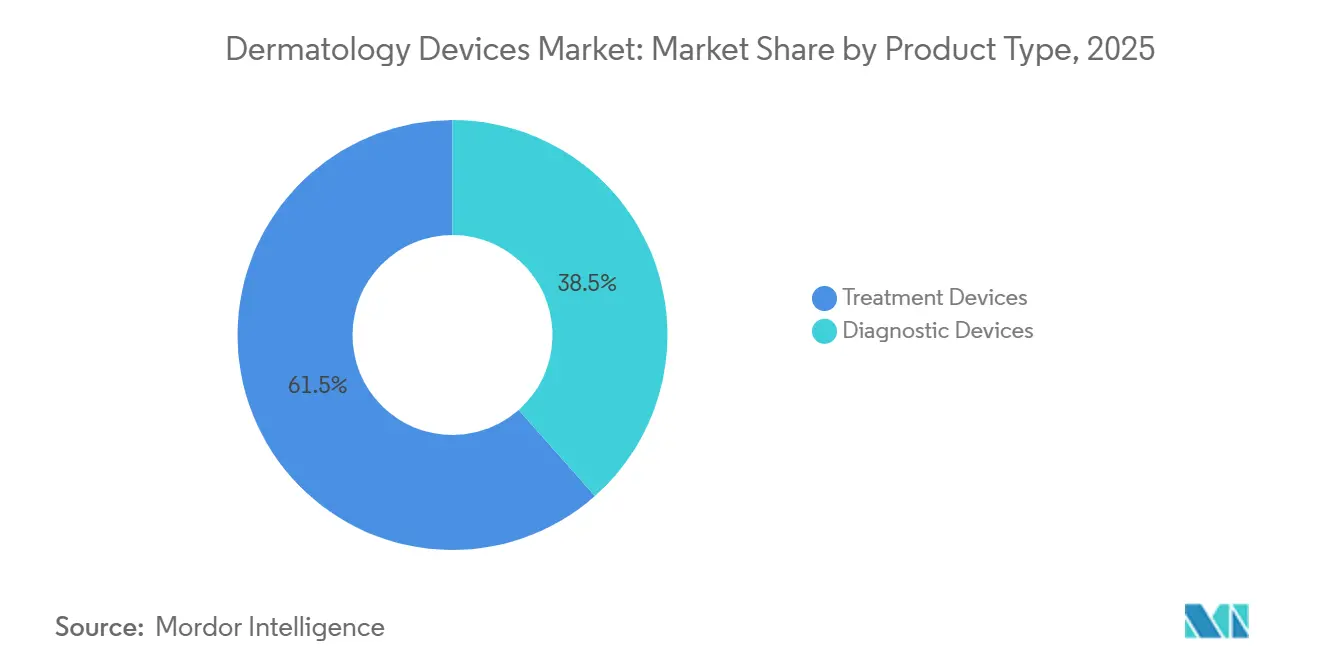
Diagnostics Move Ahead of TreatmentTreatment devices generated 61.53% of Dermatology devices market revenue in 2025 as clinics continued to invest in lasers, IPL, and RF consoles. Diagnostic imaging units, however, are forecast to advance at a 13.75% CAGR, reflecting payer incentives for early melanoma detection. The shift underscores how photo-documentation and AI-assisted assessment shorten diagnostic pathways, boosting adoption even in settings traditionally dominated by aesthetic treatments.
The Dermatology devices market size for diagnostics is on track to expand from an estimated USD 6.0 billion in 2026 to nearly USD 11 billion by 2031. DermaSensor’s 2024 FDA clearance and FotoFinder’s AI-based total-body mapping illustrate a pipeline tilted toward non-invasive lesion analysis. Treatment platforms remain essential for revenue, yet capital budgets increasingly balance high-margin consumable streams against strategic investments in imaging that lifts patient capture rates.


By Technology:
Hybrid Energy Platforms Break OutLaser systems held 41.77% Dermatology devices market share in 2025, but hybrid consoles that blend laser, RF, and ultrasound energies will post the strongest 14.54% CAGR. Clinicians value single-footprint solutions able to treat acne, vascular lesions, and photodamage without swapping rooms or power supplies.
Hybrid system growth elevates the Dermatology devices market size attached to multi-modality consoles while trimming the installed base of single-indication equipment. Lumenis’s Stellar M22 IPL platform and the Accure 1,726 nm laser highlight how new wavelengths and energy combinations widen clinical menus. Vendors consequently devote R&D funds to software updates and applicator refreshes rather than standalone hardware iterations.
By Device Portability:
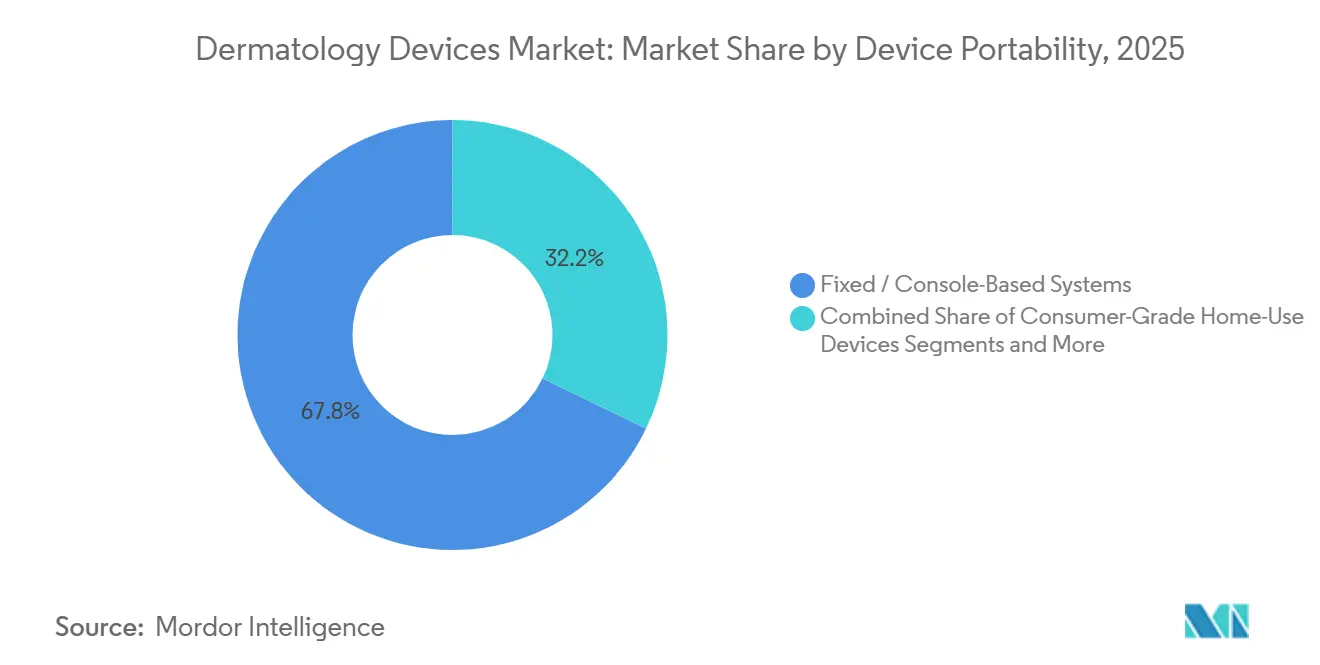
Handheld Units Capitalize on TelemedicineFixed consoles represented 67.84% revenue in 2025, supported by hospitals and high-volume spas that need robust cooling and higher power. Portable professional devices are projected to climb at 15.63% CAGR as telehealth billing codes reimburse remote dermoscopy and confocal imaging.
Dermatology devices market share is shifting modestly toward handhelds that attach to smartphones, offering quick triage during virtual consultations. Simultaneously, consumer-grade home-use IPL and LED gadgets rise on the back of 2025 FDA clearances for Philips Lumea and a Shenzhen IPL model. The competitive play thus bifurcates: premium clinics invest in networked consoles, while consumers accept lower-energy devices for maintenance treatments.

By Application:
Rejuvenation Takes the Growth LeadSkin cancer diagnosis remained the largest revenue slice at 31.24% in 2025, anchored by insurance-funded biopsies and excisions. Yet rejuvenation and resurfacing will log the quickest 13.84% CAGR through 2031 as patients favor visible but low-downtime outcomes.
Dermatology devices market size attributed to rejuvenation is expected to overtake cancer-focused revenues shortly after 2030. Fractional lasers, RF microneedling, and HIFU units address collagen depletion and photoaging for both medical and cosmetic indications. The 40% drop in fat-reduction sessions during 2024 confirms a pivot away from first-generation cryolipolysis toward technologies that remodel tissue rather than debulk adipose.
By End User:
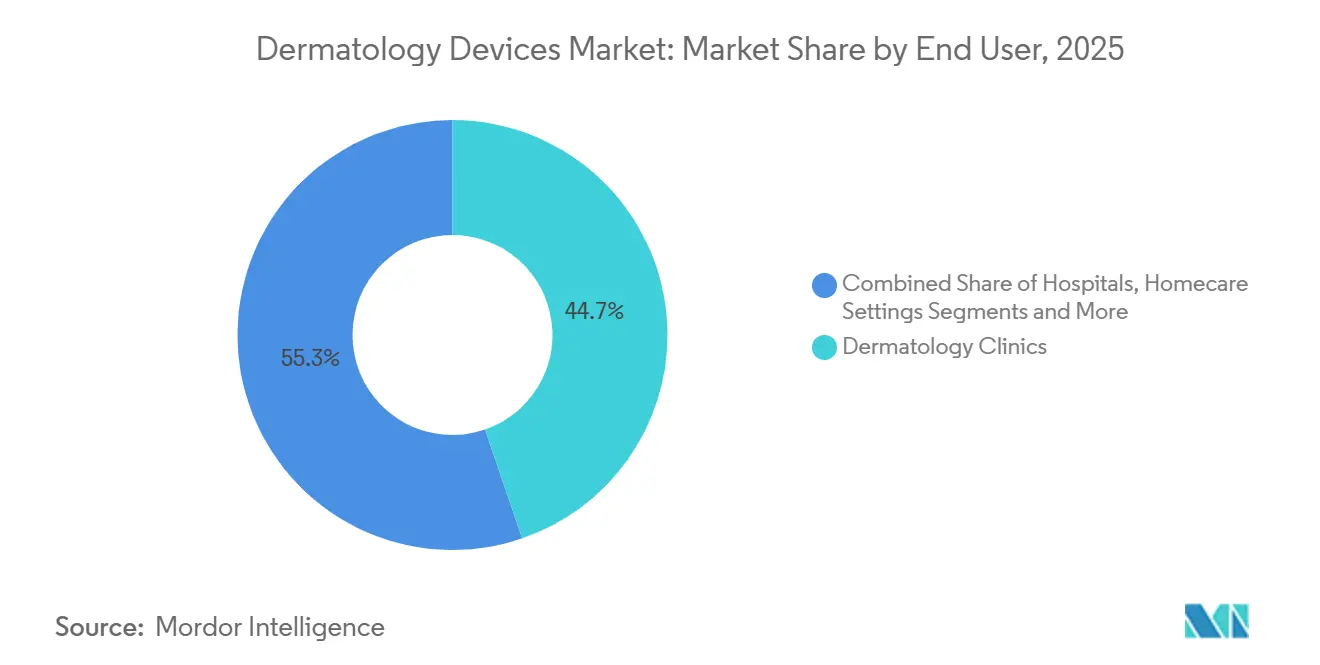
Homecare Expands FastestDermatology clinics captured 44.74% spending in 2025 as they bundle diagnostics with procedure packages. Homecare, however, will advance at 15.93% CAGR, propelled by FDA-approved consumer IPL units and continued post-pandemic preference for at-home maintenance.
The Dermatology devices industry responds by segmenting portfolios: professional-grade consoles with higher fluence and advanced cooling, and consumer devices with safeguard interlocks. Hospitals, although smaller buyers, retain specialty equipment for oncology and wound care where reimbursement supports capital intensity.
Geography Analysis
North America Dermatology Devices Market
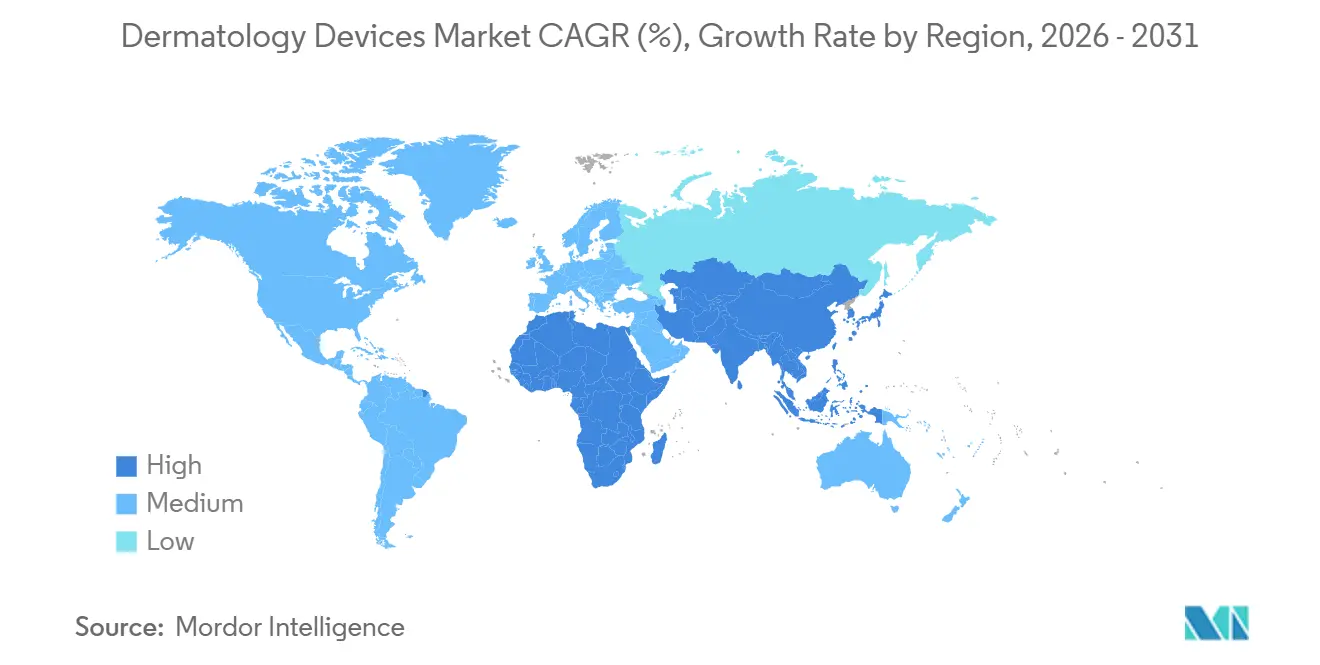
North America maintained 36.14% share in 2025, driven by 112,000 projected melanoma cases, rapid device clearance pathways, and telehealth reimbursement that encourages portable diagnostics. The region remains vulnerable to rare-earth supply disruptions but benefits from robust service networks and high discretionary income.
APAC Dermatology Devices Market
Asia-Pacific posts the fastest 13.43% CAGR as China’s aesthetic segment exceeded CNY 178 billion in 2024 and grows 15-20% annually. India’s device market moves toward USD 50 billion by 2030, aided by policy goals to expand healthcare spending. South Korea leverages medical tourism, while Japan’s aging demographics sustain demand for photoaging and oncologic care. Local manufacturing bases in China and South Korea allow price-optimized consoles that satisfy clinics operating on thinner margins.
Europe, Middle East and LATAM Dermatology Devices Market
Europe faces slower uptake because MDR certification delays stretch commercialization cycles to three years. Nonetheless, Germany, France, and the United Kingdom continue to invest in AI-assisted diagnostics and energy-efficient hybrid platforms. The Middle East, led by Saudi Arabia and UAE, accelerates equipment imports under Vision 2030, and Latin America’s Brazil remains the second-largest procedural market despite currency headwinds.

Regulatory Landscape
Dermatology devices navigate heterogeneous regulatory pathways across major markets. In the United States, FDA device classification and 510(k) premarket routes remain central, and the Quality Management System Regulation QMSR took effect in February 2026, reinforcing alignment to ISO 13485:2016 and elevating emphasis on design controls, supplier management, and documentation across diagnostic imaging systems and energy-based treatment platforms.
In software-aided skin lesion analysis, FDA issued a March 25, 2026 final order reclassifying certain adjunctive diagnostic devices from Class III to Class II with special controls, clarifying regulatory routes for AI-enabled lesion analysis relative to PMA requirements. In Europe, MDR implementation actions in 2026, including MDCG guidance around EUDAMED documentation uploads (referred to in MDCG 2026-4) and Regulation 2026/977, shape certification timelines, while notified-body capacity remains a factor affecting market access.
Value Chain Analysis
The dermatology devices value chain spans upstream precision optics, LEDs, sensors, energy-delivery components, specialty alloys, and electronics through design, verification, contract manufacturing, final assembly, regulatory documentation, and downstream distribution into hospitals, dermatology clinics, and aesthetic centers. Service and lifecycle revenue remains material for installed consoles, with calibration, preventive maintenance, software updates, applicators, and replacement parts typically managed by OEM field teams and authorized service networks.
Downstream commercialization relies on a mix of direct sales for high-value platforms and distributor networks for broader geographic reach. Group purchasing organizations influence hospital procurement and pricing, cited at nearly 72% of hospital device purchases flowing through GPO channels. Europe MDR documentation demands can delay certification, while FDA QMSR alignment to ISO 13485:2016 increases supplier qualification, dual-sourcing, and centralized documentation control to protect supply continuity.
Competitive Landscape
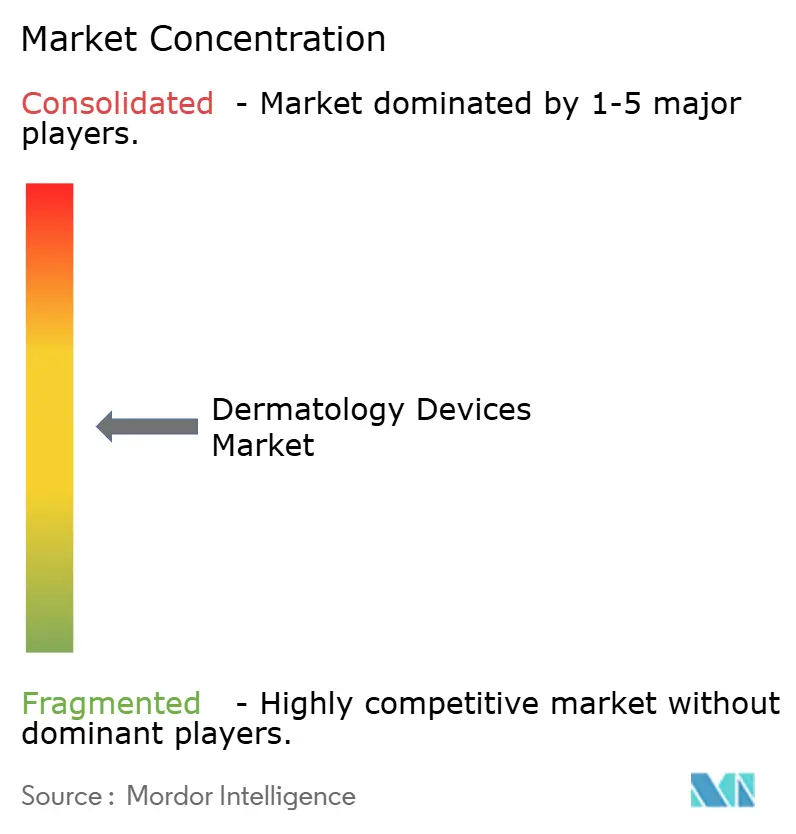
The Dermatology devices market exhibits moderate concentration. Lumenis, Candela, Cutera, BTL Industries, and Alma Lasers maintain leadership by offering multi-indication consoles plus full-service contracts. Candela’s USD 1.8 billion take-private in 2024 indicates private equity confidence in consolidation synergies. Cutera’s Chapter 11 filing later that year reflects financial strain on mid-tier firms juggling R&D and regulatory expenses.
Innovation pivots toward software-defined hardware; over-the-air upgrades extend platform life and anchor annuity consumable models. AI modules that predict outcomes improve patient conversion, giving early movers a compelling marketing advantage. Hybrid systems remain the battleground, with vendors competing on pulse-shaping algorithms, applicator ergonomics, and cloud-based utilization analytics.
Chinese manufacturers scale aggressively, underpricing multinationals by up to 40% yet improving output quality through ISO 13485 certification. Established brands counter with clinical-evidence dossiers and local training centers to defend premium positions in North America and Europe. Manufacturers also court hospitals by offering subscription financing that mirrors usage, thereby de-risking capital budgets and locking in long-term relationships.
Dermatology Devices Industry Leaders
Cutera Inc.
Hologic Inc. (Cynosure Inc.)
Lumenis Ltd
Alma Lasers
Candela Corporation
- *Disclaimer: Major Players sorted in no particular order
Dermatology Devices Market Companies Covered in this Report
- Aerolase Corp.
- Alma Lasers
- Bausch Health
- BTL
- Candela Medical
- Canfield Scientific Inc.
- Carl Zeiss
- Cutera
- DermLite LLC
- FotoFinder Systems
- Fotona d.o.o.
- HEINE Optotechnik
- Hologic
- Lumenis
- Michelson Diagnostics Ltd.
- Sciton
- SkinVision
- Strata Skin Sciences
- Candela Medical
- Venus Concept

Market Opportunities and Future Outlook
Regulatory actions in 2026 create whitespace in software-enabled skin diagnostics. FDA's March 25, 2026 final order reclassifying certain software-aided adjunctive diagnostic devices for skin lesion analysis from Class III to Class II with special controls lowers procedural barriers and supports faster iteration cycles for AI-assisted assessment, body mapping, and decision-support that complement dermoscopy and imaging. This is anchored by SciBase's July 2026 FDA 510(k) submission for Nevisense to broaden use into non-melanoma skin cancers.
On the treatment side, multi-modality platforms and upgradeable systems enable broader adoption of bundled software, applicators, and service into subscription or usage-based models to reduce upfront capex pressure. EU MDR compliance continues to act as a gating factor and a channel for differentiated execution: firms with mature technical documentation, clinical evaluation capability, and EUDAMED-ready processes can compete more effectively in Europe as notified-body capacity and documentation quality challenges persist. In parallel, FDA QMSR taking effect elevates the strategic emphasis on design controls and post-market feedback loops across imaging and energy-based portfolios.
Recent Industry Developments in Dermatology Devices Market
- July 2026: SciBase Holding AB submitted an FDA 510(k) to expand Nevisense into non-melanoma skin cancer indications. The submission targets a broader diagnostic addressable base beyond melanoma-focused workflows and supports a pathway for wider clinical use if cleared.
- August 2025: Cutera intensified its regional expansion strategy by enhancing its global distribution network for the Secret by Cutera portfolio, broadening channel coverage beyond North America.
- April 2024: Cutera announced the North America launch of xeo. The launch refreshed the company's platform positioning in a core market and added momentum to replacement-cycle purchasing among clinics standardizing on console ecosystems with service and upgrade pathways.


Dermatology Devices Market Report Scope and Research Methodology
Market Definition and Coverage
For this study, the dermatology devices market covers medical equipment used to diagnose, image, or treat skin conditions in clinical settings, including devices used for lesion assessment and procedural dermatology (such as energy-based systems).
Scope exclusions: We exclude consumer-only beauty gadgets, topical products, and general surgical tools that are not primarily used for dermatology procedures.
Segments Covered in This Report
- By Product Type
- Diagnostic Devices
- Treatment Devices
- By Technology
- Laser
- Light-based / IPL
- Radiofrequency (Mono-, Bi-, Multipolar)
- Ultrasound / HIFU
- Hybrid & Other Energy-Based Systems
- By Device Portability
- Fixed / Console-Based Systems
- Portable / Handheld Professional Devices
- Consumer-Grade Home-Use Devices
- By Application
- Skin Cancer Diagnosis
- Psoriasis
- Acne & Acne Scar
- Hair Removal
- Skin Rejuvenation & Resurfacing
- Tattoo Removal
- Vascular & Pigmented Lesion Removal
- Body Contouring / Fat Reduction
- By End User
- Hospitals
- Dermatology Clinics
- Aesthetic / Cosmetic Centers & Spas
- Homecare Settings
- By Geography
- North America
- United States
- Canada
- Mexico
- Europe
- Germany
- France
- United Kingdom
- Italy
- Spain
- Rest of Europe
- Asia-Pacific
- China
- Japan
- India
- South Korea
- Australia
- Rest of Asia-Pacific
- Middle East & Africa
- GCC
- South Africa
- Rest of Middle East & Africa
- South America
- Brazil
- Argentina
- Rest of South America
- North America
Data Sources, Market Sizing, and Validation
Desk Research
Desk research was used to set the fact base, build initial assumptions, and keep the model tied to observable healthcare activity. Public sources reviewed include, for example, CDC skin cancer statistics, NIH and PubMed clinical literature, FDA device databases and safety communications, WHO health indicators, and OECD health expenditure series.
We also reviewed manufacturer annual reports and investor presentations, dermatology association websites, customs or trade summaries where relevant for device categories, and reputable press for product approvals and facility expansion news. For company mapping and longer-term trend checks, we referenced paid subscriptions for company financials and intelligence, news and financials, and patent databases. These examples are not exhaustive, and many other public sources were used for data collection, cross-checks, and clarifying category boundaries.
Primary Interviews and Surveys
Primary inputs were collected through expert interviews and structured surveys with dermatologists, clinic administrators, hospital procurement teams, distributors, and device service partners across major regions. The respondent input helped validate procedure mix changes, replacement cycles, price bands, and the adoption pace for newer platforms, then the assumptions were stress-tested against desk research signals before finalizing totals.
Distribution of primary research fieldwork respondents
| Company type | Respondent position | Region |
|---|---|---|
| Top tier: 29% | CXOs: 16% | APAC: 51% |
| Mid tier: 54% | Functional/Unit leaders: 25% | EMEA: 29% |
| Smaller Players: 17% | Managers: 59% | Americas: 20% |
Market-Sizing & Forecasting
The sizing model starts with a top-down build that reconstructs the demand pool using procedure volumes and treated patient activity in dermatology clinics, hospitals, and ambulatory settings, which are then converted into device spending. Results are corroborated with selective bottom-up approximations such as sampled ASP multiplied by estimated unit shipments for key device classes, distributor channel checks, and install base replacement math to adjust totals where needed.
Inputs used in the model include (illustrative) skin cancer and chronic skin disease prevalence signals, the share of office-based dermatology procedures that use energy-based platforms, average utilization per device, replacement and service cycles, and pricing progression for new system launches versus legacy platforms. Where country-level procedure data is not consistent, gaps are handled by applying proxy ratios from comparable markets and then rechecking them with primary feedback.
Forecasts were built using scenario analysis, where the base case is anchored on expected procedure growth, capacity additions in dermatology and med spa settings, and pricing trends shared by interviewees. Assumptions were also checked for reasonableness against macro indicators like healthcare spend growth and outpatient shift patterns, so the trajectory remains practical to defend on a client call.
Data Validation & Update Cycle
Validation is done through multiple passes of triangulation, where modeled totals are compared with independent signals like procedure trends, device approval timelines, and observed pricing bands from interviews. When large variances appear, the drivers are isolated by geography and device class, and the assumptions are recalculated before sign-off, followed by a separate analyst review for internal consistency.
The report is refreshed annually, and interim updates are triggered when there are material events such as major regulatory actions, large acquisitions, or step-changes in procedure volumes. Before delivery, the latest information is checked again so clients receive an updated view that matches the current market context.
Mordor Intelligence's Dermatology Devices Market Size Compared With Other Published Estimates
Published market values for dermatology devices do not always line up because each publisher can count a different mix of clinical versus consumer devices, use different base years, and apply different price and utilization assumptions.
The main gap comes from whether at-home beauty tools and adjacent aesthetic categories are included, where Mordor Intelligence counts only clinically used diagnostic and treatment devices and excludes consumer beauty gadgets, and that narrower scope pulls totals away from broader lifestyle-device estimates.
Benchmark comparison
| Source | Market Size | Gaps in Research Methodology |
|---|---|---|
| Mordor Intelligence | USD 16.39 B (2025) | |
| Global Consultancy A | USD 16.81 B (2024) | Uses a different base year and mixes in a wider set of country rollups, and some sections on the page show inconsistent historical anchors, which can shift the starting point for CAGR-based projections. |
| Industry Publisher B | USD 17.28 B (2024) | Shows multiple market-size figures and long-range projections on the same page, and the inclusion rules are not clearly separated by clinical versus consumer scope, which can inflate totals when adjacent aesthetic devices are bundled in. |
Taken together, the spread is mainly explained by scope boundaries, base-year choices, and how pricing and utilization are carried forward. By keeping the demand pool tied to clinical procedure activity and checking totals with practical secondary signals and expert validation, the estimate stays traceable to inputs a buyer can understand and repeat.


Key Questions Answered in the Report
How fast is global demand for dermatology devices growing through 2031?
The Dermatology devices market is forecast to expand at an 11.48% CAGR between 2026 and 2031, reaching USD 31.19 billion by the end of the period.
Which device category is gaining share the quickest?
Diagnostic imaging systems are projected to grow at 13.75% CAGR, the fastest among product types, as payers fund early cancer detection.
What technology trend is reshaping clinic purchasing decisions?
Hybrid energy consoles that blend laser, radio-frequency, and ultrasound modalities show the highest 14.54% CAGR because they cover multiple indications in one platform.
How will telehealth policy changes affect device uptake?
Current U.S. teledermatology reimbursements valid through January 2026 drive strong sales for portable imaging units, but pending policy reviews could slow growth thereafter.
Which region will lead incremental revenue through 2031?
Asia-Pacific, lifted by China, India, and South Korea, is expected to post the fastest 13.43% CAGR and contribute the largest share of new revenue additions.
Are subscription financing models becoming mainstream?
Yes, hospitals and large clinics increasingly prefer usage-based leases that convert equipment purchases into operating expenses, a model manufacturers now support.
Page last updated on:


 Your data is secure and never sold or shared.


