
Dermatology CRO Market Size and Share
Market Overview
| Study Period | 2020 - 2031 |
|---|---|
| Market Size (2026) | USD 6.02 Billion |
| Market Size (2031) | USD 8.10 Billion |
| Growth Rate (2026 - 2031) | 6.11 % |
| Fastest Growing Market | Asia-Pacific |
| Largest Market | North America |
| Market Concentration | Medium |
Major Players *Disclaimer: Major Players sorted in no particular order Image © Mordor Intelligence. Reuse requires attribution under CC BY 4.0. | |
Dermatology CRO Market Analysis by Mordor Intelligence
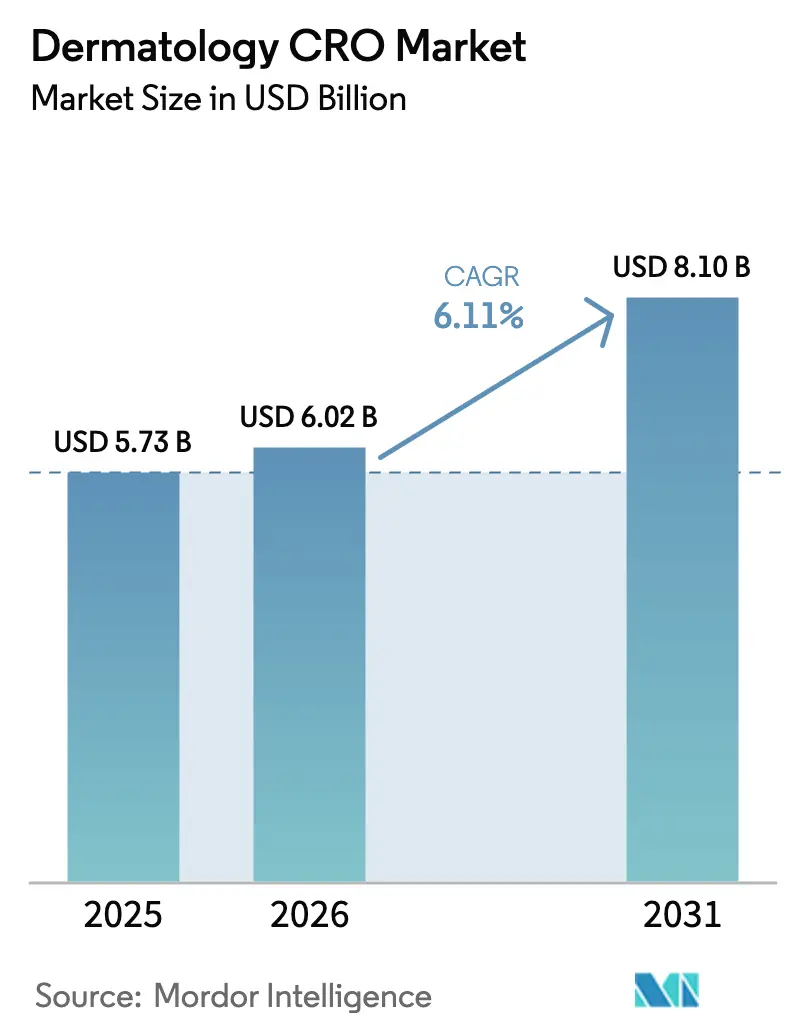
The Dermatology CRO Market size is projected to expand from USD 5.73 billion in 2025 and USD 6.02 billion in 2026 to USD 8.10 billion by 2031, registering a CAGR of 6.11% between 2026 to 2031.
Shifting sponsor pipelines toward biologics that target chronic inflammatory diseases, together with the rise of gene-editing platforms for rare genodermatoses, is increasing demand for therapeutic-area contract research expertise. Investors are funding early-stage dermatology ventures at record levels, and these companies routinely outsource more than 80% of clinical operations to preserve cash for manufacturing scale-up. Regulators on both sides of the Atlantic now permit adaptive and decentralized designs that shorten timelines and lower per-patient costs, encouraging sponsors to prioritize speed-to-market over cost containment. Meanwhile, CROs able to pair AI-driven lesion imaging with real-time data analytics capture premium pricing in Phase II and pivotal studies.
Key Report Takeaways
- By service type, Clinical Trial Services held the leading 44.63% share of the dermatology CRO market in 2025, whereas Data Management & Biostatistics is projected to grow the quickest at a 10.35% CAGR through 2031.
- By phase, Phase II commanded 36.13% of dermatology CRO market share in 2025, while Phase I is forecast to post the fastest 9.74% CAGR over 2026-2031.
- By study design, Interventional trials accounted for 53.64% of dermatology CRO market share in 2025, whereas in-silico / digital trials are expected to advance at a 10.53% CAGR to 2031.
- By sponsor type, pharmaceutical companies led with a 61.75% share of the dermatology CRO market in 2025, while biotechnology firms are set to expand at a 9.43% CAGR through 2031.
- By indication, psoriasis retained the largest 26.31% slice of dermatology CRO market size in 2025, whereas rare dermatologic disorders are projected to record the highest 8.24% CAGR to 2031.
- By geography, North America dominated with 39.42% of dermatology CRO market share in 2025, while Asia-Pacific is poised to deliver the strongest 8.46% CAGR over 2026-2031.
Note: Market size and forecast figures in this report are generated using Mordor Intelligence’s proprietary estimation framework, updated with the latest available data and insights as of January 2026.
Market Trends and Insights
Drivers Impact Analysis of Dermatology CRO Market*
| Driver | (~) % Impact on CAGR Forecast | Geographic Relevance | Impact Timeline |
|---|---|---|---|
| Rising Prevalence of Chronic Skin Diseases | +1.2% | Global, highest in North America and Europe | Long term (≥ 4 years) |
| Growing R&D Investment by Dermatology-Focused Pharma & Biotech Firms | +1.5% | North America, Europe, emerging APAC hubs | Medium term (2-4 years) |
| Accelerating Sponsor Outsourcing to Specialized Dermatology CROs | +1.8% | North America, Europe, APAC core markets | Short term (≤ 2 years) |
| Regulatory Support for Adaptive & Accelerated Pathways | +0.7% | North America, EU, spillover to APAC | Medium term (2-4 years) |
| Decentralized / Virtual Trials Enabled by AI Imaging | +1.0% | Faster adoption in North America, select EU | Medium term (2-4 years) |
| Emerging Demand for UV-Induced DNA-Damage Biomarkers | +0.4% | Early traction in North America, Australia | Long term (≥ 4 years) |
| Source: Mordor Intelligence | |||
Accelerating Sponsor Outsourcing to Specialized Dermatology CROs
Sponsors are pivoting from generalist providers to niche CROs that train investigators on PASI, EASI, and Investigator Global Assessment scoring. Functional-service agreements embed CRO staff within sponsor teams, allowing tighter oversight while offloading monitoring and reconciliation tasks. Endpoint variability can inflate sample sizes by up to 30% if assessors lack certification, so sponsors pay premiums—often exceeding USD 15 million for global pivotal studies—to partners that guarantee centralized image adjudication. The pattern is strongest in psoriasis and atopic dermatitis Phase II programs and is spreading across Asia-Pacific as Western firms navigate China’s Center for Drug Evaluation and Japan’s ethnic-sensitivity requirements. Niche CROs that own proprietary training modules continue to win contracts even when price competition intensifies.
Growing R&D Investment by Dermatology-Focused Pharma & Biotech Firms
Dermatology R&D outlays by the ten largest pharmaceutical companies increased from USD 8 billion in 2021 to USD 11 billion in 2025 as pipelines diversified toward IL-13, IL-17, and IL-23 pathways. Venture financing topped USD 2.3 billion in 2024, channeling capital to gene-therapy and RNA-interference start-ups. With limited internal resources, these younger firms outsource 80–90% of clinical work, boosting the Global dermatology CRO market. Recent FDA approvals for deucravacitinib and lebrikizumab validated novel mechanisms, reinforcing sponsor appetite for additional dermatology assets.
Decentralized / Virtual Dermatology Trials Enabled by AI-Powered Imaging
The FDA’s 2023 guidance on decentralized trials allows remote lesion photography as long as sponsors validate image quality.[1] By 2025, around 30% of Phase II studies used telehealth or smartphone apps for at least one endpoint. Canfield Scientific systems featuring machine-learning modules appear in 40% of North American trials, while GDPR-compliant platforms dominate in Europe. AI classifiers trained on 100,000+ images now match dermatologist inter-rater reliability, cutting per-patient costs by USD 1,200 and trimming enrollment timelines by up to 25%. Sponsors remain cautious about fully virtual control arms outside the United States, but hybrid models are moving toward mainstream adoption.
Regulatory Support for Adaptive & Accelerated Trial Pathways
The FDA’s December 2024 dermatology guidance allows predefined interim looks to adjust sample size or drop ineffective arms.[2] The EMA harmonized endpoint frameworks in early 2025, recognizing patient-reported outcomes such as POEM as co-primary measures. Breakthrough-therapy designations for skin-disease drugs climbed from eight in 2022 to fourteen in 2024.[3] Bayesian statisticians and orphan-drug regulatory writers are now core staffing needs for CROs pursuing rare-disease programs. Combined, these policy shifts shorten pivotal timelines by as much as six months and reduce protocol amendments across borders.
Restraints Impact Analysis of Dermatology CRO Market*
| Restraint | (~) % Impact on CAGR Forecast | Geographic Relevance | Impact Timeline |
|---|---|---|---|
| High Cost & Complexity of Subjective Endpoints | -0.8% | Global, acute in North America and Europe | Short term (≤ 2 years) |
| Investigator Shortages & Recruitment Bottlenecks | -0.6% | Global, severe in APAC and emerging markets | Medium term (2-4 years) |
| Data-Integrity Concerns With AI Assessment | -0.3% | Regulatory scrutiny highest in North America EU | Medium term (2-4 years) |
| Margin Pressure From In-House Digital Platforms | -0.5% | Concentrated among top-10 pharma sponsors | Short term (≤ 2 years) |
| Source: Mordor Intelligence | |||
High Cost & Complexity of Dermatology Trials Due to Subjective Endpoints
Per-patient costs run 25–35% higher than oncology or cardiology studies of comparable size because PASI and EASI scoring require certified raters, photographic documentation, and centralized review. A 600-patient Phase III psoriasis trial can exceed USD 40 million, with USD 8 million allocated to endpoint-specific activities. To compensate for inter-rater variability of up to 30%, sponsors routinely over-enroll by 10–20%. The FDA now insists on reliability studies before pivotal start, adding nine months to development. Smaller biotech companies sometimes shrink geographic scope or delay launches, tempering near-term growth in the Global dermatology CRO market.
Investigator Shortages & Patient-Recruitment Bottlenecks
Global dermatologist participation in clinical research is rising only 3% yearly, trailing the 8% annual increase in trial starts. The United States counts fewer than 1,500 principal investigators for dermatology out of 12,000 practicing dermatologists. Rare-disease prevalence below 1 in 50,000 necessitates multi-country enrollment, often involving advocacy-group registries. Asia-Pacific hurdles include China’s hospital-based credentialing and India’s fragmented state regulations. CROs pre-building networks and using electronic health records for patient-finding add 10–15% to budgets, but these efforts remain essential to keep timelines on track.
*Our forecasts treat driver/restraint impacts as directional, not additive. The impact forecasts reflect baseline growth, mix effects, and variable interactions.
Dermatology CRO Market Segment Analysis
By Service Type:
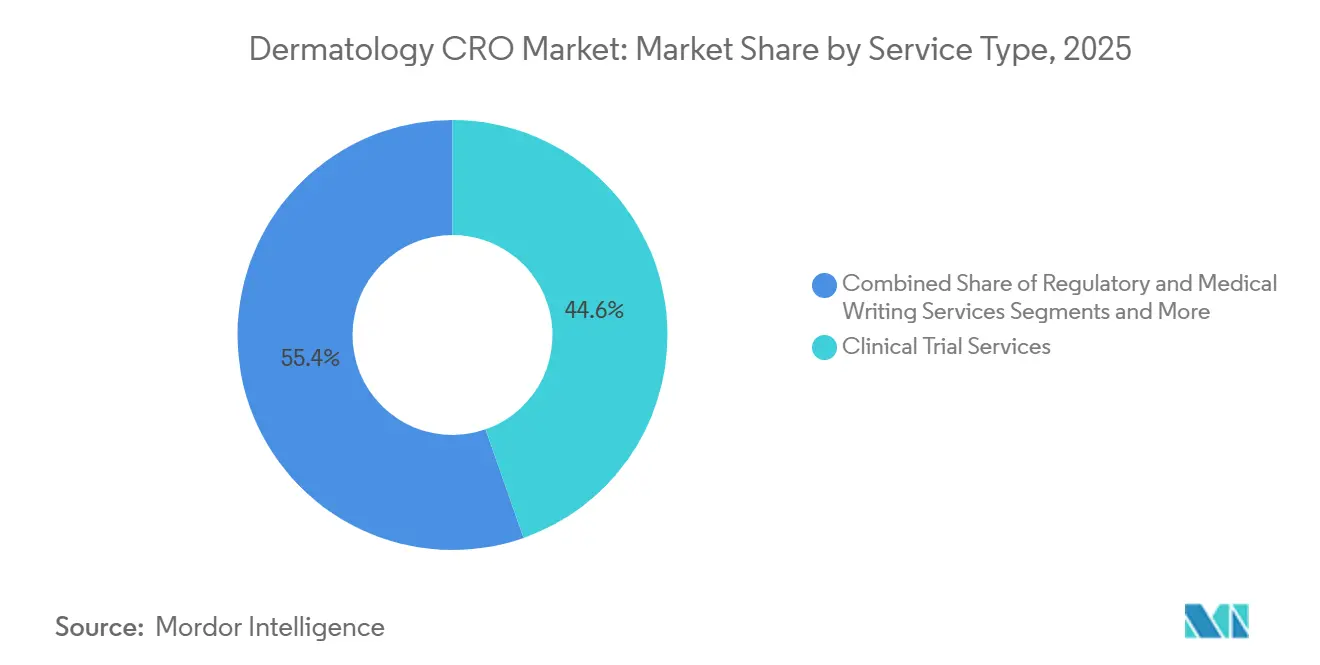
Clinical Trial Services Retain the Lead While Analytics Gains MomentumClinical Trial Services accounted for 44.63% of Global dermatology CRO market share in 2025 and stay central because sponsors need turnkey protocol development, monitoring, and safety reporting. Demand is especially heavy in Phase II psoriasis studies where rapid dose-ranging is critical. Data Management & Biostatistics, however, is the fastest riser, projected to post a 10.35% CAGR through 2031 as sponsors chase real-time dashboards and AI-assisted scoring. The Global dermatology CRO market size for analytics has grown as CROs integrate electronic data capture with lesion classifiers, slashing adjudication cycles to days. Secondary services such as Regulatory & Medical Writing command premium fees for orphan-drug dossiers, while Post-Market Monitoring gains relevance as accelerated biologic approvals come with long-term safety commitments.
Smaller but essential revenue streams emerge from Pre-clinical testing of topical formulations and Quality & Compliance audits. Three FDA warning letters in 2024 cited inadequate source-document verification, nudging sponsors to engage CROs offering independent audit teams. Competition intensifies around decentralized-trial readiness; vendors bolting telemedicine into standard monitoring attract higher margins than those providing commoditized site oversight alone.

By Phase:
Proof-of-Concept Dominates but First-in-Human SurgesPhase II commanded 36.13% of revenue in 2025, reflecting its role in establishing biopsy, imaging, or biomarker endpoints before sponsors commit to USD 100 million Phase III programs. Adaptive designs are trimming cohort sizes, yet Phase II remains the workhorse for psoriasis, atopic dermatitis, and emerging IL-17 assets. The Global dermatology CRO market size linked to Phase I is accelerating at 9.74% CAGR as gene-editing and topical RNA-interference agents enter the clinic. These novel modalities demand unique safety labs and pharmacodynamic sampling, opening niches for CROs operating leukapheresis units or GMP skin biopsy facilities.
Phase III growth is steadier because sponsors exploit interim analyses to lock in commercial positioning with fewer patients. Phase IV registries, though smaller by contract value, secure steady revenue as regulators expect real-world safety follow-up for systemic immunomodulators. CROs holding claims databases and EHR linkages draw disproportionate share of these post-approval studies.
By Study Design:
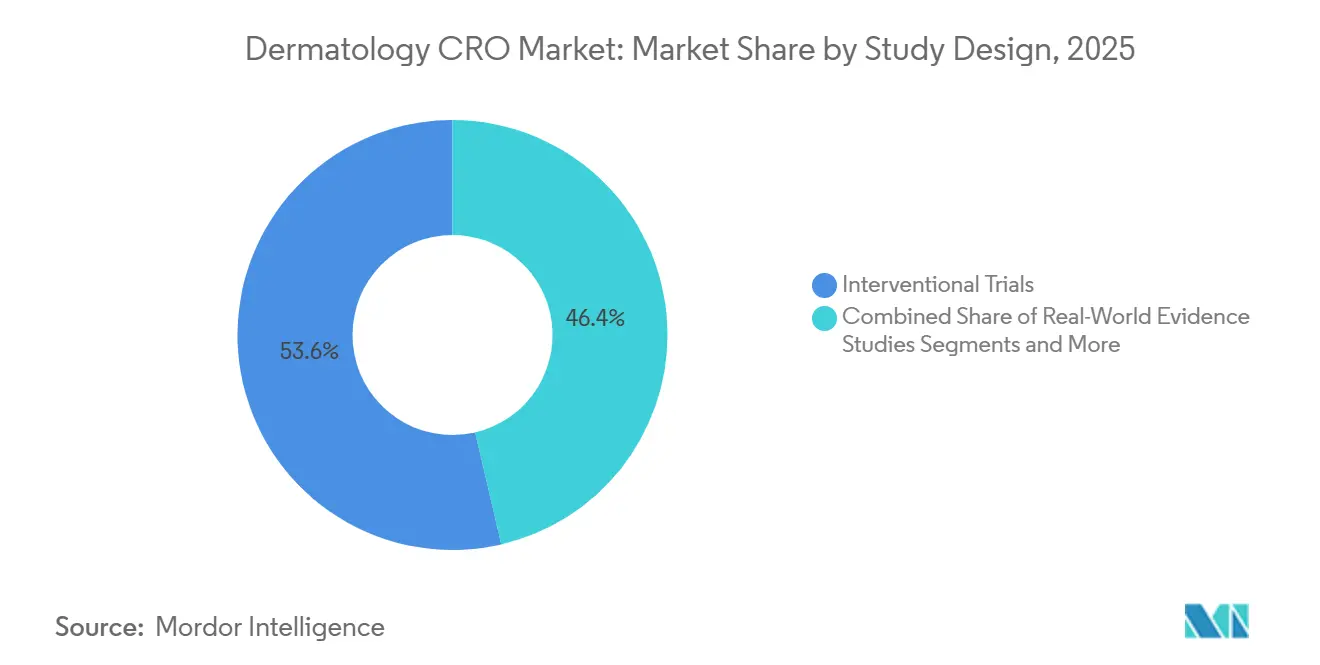
Interventional Remains Dominant as In-Silico Models Gain Regulators’ EarInterventional studies represented 53.64% of Global dermatology CRO market share in 2025 because randomized controlled trials remain indispensable for label expansion. Sponsors design active-controlled studies to avoid ethics concerns of placebo exposure in chronic conditions. Observational studies serve payer evidence needs, especially in markets where comparative effectiveness shapes reimbursement. Real-world evidence programs flourish under the FDA’s 2024 guidance that allows label changes using structured registry data if predefined criteria are met.
In-silico trials are projected to record a 10.53% CAGR, aided by virtual comparator arms that can reduce placebo enrollment by 40%. The first FDA-cleared in-silico control for psoriasis in 2025 set a precedent. While such designs are currently limited to early phases, sponsors appreciate six-month timeline savings. CROs that can generate synthetic arms from historical datasets position themselves for premium engagements once regulators broaden applicability.
By Sponsor Type:
Big Pharma Still Commands Budgets, yet Biotech Capital Fuels GrowthPharmaceutical companies held 61.75% of Global dermatology CRO market share in 2025, relying on full-service partners to execute global Phase III trials that support billion-dollar biologic franchises. They emphasize head-to-head efficacy versus legacy agents and demand robust safety monitoring to differentiate newer IL-23 or JAK inhibitors. Biotechnology firms, despite smaller budgets, are the volume growth engine with a 9.43% CAGR outlook to 2031. Venture-backed start-ups outsource nearly all operations, valuing flexible, modular services rather than monolithic contracts. Medical and aesthetic device sponsors contribute incremental upside through trials of laser resurfacing systems and transdermal patches.
Academic investigators often act as co-sponsors, especially in rare-disease programs where patient registries reside within university hospitals. Public-private partnerships further enlarge the Global dermatology CRO market as governments fund translational research into ultraviolet-induced DNA damage and photoaging biomarkers.
By Indication:
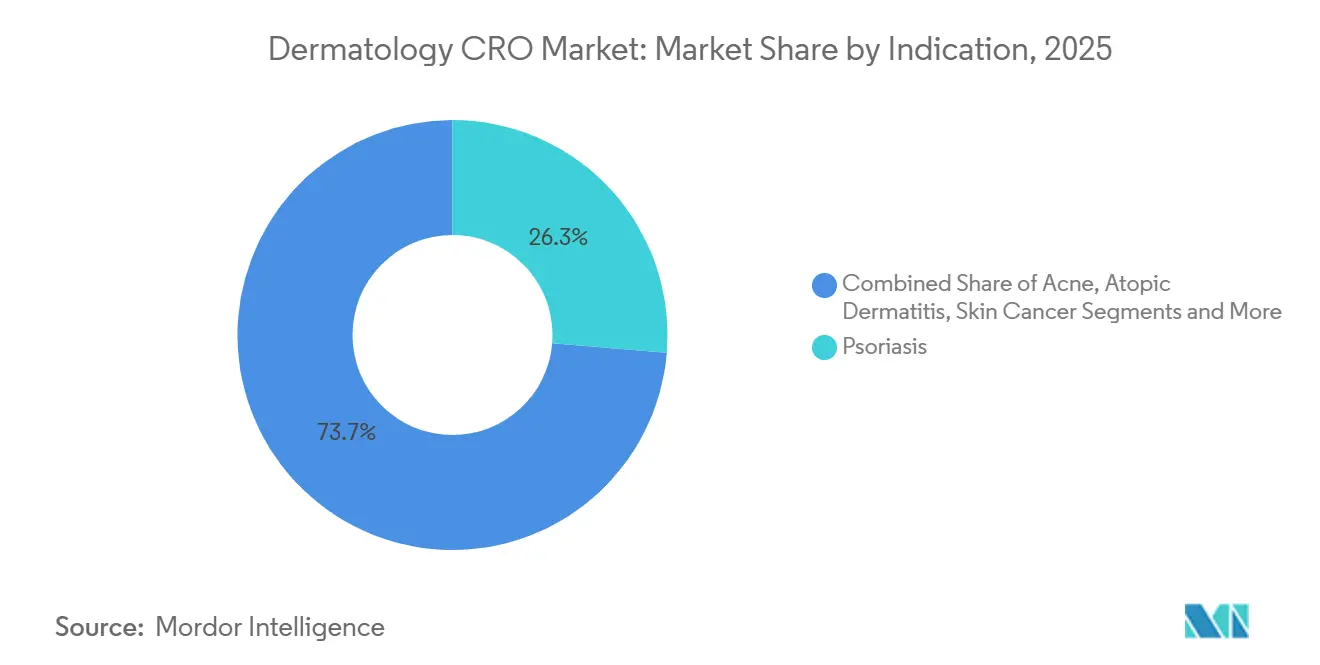
Psoriasis Dominates Revenue but Rare Conditions Drive MomentumPsoriasis generated 26.31% of revenue in 2025, aligning with its 125 million-patient global prevalence and robust biologic reimbursement. Sponsors frequently outsource large confirmatory trials comparing onset speed, dosing convenience, or durability. Atopic dermatitis is the second-largest bucket, propelled by JAK inhibitors and topical PDE4 agents. Acne studies remain smaller contracts because many products are generics or cosmetic in nature.
Rare dermatologic disorders, while currently accounting for a small slice, are forecast to post an 8.24% CAGR as CRISPR-based and gene-replacement therapies win orphan-drug designations. The Global dermatology CRO market size tied to ultra-orphan trials benefits from expedited FDA reviews and seven-year exclusivity that justify premium CRO pricing. Skin cancer studies, especially for topical basal-cell carcinoma treatments, add specialized imaging and recurrence endpoints, creating another niche for CRO differentiation.
Geography Analysis
North America Dermatology CRO Market
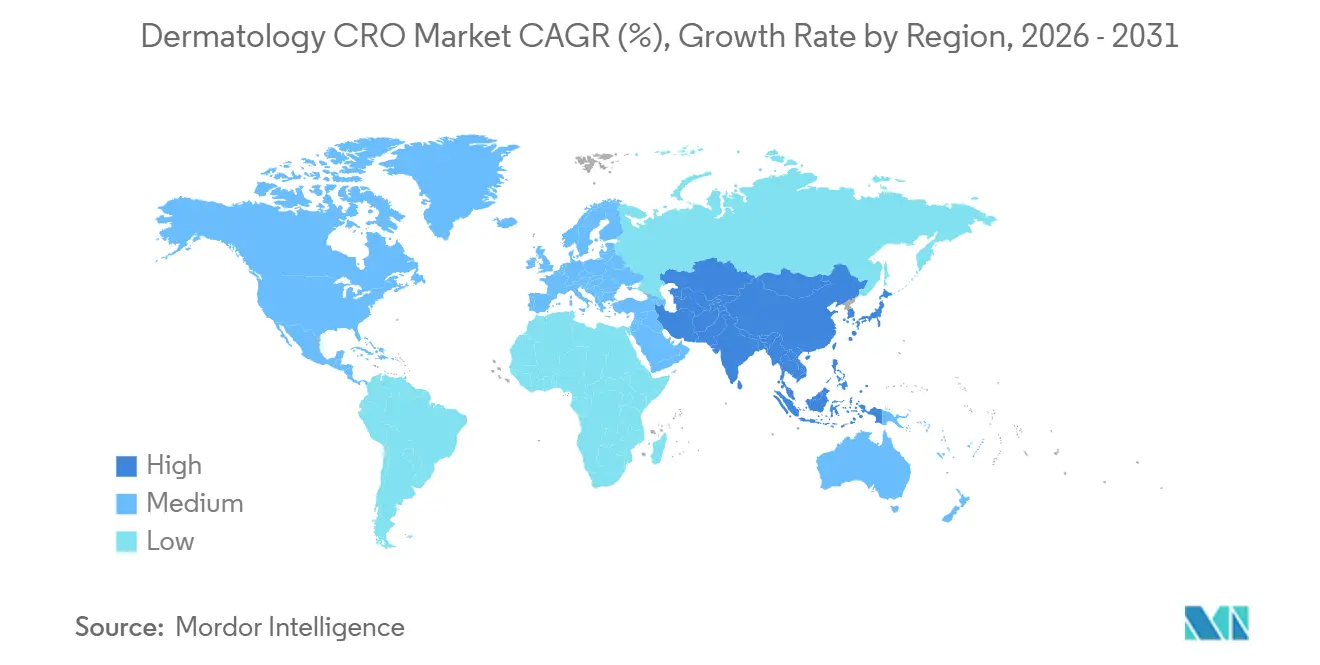
North America captured 39.42% of Global dermatology CRO market share in 2025 because the United States concentrates sponsor headquarters, investigator networks, and FDA incentives that speed approvals. Per-patient costs remain highest, yet sponsors accept the premium since U.S. data underpins payer negotiations. Canada and Mexico expand steadily as multi-ethnic enrollment hubs that reduce overall study budgets by up to 30%.
Europe Dermatology CRO Market
Europe with Germany, France, and the United Kingdom leading volumes due to harmonized EMA processes and widespread electronic health records that facilitate recruitment. The EMA’s 2025 endpoint harmonization trimmed cross-border protocol amendments by two months, lowering direct costs. Southern markets such as Italy and Spain now attract dermatology trials with 25% lower per-patient spending while preserving investigator quality.
APAC Dermatology CRO Market
Asia-Pacific is projected to post the fastest 8.46% CAGR to 2031. China compressed trial approvals to nine months by 2025, and Japan’s revised pricing rewards first-in-class dermatology drugs, fueling sponsor appetite. India offers 50–60% cost savings but grapples with investigator shortages and state-level regulatory fragmentation. Australia and South Korea, though smaller in volume, provide rapid ethics review cycles that appeal to early-phase gene-therapy studies.
MEA and South America Dermatology CRO Market
The Middle East & Africa and South America currently contribute modest revenue but attract rare-disease protocols where patient clusters exist. Saudi Arabia and the United Arab Emirates invest in research centers as part of economic diversification, while Brazil and Argentina entice sponsors with 20% lower monitoring fees despite longer approval timelines.
Regulatory Landscape
Global dermatology CRO work is shaped by ICH Good Clinical Practice and region-specific clinical trial rules that influence study design, data handling, and submission expectations across the United States, Europe, and Asia-Pacific. ICH E6(R3) entered into effect in the United States on September 8, 2025, and in Canada on April 1, 2026, reinforcing risk-based quality management and updating expectations for modern trial operations, while Annex 2 for non-traditional and decentralized designs continues to be finalized. In Europe, the EU Clinical Trial Regulation and the use of CTIS affect multinational study start-up and documentation practices, but continued divergence across FDA, EMA, NMPA, PMDA, and CDSCO on local-data expectations and submission processes keeps multi-regional dermatology programs dependent on strong regulatory strategy and country-specific execution.
Dermatology-specific guidance and review touchpoints also influence CRO scope, resourcing, and timelines. FDA End-of-Phase 2 meetings remain central for locking Phase III designs and pediatric requirements under PREA, which can affect monitoring, endpoint training, and statistical plans that CROs deliver. In July 2026, FDA issued final guidance for ANDAs on topical dermatologic corticosteroids, specifying an in vivo pharmacodynamic approach for bioequivalence, clarifying expectations for generic developers and increasing the value of CRO capabilities that combine clinical pharmacology operations with standardized endpoint execution.
Value Chain Analysis
The dermatology CRO value chain starts with sponsors, including pharma and biotech, defining development strategy and endpoints. Protocol design and feasibility follow, then site selection and regulatory start-up, which can span multiple authorities with differing local-data and submission requirements. Operational execution centers on specialized investigator networks and certified assessors for PASI, EASI, and other visual grading standards, backed by rater training, centralized image review, and eClinical systems that capture and quality-check lesion imagery and patient-reported outcomes. For biologics and other temperature-sensitive products, clinical supply logistics, including cold-chain distribution and accountability, run alongside safety management, pharmacovigilance, and bioanalytical testing where applicable.
Downstream activities include data management, biostatistics, medical writing, and submission support, followed by post-market monitoring and real-world evidence generation for long-term safety and effectiveness requirements. The service mix is shifting from fragmented vendor oversight to bundled, end-to-end models (including FSP arrangements) that combine clinical operations with data and safety functions. Within this chain, CRO differentiation increasingly depends on the reliability of subjective endpoints, access to dermatology-specialized sites (including academic centers), and the ability to operationalize decentralized or hybrid designs without compromising data integrity.
Competitive Landscape
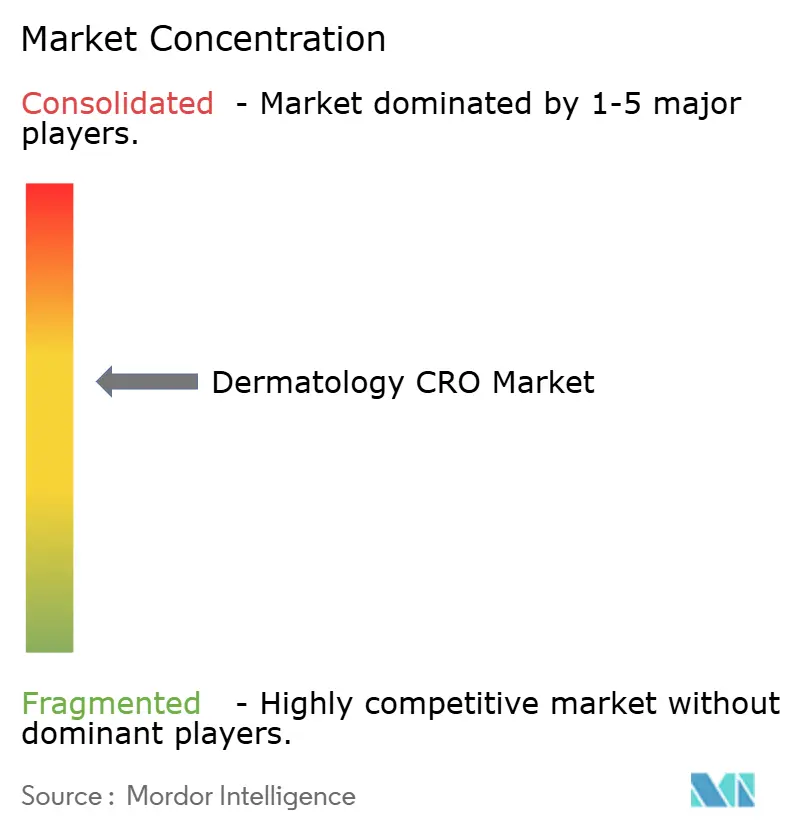
Competition is moderate to high. They leverage global investigator networks, proprietary imaging software, and regulatory affairs depth to secure large Phase III contracts. Mid-tier specialists such as TFS HealthScience and Dermatology Contract Research Inc. focus on rare diseases and investigator training, enabling premium rates despite a smaller scale. Functional-service models let sponsors combine monitoring from one vendor, data management from another, diluting the power of one-stop providers.
Technology-enabled disruptors, including Science 37 and Medable, pursue fully virtual trials. Regulatory acceptance remains limited to early phases, but their platforms pressure incumbents to integrate telemedicine and synthetic arms. Large CROs respond with acquisitions of eClinical start-ups and alliances with imaging companies; Syneos Health, for instance, embeds Canfield AI lesion analysis into its workflows. Pricing power erodes for commoditized Phase III execution, while CROs that demonstrate expertise in adaptive design, rare-disease recruitment, and in-silico modeling defend margins.
Sponsors themselves create headwinds by investing in internal digital platforms that replicate traditional CRO functions. Pfizer and Novartis have in-house monitoring dashboards, reducing reliance on external partners except for therapeutic expertise. Against this backdrop, CROs underscore domain knowledge, global regulatory intelligence, and curated investigator relationships as differentiators that remain hard for sponsors to reproduce.
Dermatology CRO Industry Leaders
-
Charles River Laboratories
-
ICON plc
-
IQVIA Holdings Inc.
-
Parexel International Corporation
-
Syneos Health Inc.
- *Disclaimer: Major Players sorted in no particular order
Dermatology CRO Market Companies Covered in this Report
- Accel Clinical Research
- Alira Health
- Atlantia Clinical Trials
- BioPharma Services Inc.
- Charles River
- Clinipace (dMed)
- CMIC Group
- Covance (Labcorp Drug Development)
- Dermatology Contract Research Inc. (DCRI)
- ICON
- IQVIA
- KCR S.A.
- Linical Co., Ltd.
- Lotus Clinical Research
- MedPace
- Novotech Health Holdings
- Parexel International
- Pharm-Olam
- Premier Research
- PSI CRO
- QPS Holdings LLC
- SGS
- Syneos Health
- TFS HealthScience
- Thermo Fisher Scientific
- WuXi Clinical (WuXi AppTec)
Market Opportunities and Future Outlook
Sponsor demand for integrated delivery models creates whitespace for CROs that can bundle dermatology clinical operations with data, safety, and regulatory consulting under functional service provider (FSP) arrangements, especially for venture-backed biotechnology programs that outsource a high share of execution. Multi-regional approvals remain operationally complex because dermatology programs must reconcile differences among FDA, EMA, and major Asia-Pacific authorities on local data expectations and submission workflows, which supports demand for CROs with on-the-ground start-up teams and harmonized endpoint training across regions. The December 2024 FDA position supporting predefined adaptive approaches, and the EMA endpoint harmonization work in early 2025, reinforce the need for CRO biostatistics and regulatory writing capabilities aligned to adaptive decision-making and patient-reported measures.
Digital and evidence-generation capabilities also create an opportunity area, as sponsors increasingly use AI-enabled imaging and real-world evidence to complement interventional programs and reduce site burden. IQVIA-backed planning for prospective real-world evidence work in chronic hand eczema (delgocitinib cream) highlights active sponsor demand for dermatology-focused RWE infrastructure and data operations adjacent to classic monitoring. In parallel, platform and capability build-outs across the CRO ecosystem, including technology-led additions and end-to-end discovery-to-development positioning, support requirements for partners that connect dermatology biomarker, imaging, and analytics workflows with clinical delivery, rather than providing monitoring alone.
Recent Industry Developments in Dermatology CRO Market
- June 2026: IQVIA reaffirmed service capabilities for global dermatology clinical trials, highlighting 25 years of experience and specialized staff. The execution reinforces its position in dermatology CRO services and premium pricing through proven execution expertise.
- May 2026: Charles River Laboratories launched an AI-powered end-to-end workflow for digital pathology to accelerate research. The launch expands data-readout speed and accuracy, enabling faster dermatology trial cycles and higher-value engagements.
- May 2026: IQVIA supported the formal launch of data collection planning for a prospective real-world evidence study on delgocitinib cream for moderate to severe chronic hand eczema. The initiative strengthens IQVIA's RWE offerings in dermatology, supporting faster market approvals and post-approval insights.
Dermatology CRO Market Report Scope and Research Methodology
Market Definition and Coverage
For this methodology, the dermatology CRO market covers outsourced services that support dermatology-focused research programs, mainly for drugs, biologics, and devices, across preclinical and clinical stages. The value is counted as CRO service revenue earned for dermatology-related work under sponsor contracts.
Scope exclusions: In scope, we do not count sponsor in-house clinical operations costs, site level provider revenue, routine patient care, or purely cosmetic spa services that are not linked to regulated study work.
Segments Covered in This Report
- By Service Type
- Pre-clinical Services
- Clinical Trial Services
- Post-Market Monitoring & Pharmacovigilance
- Regulatory & Medical Writing Services
- Data Management & Biostatistics
- Quality & Compliance Auditing
- By Phase
- Phase I
- Phase II
- Phase III
- Phase IV
- By Study Design
- Interventional Trials
- Observational Studies
- Real-World Evidence Studies
- In-silico / Digital Dermatology Trials
- By Sponsor Type
- Pharmaceutical Companies
- Biotechnology Firms
- Medical & Aesthetic Device Companies
- Academic & Research Institutes
- By Indication
- Acne
- Psoriasis
- Atopic Dermatitis
- Skin Cancer
- Rare Dermatologic Disorders
- By Geography
- North America
- United States
- Canada
- Mexico
- Europe
- Germany
- France
- United Kingdom
- Italy
- Spain
- Rest of Europe
- Asia-Pacific
- China
- Japan
- India
- South Korea
- Australia
- Rest of Asia-Pacific
- Middle East & Africa
- GCC
- South Africa
- Rest of Middle East & Africa
- South America
- Brazil
- Argentina
- Rest of South America
- North America
Data Sources, Market Sizing, and Validation
Desk Research
Desk work started with public demand and supply signals that can be tracked consistently across regions, then we used them to shape assumptions before speaking with experts. Sources used include ClinicalTrials.gov for dermatology trial activity, the US FDA and EMA public databases for approvals and safety updates, WHO and CDC publications for disease burden context, and OECD health statistics for broad healthcare spend patterns.
To connect these signals to revenue, we also reviewed company annual reports, investor presentations, and reputable press coverage to understand outsourcing mixes, pipeline focus, and service pricing direction. When needed, paid subscriptions for company financials and intelligence, patent databases, and a news and financials database were used to cross-check corporate activity and program intensity. The desk research sources listed here are not exhaustive, and many other public references were used to collect data, validate inputs, and clarify open questions.
Primary Interviews and Surveys
Primary work was used to validate what the desk signals suggested, and to avoid over counting adjacent work that is not truly dermatology CRO revenue. We spoke with a mix of sponsor-side teams, CRO delivery leaders, and operational specialists who see study starts, change orders, and pricing movement, and coverage was kept broad across major geographies to reflect where dermatology trials are being placed.
Inputs gathered included typical service bundling by phase, pass-through handling, regional staffing and site monitoring mixes, and the practical split between dermatology and immunology programs when indications overlap.
Distribution of primary research fieldwork respondents
| Company type | Respondent position | Region |
|---|---|---|
| Top tier: 31% | CXOs: 19% | APAC: 49% |
| Mid tier: 50% | Functional/Unit leaders: 37% | EMEA: 29% |
| Smaller Players: 19% | Managers: 44% | Americas: 22% |
Market-Sizing & Forecasting
Sizing starts from a demand pool build up where trial activity and sponsor outsourcing intensity are translated into CRO revenue potential, then adjusted for the share that is truly dermatology-specific. In practice, top-down modeling uses dermatology trial counts and mix by phase, study design complexity, typical service coverage (for example, monitoring, data management, medical writing, and regulatory support), and regional delivery rates to reconstruct a plausible revenue total.
Those totals are then checked using selective bottom-up approximations, such as sampled contract value ranges per study type and phase, plus supplier roll-ups from public financial disclosures where dermatology exposure can be reasonably inferred. When gaps appear, they are handled by applying conservative assumption bands, which are then tightened through expert feedback on realistic productivity, pass-through treatment, and outsourcing penetration.
Forecasts use scenario analysis because volume can move quickly with pipeline shifts and funding cycles, and because pricing is affected by staffing availability and protocol complexity. Key drivers used in the forecast include expected dermatology trial starts and terminations, mix shifts toward biologics and complex endpoints, regional site activation patterns, average study duration, and service pricing progression supported by what interviewees describe as their most likely case.
Data Validation & Update Cycle
Outputs are validated through multiple checks so the final numbers do not rely on a single source or one assumption. We compare the model result against independent signals like trial volumes, reported outsourcing commentary, and region-level delivery capacity indicators, and then we recheck any sharp jumps or unusual shares before sign off.
A second analyst review is performed for the key inputs, and any large variances trigger re contact with selected respondents for clarification. Reports are refreshed annually, and interim updates are made when material events change trial activity or pricing expectations. Before delivery, a fresh review pass is completed so clients receive an updated view based on the latest available information.
Mordor Intelligence's Dermatology Cro Market Sizing Compared With Other Published Estimates
Published market sizes for dermatology CRO services often differ because the service boundary is drawn differently, and because some models treat adjacent therapeutic work as dermatology when indications overlap. Differences also come from the base year chosen, the way pass-through costs are handled, and how quickly pricing assumptions are updated.
Clinical trial registry counts and phase mix shifts are the evidence checks that keep the Mordor Intelligence estimate aligned to dermatology-labeled demand, since revenue is only modeled when it can be tied back to study activity and typical CRO coverage for that work. The remaining spread versus other estimates is usually explained by whether drug discovery and broader immunology programs are included, and whether aggressive pricing uplift is applied without matching capacity and delivery constraints.
Benchmark comparison
| Source | Market Size | Gaps in Research Methodology |
|---|---|---|
| Mordor Intelligence | USD 5.73 B (2025) | |
| Global Consultancy A | USD 5.58 B (2025) | Uses a slightly tighter 2025 base and a broader definition that can blend dermatology with dermatological drugs and devices services across discovery to clinical, which shifts what is counted as CRO revenue. |
| Industry Publisher B | USD 5.78 B (2025) | Uses a different base-year setup and longer horizon, and it can apply generalized pricing progression across the period, which can lift totals even if trial start signals do not rise at the same pace. |
Looking across the three figures, the main takeaway is that small scope and pricing choices can move the 2025 number by a few hundred million dollars even before forecasting begins. By anchoring the model to observable study activity and then pressure testing revenue assumptions through interviews, the estimate stays repeatable and easier to audit when planning budgets or capacity.
Key Questions Answered in the Report
How fast is the Global dermatology CRO market expected to grow through 2031?
It is projected to expand at a 6.11% CAGR from 2027 to 2031, reaching USD 8.10 billion by the end of the forecast period.
Which service type will rise the quickest in value terms?
Data Management & Biostatistics is forecast to post the fastest 10.35% CAGR as sponsors adopt real-time analytics and AI lesion scoring.
Why are biotechnology sponsors so important to future demand?
Venture-backed biotechs outsource up to 90% of clinical operations, driving a 9.43% CAGR for CRO revenue linked to these firms through 2031.
What geographic region offers the highest growth outlook?
Asia-Pacific is set to rise at an 8.46% CAGR because of China’s faster approvals and Japan’s pricing incentives for novel skin therapies.
How are decentralized trials changing dermatology research?
FDA guidance now permits remote imaging and telehealth visits, cutting per-patient costs by USD 1,200 and enrollment times by up to 25%.
Which indication provides the strongest revenue base today?
Psoriasis maintains the largest 26.31% share thanks to multiple anti-IL-23 biologic franchises and continuing head-to-head trials.