
Dental Services Market Size and Share
Market Overview
| Study Period | 2020 - 2031 |
|---|---|
| Market Size (2026) | USD 681.46 Billion |
| Market Size (2031) | USD 852.84 Billion |
| Growth Rate (2026 - 2031) | 4.59 % |
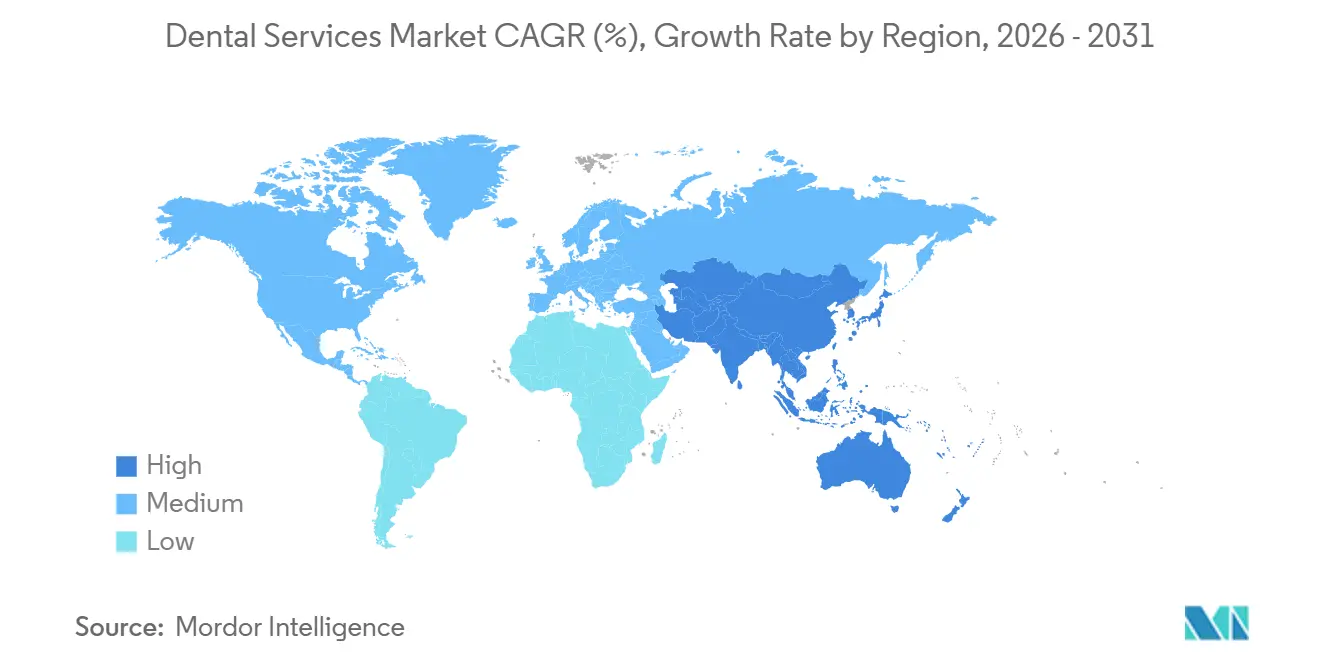
| Fastest Growing Market | Asia-Pacific |
| Largest Market | North America |
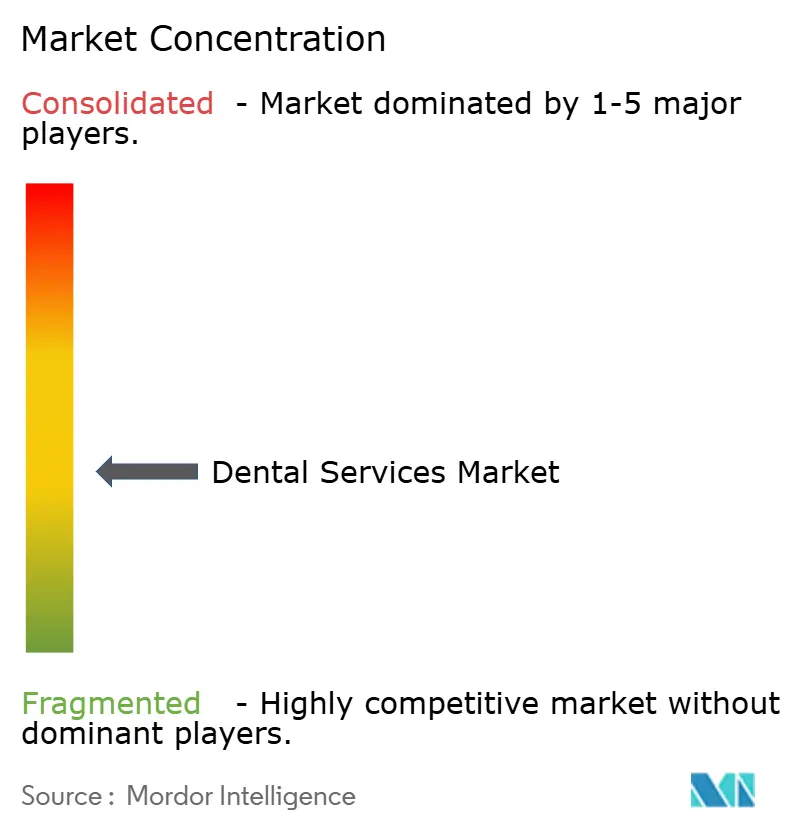
| Market Concentration | Medium |
Major Players *Disclaimer: Major Players sorted in no particular order Image © Mordor Intelligence. Reuse requires attribution under CC BY 4.0. | |
Dental Services Market Analysis by Mordor Intelligence
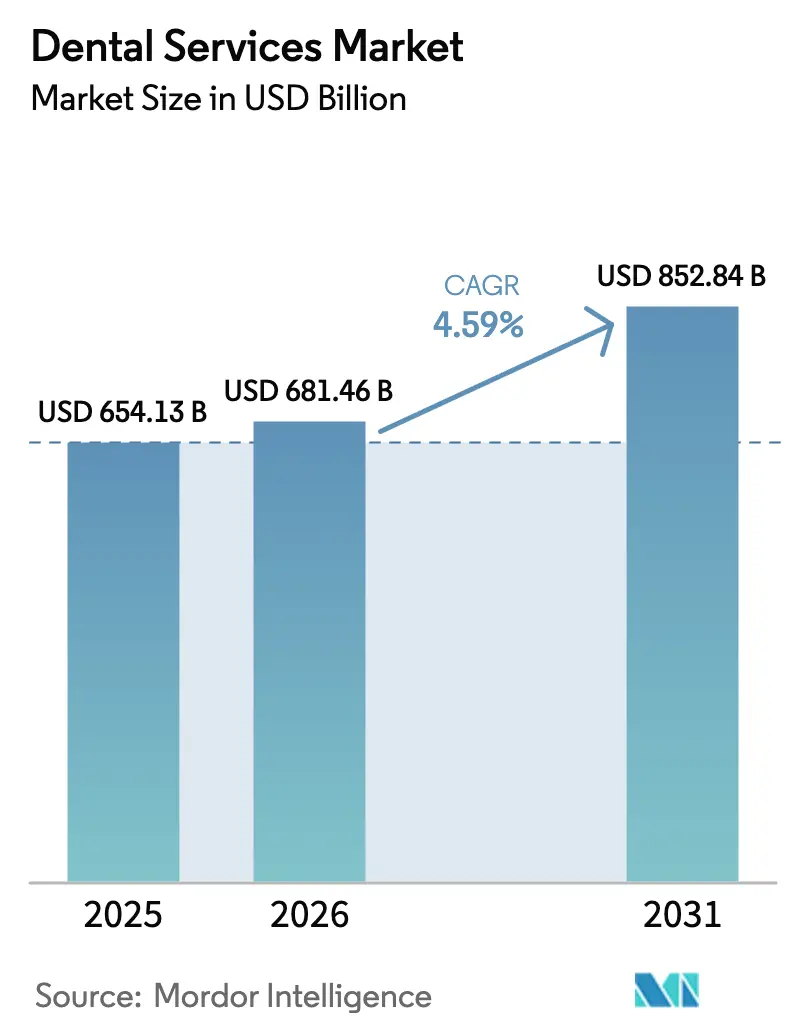
The Dental Services Market size is expected to grow from USD 654.13 billion in 2025 to USD 681.46 billion in 2026 and is forecast to reach USD 852.84 billion by 2031 at 4.59% CAGR over 2026-2031.
Persistent tooth loss among older adults, rapid adoption of fully digital workflows, and the scale advantages of dental service organizations (DSOs) are expanding the global patient base while reshaping practice economics. Aging populations in Japan, Europe, and North America continue to anchor high-value implant and denture demand, even as clear-aligner therapy attracts younger consumers seeking discreet orthodontics. DSOs leverage centralized procurement and AI-guided scheduling to increase chair utilization, but labor shortages among hygienists and assistants limit near-term capacity in many developed markets. Supply-chain volatility for titanium and zirconia, together with rising cyber-insurance premiums, compresses margins for smaller clinics yet reinforces the competitive edge of well-capitalized consolidators.
Key Report Takeaways
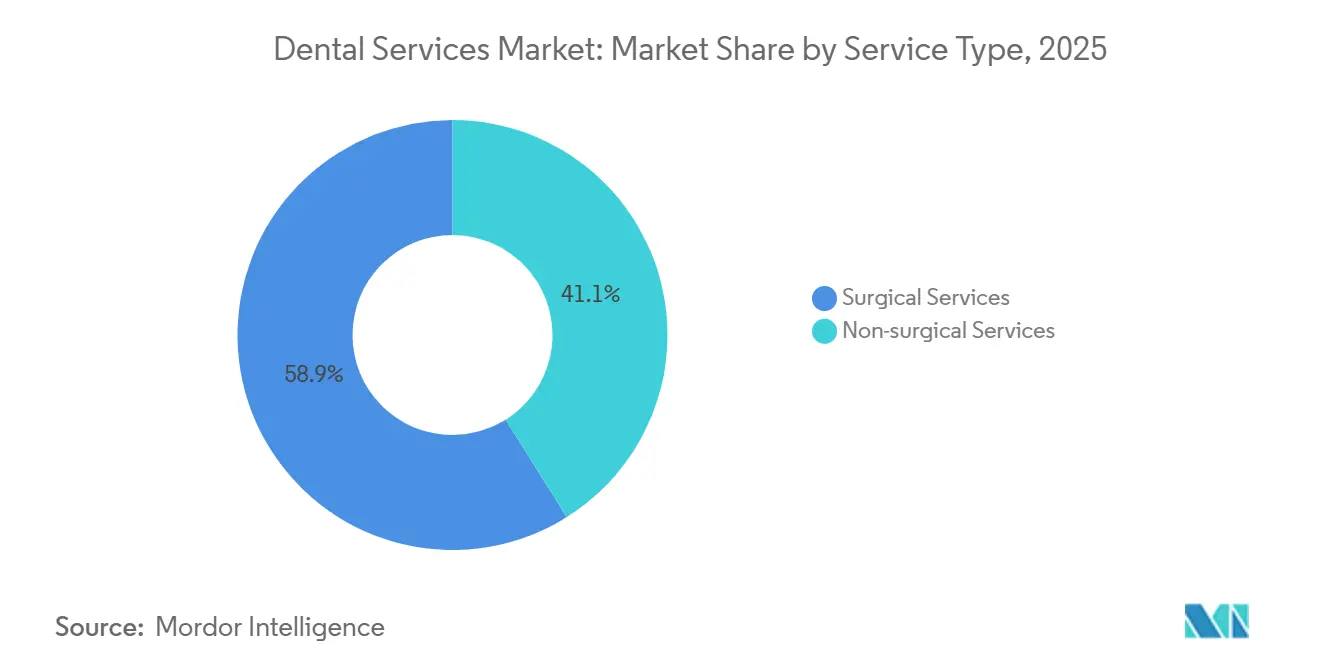
- By service type, surgical services led with 58.92% of the dental services market share in 2025. Non-surgical services are forecast to expand at a 7.06% CAGR through 2031, driven by preventive subscriptions and cosmetic whitening demand.
- By patient age, the above-17-to-60 group accounted for 54.87% of revenue in 2025, while the under-17 segment is set to grow at 9.63% annually to 2031.
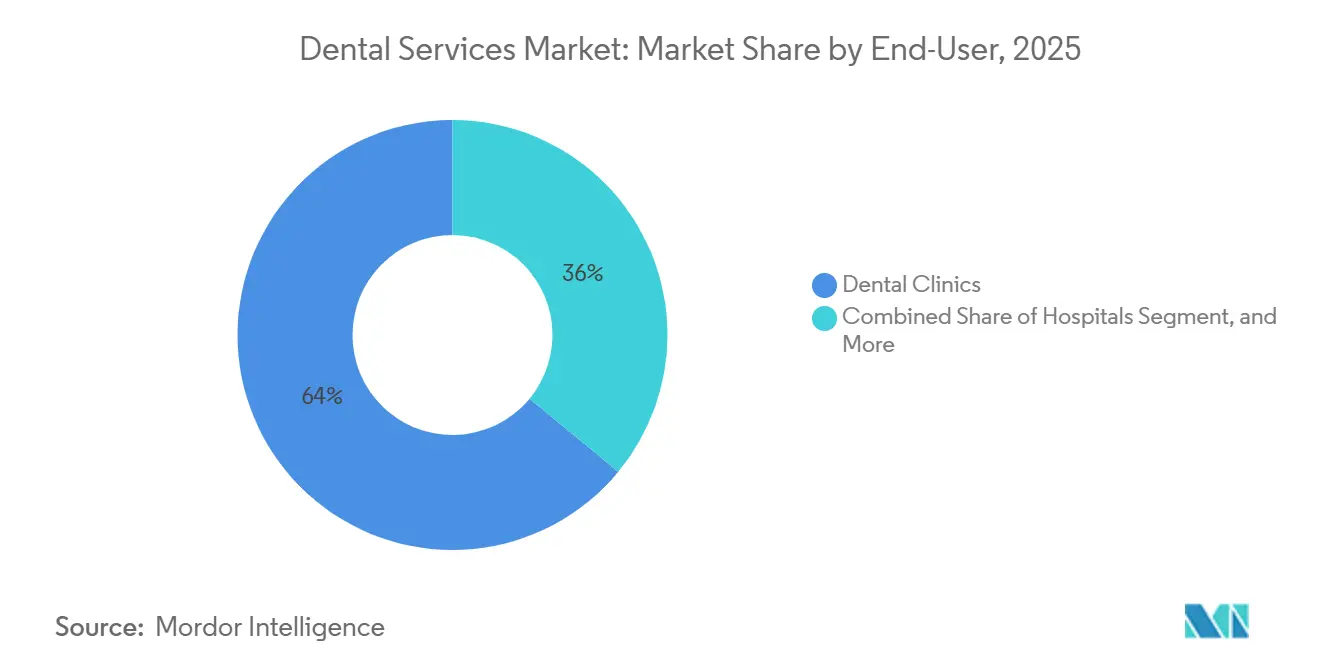
- By end user, dental clinics accounted for 64.02% of the dental services market in 2025 and are advancing at an 8.18% CAGR through 2031.
- By geography, North America held 39.28% of the dental services market share in 2025, whereas Asia-Pacific is projected to post a 10.27% CAGR to 2031.
Note: Market size and forecast figures in this report are generated using Mordor Intelligence’s proprietary estimation framework, updated with the latest available data and insights as of 2026.
Market Trends and Insights
Drivers Impact Analysis of Dental Services Market*
| Driver | (~) % Impact on CAGR Forecast | Geographic Relevance | Impact Timeline |
|---|---|---|---|
| Increasing Prevalence of Dental Disease Rate | +1.2% | Global, higher in emerging markets | Medium term (2-4 years) |
| Aging Population Driving Restorative Procedures | +1.0% | Global, concentrated in developed markets | Long term (≥ 4 years) |
| Growing Demand for Aesthetic & Cosmetic Dentistry | +0.8% | North America & Europe, rising in Asia-Pacific | Short term (≤ 2 years) |
| Increasing Awareness of Dental Health | +0.7% | Global, especially emerging markets | Medium term (2-4 years) |
| Rapid Expansion of Dental Service Organization (DSO) Model | +0.6% | North America, expanding to Europe & APAC | Medium term (2-4 years) |
| AI-Enabled Teledentistry & Preventive Analytics Adoption | +0.5% | Global, led by developed markets | Short term (≤ 2 years) |
| Source: Mordor Intelligence | |||
Aging Population & Tooth-Loss Burden
Global life-expectancy gains are enlarging the pool of patients over 65, a cohort with elevated rates of periodontal disease and edentulism. In Japan, 25% of seniors lacked natural teeth in 2024, spurring steady demand for full-arch restorations. Singapore’s health ministry reported that 60% of residents aged 60-74 had fewer than 20 natural teeth, prompting expanded implant reimbursement. Manufacturers gained U.S. FDA clearance for new zirconia implants formulated for patients with metal allergies in 2024, widening clinical options. Practices integrating geriatric sedation protocols and mini-implant systems are therefore positioned to capture premium restorative revenue.
Growing Demand for Cosmetic & Aesthetic Dentistry
Social-media exposure and ubiquitous video calls heighten patients' focus on smile aesthetics, driving double-digit growth in veneers, bonding, and chairside whitening.[1] The teeth-whitening segment alone generated USD 6.2 billion in 2025 as consumers sought rapid, non-invasive upgrades. Align Technology disclosed that 45% of 2025 clear-aligner starts involved adults over 30, underscoring broadening acceptance of discreet orthodontics. Regulators increasingly police marketing claims; the U.K. General Dental Council mandated evidence-based before-and-after imagery in 2024. Clinics equipped with digital smile-design software and transparent consent protocols are gaining competitive traction.
Expansion of Dental Insurance Coverage & DSOs
Between 2021 and 2025, 23 U.S. states broadened Medicaid adult dental benefits, adding 8.7 million covered lives.[2] DSOs negotiated higher-than-market reimbursement rates by aggregating procedure volume, with Medicaid and CHIP representing 18% of Heartland Dental’s case mix in 2025. Germany’s 2024 decision to subsidize CAD/CAM crowns trimmed patient out-of-pocket costs by EUR 150 per unit and lifted restorative case volume by 14%. Centralized billing and payer diversification, therefore, accelerate share capture for large practice networks.
Growing Adoption of Digital Dentistry
FDA approvals of 47 digital-dentistry devices in 2024, including AI-enhanced detection software and robotic implant systems, validated the technology pipeline. Sales of Dentsply Sirona’s Primescan intraoral scanner jumped 19% in 2025 as same-day crown workflows reached critical mass. 3D-printed denture bases cut production costs by roughly 40%, compressing turnaround from weeks to hours. Multi-site DSOs adopted Pearl AI and Overjet analytics to standardize diagnostics, reducing variability across hundreds of locations. ISO 13485 certification underpins global reimbursement eligibility for digital workflows.
Restraints Impact Analysis of Dental Services Market*
| Restraint | (~) % Impact on CAGR Forecast | Geographic Relevance | Impact Timeline |
|---|---|---|---|
| Limited reimbursement in developing regions | -0.7% | Asia-Pacific, Middle East & Africa, South America | Long term (≥ 4 years) |
| High cost of advanced equipment | -0.5% | Global, sharper in price-sensitive markets | Medium term (2-4 years) |
| Skilled workforce shortages | -0.4% | Global, severe in rural and underserved areas | Medium term (2-4 years) |
| Cyber-security risks in digital platforms | -0.2% | Global, most evident in digitally advanced markets | Short term (≤ 2 years) |
| Source: Mordor Intelligence | |||
Workforce Shortages & Hygienist Burnout
The U.S. faced 16,400 vacant hygienist positions in 2025, a 9% shortfall that forces practices to cap appointment slots.[3] Burnout stems from repetitive-motion injuries and aerosol exposure, with 42% of surveyed hygienists planning to cut hours within five years. The U.K. recorded a 38% three-year attrition rate among dental nurses in 2024. Australia projects a deficit of 2,100 hygienists by 2030 unless training capacity or immigration increases. Wage inflation, U.S. hygienist pay averaged USD 42.50 per hour in 2024, squeezing smaller practices lacking DSO-level purchasing power. DSOs with in-house academies and career-ladder programs retain staff more effectively.
High Out-of-Pocket Costs in Emerging Economies
In India, patients fund roughly 80% of dental spending directly; a single implant priced at INR 25,000-50,000 (USD 300-600) equals one to two months of median urban wages. Indonesia’s BPJS plan covers only extractions and fillings, restricting full-service utilization to just 22% of residents. Long public-clinic queues in Brazil channel middle-income patients to private offices charging BRL 800-1,500 (USD 160-300) for a root canal. Cross-border dental tourism to Thailand and Mexico, where prices run 40-60% lower, drains local revenue but highlights latent demand. Microfinance and installment-payment tools help expand access yet carry elevated default risk.
*Our forecasts treat driver/restraint impacts as directional, not additive. The impact forecasts reflect baseline growth, mix effects, and variable interactions.
Dental Services Market Segment Analysis
By Service Type:
Surgical Revenue Dominance Meets Preventive MomentumSurgical care accounted for 58.92% of 2025 revenue, as implants, orthodontics, and oral surgery command premium fees, while non-surgical segments are slated for a 7.06% CAGR to 2031. Implant costs in North America average USD 3,000-6,000 each, propelled by demand from an aging yet increasingly active population. Clear-aligner uptake continued to swell; 1.8 million of Align Technology’s 4 million 2025 global starts involved adults over 21, reflecting expanded remote-monitoring capabilities. Endodontic and periodontal specialists retain pricing power amid limited provider supply, with urban U.S. root canals priced at USD 1,200-1,800 per tooth.
Preventive dentistry is carving out faster growth. State-mandated sealant programs under Medicaid’s EPSDT benefits lowered caries incidence by 60% in school-age children, encouraging broader payer adoption. Cosmetic demand remains resilient; 71% of elective veneer and whitening patients used third-party financing in 2024, enabling practices to capture higher discretionary spend. Same-day CAD/CAM crowns reduce lab turnaround time from 2 weeks to 2 hours, improving acceptance rates by about 18%. Consistent FDA oversight of new restorative materials sustains patient and payer confidence.

By Patient Age Group:
Pediatric Surge Outpaces Adult StabilityAdults aged 18-60 contributed 54.87% of 2025 revenue, yet the pediatric under-17 segment is projected to post a 9.63% CAGR through 2031. Early-phase orthodontics gained clinical momentum after the American Association of Orthodontists' guidance in 2024, driving a 27% jump in phase-I treatments. School-based care for 4.2 million U.S. children cut emergency-room visits for dental pain by 22%. Subscription pediatric plans attracted 340,000 families by end-2025, reflecting parents’ appetite for budgeting predictability.
Seniors, though lower in volume, deliver outsized revenue via complex prosthetics. Edentulism still afflicts 17% of U.S. adults over 65, sustaining demand for overdentures and fixed restorations. Expanded Medicare Advantage coverage for mini-implants in 2025 shaved patient costs by USD 1,200-2,000 per arch. Practices in retiree hubs such as Florida report that implant-supported overdentures now represent 41% of the case mix.
By End-User:
Clinic-Centric Growth Fueled by DSO EfficiencyDental clinics accounted for 64.02% of the dental services market in 2025 and are forecast to grow at an 8.18% CAGR as DSOs optimize throughput. Heartland Dental clinics averaged 42 daily visits, 18% above the independent average, by deploying AI scheduling. Pacific Dental Services invested USD 120 million in cloud infrastructure, trimming admin overhead 14% across 860 sites. Aspen Dental opened 78 clinics across underserved communities in 2024-2025, coupling Medicaid acceptance with transparent pricing.
Hospitals concentrate on trauma and medically complex cases; only 18% of U.S. hospitals house dental units. Academic institutions enroll 26,874 dental students, yet high tuition fees impede workforce growth. DSOs secure 20-30% procurement discounts on implants and restorative materials versus independents, underpinning margin resilience.
Geography Analysis
North America Dental Services Market
North America retained 39.28% of global revenue in 2025 on the strength of USD 385 per-capita spending and 77% insurance coverage among non-elderly adults. Canadian provinces earmarked CAD 1.2 billion to extend adult dental subsidies, while cross-border flows saw 1.2 million U.S. residents travel to Mexico for lower-cost care.
Europe Dental Services Market
Europe contends with tighter product rules under the EU Medical Device Regulation, which trimmed the CE-marked implant roster by 12% by 2024. Germany’s subsidy for implant-supported crowns cut co-pays by EUR 200-300, adding 9% implant volume. NHS-access challenges pushed 12 million U.K. adults toward private practices, where a single crown costs GBP 800-1,200.
APAC and GCC Dental Services Market
Asia-Pacific is poised for a 10.27% CAGR, led by China and India. China approved 34 homegrown digital devices in 2024, cutting scanner acquisition costs by 25%. India welcomed 500,000 dental tourists in 2024, generating USD 320 million as clinics marketed ISO-certified facilities at deep discounts. The GCC reached a clinic density of 1 per 2,800 residents by 2024, driven by expatriate demand in Dubai.
Mordor Intelligence provides coverage of the dental services market across other key regional markets. Detailed country-level analysis extends to United States incorporating local coverage and market participation, as required.
Regulatory Landscape
Dental services operate under a layered compliance framework that blends licensure, advertising rules, payer terms, and data privacy. In the United States, dental boards govern practice standards while OSHA, CMS, and ongoing HIPAA guidance shape operating risk, with the HIPAA Security Rule NPRM issued in January 2025 still pending finalization as of mid-2026. Regulatory activity in 2026 includes CPOD considerations at the state level and ongoing policy anchors such as the Action for Dental Health Act (H.R. 2001, enacted 2025) reauthorizing HRSA workforce funding through 2030 and the DOC Access Act (H.R. 1521, 2025) addressing health plan contract terms and non-covered services. In July 2026, the California Attorney General reached a settlement with Aspen Dental Management, Inc. that imposes a 36-month independent monitorship and a governance, marketing, and fee-structure compliance roadmap to address corporate practice of dentistry concerns.
Competitive Landscape
The top 10 DSOs held roughly 18% of U.S. practice locations in 2025, indicating moderate fragmentation and room for roll-ups. Heartland Dental surpassed 2,300 affiliated offices, Pacific Dental Services topped 860, and Aspen Dental continued a de novo push into underserved ZIP codes. Aspen’s 2024 acquisition of 12 regional labs signals a vertical-integration trend aimed at controlling prosthetic quality and turnaround. AI vendors Pearl AI, Overjet, and VideaHealth locked in multi-year network deals to supply diagnostic software that narrows clinician variability. Align Technology maintained a moat with more than 3,400 active or pending patents as of December 2025.
Technology remains the decisive differentiator: practices using intraoral scanning and cloud software produced 15-20% higher revenue per operatory than analog peers. Cyber risk escalates alongside digitization; HHS logged 725 healthcare breaches in 2024, prompting cyber liability premiums to jump 25% for clinics lacking multi-factor authentication. Compliance regimes such as HIPAA and GDPR impose fixed costs that larger DSOs spread across larger revenue bases. Cross-border expansion is limited; Q&M Dental Group’s 2025 purchase of an 18-clinic Malaysian chain highlights the licensing and reimbursement complexities of international moves.
Dental Services Industry Leaders
-
Aspen Dental Management, Inc.
-
Dental Care Alliance
-
Great Expressions Dental Centers
-
Pacific Dental Services
-
Smile Brands Inc.
- *Disclaimer: Major Players sorted in no particular order
Dental Services Market Companies Covered in this Report
- Abano Healthcare
- Align Technology (Invisalign)
- Apollo White Dental
- Aspen Dental Management, Inc.
- Bupa Dental Care
- Coast Dental
- Dental Care Alliance
- Great Expressions Dental Centers
- Heartland Dental
- Henry Schein One DSOs
- InterDent
- MB2 Dental Solutions
- MyDentist (IDH Group)
- Pacific Dental Services
- Q & M Dental Group
- Smile Brands Inc.
- SmileDirectClub
- Western Dental Services
Market Opportunities and Future Outlook
White space persists in expanding care access through networked delivery models that centralize procurement, billing, and digital workflows for preventive and non-surgical services. Evidence from 2026 shows Aspen Dental continuing network expansion across multiple states and launching major community outreach through its Healthy Mouth Movement, including a donor commitment of up to USD 100 million in donated care. Capital and regulatory shifts anchor subsequent opportunities: a June 2026 debt-reduction by Dental Care Alliance exceeding USD 1.1 billion and maturity extension to 2031 support continued acquisitions and technology investments across networks, while a 100 percent increase in Section 301 tariffs on dental and medical supplies in 2026 accelerates procurement consolidation and enterprise-wide efficiency programs.
Recent Industry Developments in Dental Services Market
- July 2026: Aspen Dental Management, Inc. announced a five-year commitment to provide up to USD 100 million in donated care and oral health services through its Healthy Mouth Movement, with a signature Day of Service scheduled for November 7, 2026. The initiative expands access-oriented outreach across its nationwide clinic network and reinforces competitive differentiation for DSOs capable of community programs at scale.
- June 2026: Aspen Dental launched the Aligned With Aspen Dental program to support and recognize newly graduated dental hygienists as they enter professional practice. The program standardizes onboarding and accelerates integration across the practice network.
- June 2026: Dental Care Alliance closed a strategic financial transaction reducing total funded debt by more than USD 1.1 billion and extending debt maturities to 2031. The balance-sheet improvement enables continued consolidation and investment in acquisitions, technology, and network expansion.
Dental Services Market Report Scope and Research Methodology
Market Definition and Coverage
For this study, the dental services market includes revenue earned from clinical dental care delivered to patients across settings, covering routine examinations, imaging and diagnostics, preventive care, restorations, endodontics, periodontics, oral surgery, orthodontics, and implants.
Scope exclusions: We exclude the sale of dental products and equipment when those items are not billed as part of a clinical service encounter.
Segments Covered in This Report
- By Service Type
- Non-surgical Services
- Preventive Dentistry
- Restorative Dentistry
- Cosmetic Dentistry
- Surgical Services
- Implants & Oral Surgery
- Orthodontics
- Endodontics & Periodontics
- Non-surgical Services
- By Patient Age Group
- Upto 17
- Above 17 to Upto 60
- Above 60
- By End-User
- Dental Clinics
- Hospitals
- Dental Service Organisations (DSOs)
- Academic & Research Institutes
- By Geography
- North America
- United States
- Canada
- Mexico
- Europe
- Germany
- United Kingdom
- France
- Italy
- Spain
- Rest of Europe
- Asia-Pacific
- China
- Japan
- India
- Australia
- South Korea
- Rest of Asia-Pacific
- Middle East & Africa
- GCC
- South Africa
- Rest of Middle East & Africa
- South America
- Brazil
- Argentina
- Rest of South America
- North America
Data Sources, Market Sizing, and Validation
Desk Research
Desk research was used to map the care pathway and to anchor demand signals that can be checked country by country. We typically refer to sources such as the World Health Organization for oral health burden, the OECD for health spending indicators, and the US Centers for Disease Control and Prevention for utilization and disease surveillance. These inputs help us avoid building the model on assumptions alone.
To translate demand into value, we also review public reimbursement schedules and national health statistics publications in major markets. We use sources such as the American Dental Association for workforce and practice trends. These are complemented with company filings, investor presentations, credible press, and paid subscriptions for company financials and news, plus patent databases to track the pace of clinical technology adoption. The sources listed here are illustrative, and additional references are used for data collection, validation, and clarification during the study.
Primary Interviews and Surveys
Primary work centered on interviews and structured surveys with clinic owners, multi-site operators, dental associations, payers, distributors, and clinicians who could comment on procedure mix and pricing changes. We balanced coverage across mature and emerging markets to confirm how utilization varies, how out-of-pocket spending behaves, and how insurance coverage influences final pricing before locking the assumptions.
Distribution of primary research fieldwork respondents
| Company type | Respondent position | Region |
|---|---|---|
| Top tier: 32% | CXOs: 12% | APAC: 40% |
| Mid tier: 52% | Functional/Unit leaders: 39% | EMEA: 37% |
| Smaller Players: 16% | Managers: 49% | Americas: 23% |
Market-Sizing & Forecasting
Sizing starts with a top-down build where population by age, dentist density, visit rates, and treatment prevalence are used to reconstruct the addressable pool for dental care in each country. Once the activity level is formed, value is created by applying procedure mix and average fee ranges, then adjusted for payer split, inflation, and the share of care delivered across settings.
To keep the model realistic, we corroborate results using selective bottom-up approximations. This includes roll-ups of sampled provider revenues, channel checks on chair capacity and appointment throughput, and spot checks on implants and orthodontics volumes where disclosure is available. Inputs that mattered most for this market included dental caries and periodontal burden, per capita health spending direction, insurance coverage and reimbursement changes, workforce availability, and the shift toward higher-value treatments like implants and aligners.
For forecasting, scenario analysis was used so adoption and pricing could be flexed under a base case, a faster utilization case, and a cost-pressure case. Where bottom-up datapoints were missing for smaller markets, gaps were handled by using peer-country benchmarks for visits per capita and fee ladders, followed by re-checks with local experts.
Data Validation & Update Cycle
Validation was done through multiple checks so that one data series did not over-influence the outcome. We compared modeled spend per capita, procedure volumes per dentist, and implied visit counts with independent utilization and workforce signals, then reviewed outliers until the drivers were understood.
Before sign-off, the work goes through step-by-step analyst review, including currency conversion timing checks and variance checks across adjacent countries and regions. The report is refreshed annually, with interim updates when a material policy change, reimbursement shift, or major demand shock is observed. A final pre-delivery pass is completed so clients receive the most current view.
Mordor Intelligence's Dental Services Market Estimate Compared With Other Published Estimates
Published market sizes for dental services often differ because not everyone counts the same service boundary or uses the same way to translate patient activity into dollars. Differences can also come from the anchor year, how quickly pricing is allowed to move, and whether utilization is validated against workforce capacity.
By checking procedure mix, visit volumes, and fee progression each year, Mordor Intelligence keeps the estimate tied to patient-level service delivery rather than broad healthcare spend proxies that can quietly include non-clinical items.
Benchmark comparison
| Source | Market Size | Gaps in Research Methodology |
|---|---|---|
| Mordor Intelligence | USD 681.46 B (2026) | |
| Industry Statistics Portal A | USD 519.00 B (2024) | Uses an earlier base year and a broad global total without clear alignment to paid clinical encounters, which can understate the impact of recent price inflation and higher implant and orthodontics mix. |
| Trade Wire Summary B | USD 587.95 B (2024) | Leans on a faster growth profile and headline regional splits, but service setting boundaries and the method for converting utilization to value are not clearly spelled out, which can shift totals materially. |
The table shows that the spread is mainly explained by base-year choice and how tightly services are linked to counted patient activity and fees. When scope is kept to billed clinical services and the implied volumes are checked against dentist capacity and utilization signals, the resulting market value is easier to trace and repeat.
Key Questions Answered in the Report
How large will dental-care spending be by 2031?
The dental services market size is forecast to reach USD 852.84 billion by 2031, expanding at a 4.59% CAGR from 2026 to 2031.
Which service line is growing fastest?
Non-surgical preventive and cosmetic services are projected to post a 7.06% CAGR through 2031, outpacing surgical segments that already dominate revenue.
Why are DSOs expanding so quickly?
DSOs leverage centralized procurement, AI-guided scheduling, and insurer negotiations to raise margins and acquire independent clinics efficiently.
What is fueling Asia-Pacific’s growth?
Rising middle-class incomes, universal health care rollouts, and medical tourism demand push Asia-Pacific to a forecast 10.27% CAGR through 2031.
How is digital dentistry changing care delivery?
Intraoral scanning, same-day CAD/CAM crowns, 3D printing, and AI diagnostics shorten treatment cycles and standardize outcomes, lifting revenue per operatory 15-20%.