
Dental Impression Systems Market Size and Share
Market Overview
| Study Period | 2020 - 2031 |
|---|---|
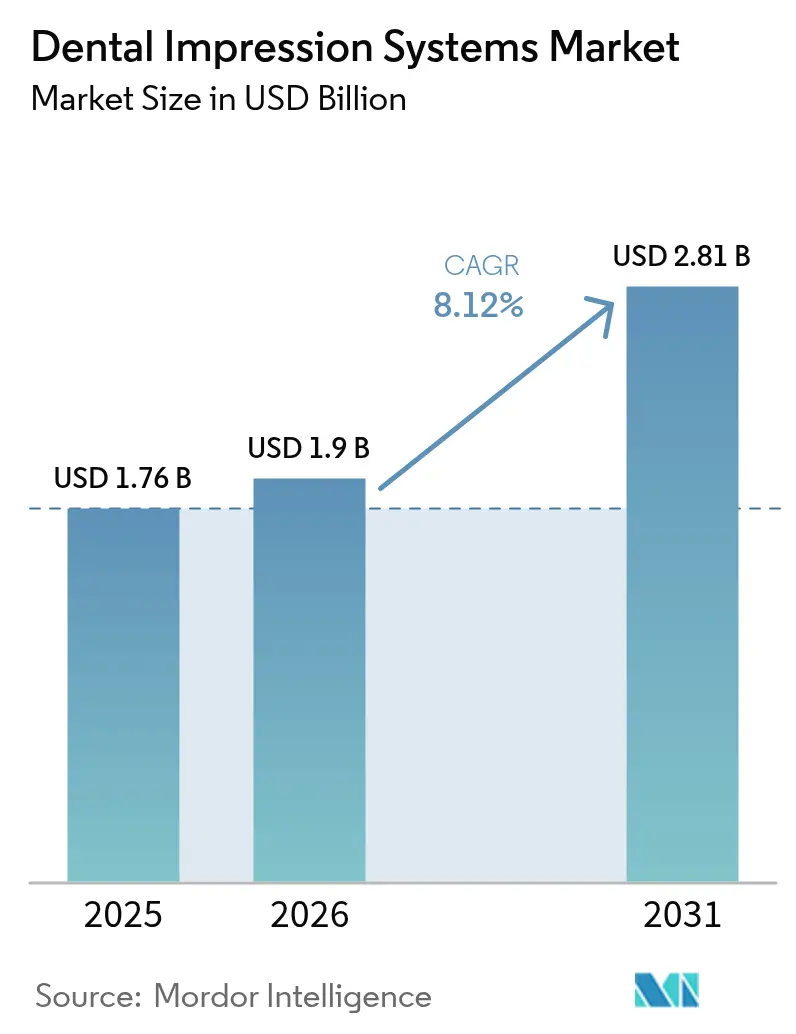
| Market Size (2026) | USD 1.9 Billion |
| Market Size (2031) | USD 2.81 Billion |
| Growth Rate (2026 - 2031) | 8.12 % |
| Fastest Growing Market | Asia-Pacific |
| Largest Market | North America |
| Market Concentration | Medium |
Major Players *Disclaimer: Major Players sorted in no particular order Image © Mordor Intelligence. Reuse requires attribution under CC BY 4.0. | |
Dental Impression Systems Market Analysis by Mordor Intelligence
The dental impression systems market size is expected to grow from USD 1.76 billion in 2025 to USD 1.9 billion in 2026 and is forecast to reach USD 2.81 billion by 2031 at 8.12% CAGR over 2026-2031. Strong migration from elastomeric materials toward digital scanners, expanding aesthetic procedure volumes, and rising oral-disease treatment needs collectively underpin this growth. Early-adopting practices report fewer remakes, shorter chair time, and stronger patient acceptance, advantages that continue to widen the performance gap between conventional and digital techniques. North American insurers now reimburse most digital workflows at parity with conventional impressions, allowing clinics to recover capital investments more quickly. In Asia-Pacific, accelerating demand for basic restorative care combines with growing medical-tourism inflows, prompting clinics to balance cost-sensitive materials with targeted upgrades to entry-level scanners.
Key Report Takeaways
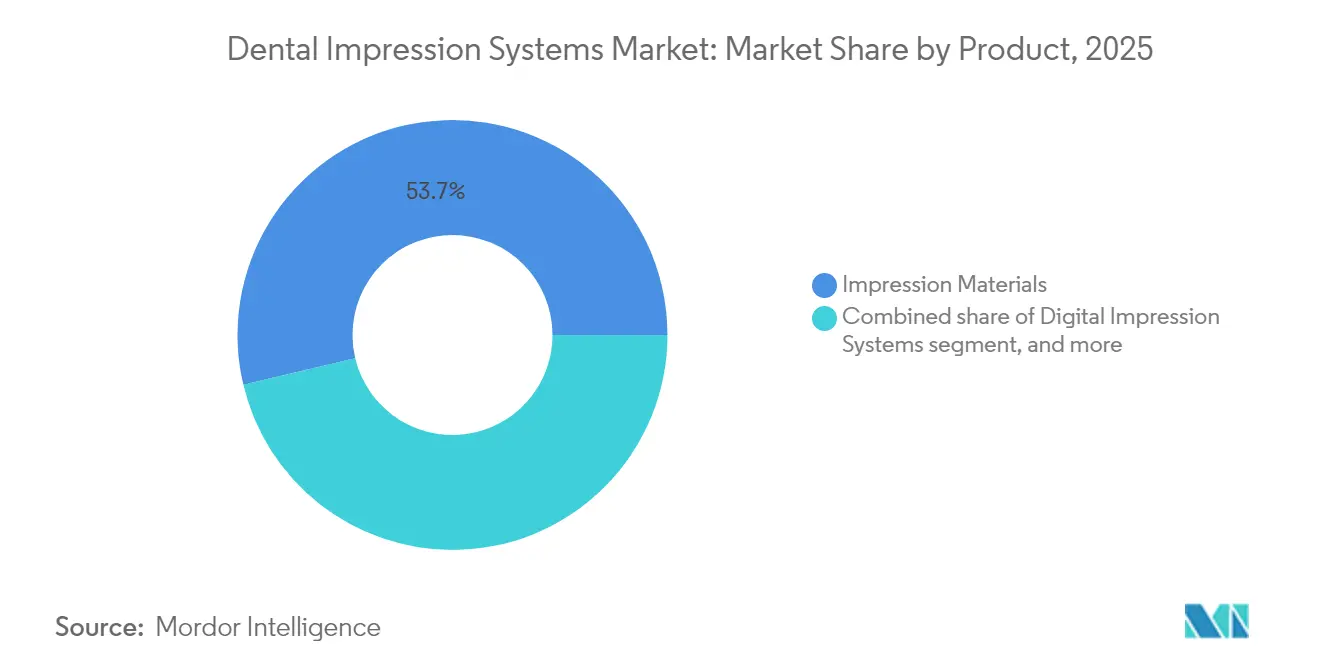
- By product, impression materials led with 53.72% revenue share in 2025; digital systems are projected to expand at a 10.12% CAGR through 2031.
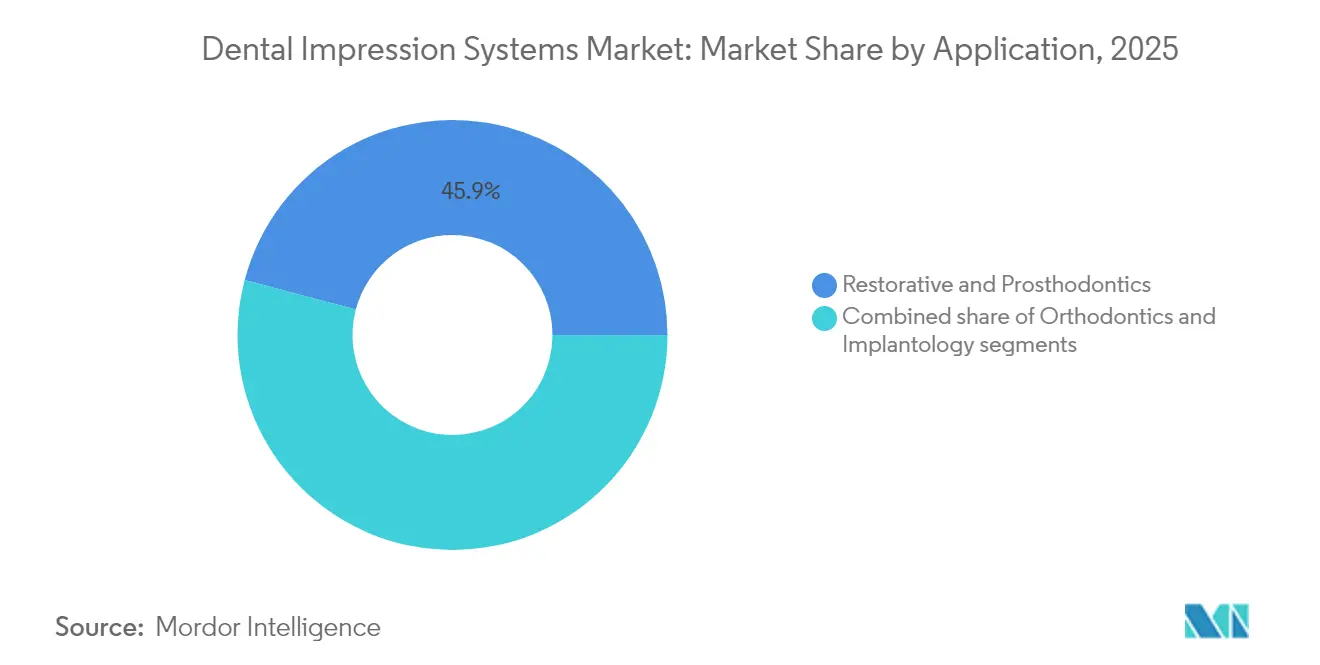
- By application, restorative and prosthodontics accounted for 45.88% of the dental impression systems market share in 2025, while implantology records the highest projected CAGR at 11.28% through 2031.
- By end user, dental clinics held 61.45% of the overall dental impression systems market size in 2025; dental laboratories post the fastest growth at 11.02% CAGR to 2031.
- By geography, North America commanded 34.02% revenue share in 2025, whereas Asia-Pacific advances at a 9.31% CAGR through 2031.
Note: Market size and forecast figures in this report are generated using Mordor Intelligence’s proprietary estimation framework, updated with the latest available data and insights as of 2026.
Global Dental Impression Systems Market Trends and Insights
Drivers Impact Analysis*
| Driver | % Impact on CAGR Forecast | Geographic Relevance | Impact Timeline |
|---|---|---|---|
| Growing adoption of digital dentistry solutions | +1.2% | Global ‒ strongest in North America & Europe | Medium term (2‒4 years) |
| Rising demand for aesthetic dental procedures | +1.8% | Global ‒ concentrated in developed markets | Short term (≤2 years) |
| Increasing global burden of oral diseases | +1.5% | Global ‒ higher impact in Asia-Pacific & Middle East-Africa | Long term (≥4 years) |
| Expansion of dental tourism in emerging markets | +0.8% | Asia-Pacific core, spill-over to Middle East-Africa | Medium term (2‒4 years) |
| Technological advancements in intraoral scanning and 3-D printing | +1.0% | Innovation hubs in North America & Europe | Short term (≤2 years) |
| Shift toward chair-side workflow and same-day restorations | +0.5% | Primarily North America & Europe | Short term (≤2 years) |
| Source: Mordor Intelligence | |||
Growing Adoption of Digital Dentistry Solutions
Widespread evidence now demonstrates that intraoral scanners foster higher-quality restorations while compressing chair time. A 2025 American Dental Association survey shows 53% of U.S. dentists using scanners, and 70% cite efficiency as the main driver[1]. Penetration varies markedly; 3Shape reports a 57% rate in the United States versus far lower uptake in many emerging economies. Ninety-three percent of North American dental schools now embed CAD/CAM modules, but faculty-training bottlenecks remain. Early adopters gain competitive advantages through faster treatment acceptance and lower remake rates, creating network effects that accelerate further scanner purchases.
Rising Demand for Aesthetic Dental Procedures
Consumer preference for natural-looking, same-day restorations has intensified. Survey data reveal that 85% of patients prefer single-visit treatment and 50% will pay a premium for speed[2]. Digital impression systems satisfy these expectations by eliminating elastomeric distortions and enabling precise shade matching, especially critical for anterior ceramics. Aging populations with higher discretionary income further enlarge the aesthetic segment. Minimally invasive preparations also raise technical bars that favor digital over traditional methods.
Increasing Global Burden of Oral Diseases
The World Health Organization reports that 3.5 billion people currently experience untreated oral disease. The burden is greatest in low- and middle-income regions where preventive services remain scarce, raising demand for complex restorative care. Digital scanners aid medically compromised patients who cannot tolerate long impressions, broadening access. As populations age, multi-unit and implant-supported cases increase, reinforcing the need for consistently accurate impressions.
Expansion of Dental Tourism in Emerging Markets
Countries such as Thailand, India, and Mexico attract international patients by pairing cost advantages with modern equipment. Digital impressions facilitate cross-border treatment planning: clinicians can capture data abroad and finalize prostheses at home using standardized STL files. Harmonized device regulations and heightened patient research sophistication further support premium scanner purchases in tourist-destination clinics.
Restraints Impact Analysis*
| Restraints Impact Analysis | (~) % Impact on CAGR Forecast | Geographic Relevance | Impact Timeline |
|---|---|---|---|
| High cost of advanced dental equipment and procedures | −0.9% | Global ‒ most pronounced in emerging markets | Medium term (2‒4 years) |
| Limited insurance coverage and reimbursement challenges | −0.8% | North America & Europe | Long term (≥4 years) |
| Data security and interoperability concerns in digital workflows | −0.6% | Global ‒ heightened in regions with stringent privacy laws | Medium term (2‒4 years) |
| Shortage of skilled professionals for digital impression systems | −0.7% | Global ‒ greater impact in emerging and rural markets | Long term (≥4 years) |
| Source: Mordor Intelligence | |||
High Cost of Advanced Dental Equipment and Procedures
Entry-level scanners such as Medit i700 list between USD 13,000 and USD 21,900, while full chair-side CAD/CAM suites can exceed USD 100,000. These capital commitments deter smaller clinics, especially where per-capita incomes remain low. Ongoing software licenses, maintenance, and staff training widen the cost gap. A 2025 practitioner survey recorded 85% of respondents citing price as the chief obstacle to scanner adoption. Larger dental service organizations (DSOs) can amortize costs across multiple sites, contributing to market-share shifts favoring consolidated networks.
Limited Insurance Coverage and Reimbursement Challenges
Many insurers still reimburse digital and conventional impressions at identical fees, eroding the financial incentive to switch. Coverage gaps for digitally produced dentures or aligners force practitioners to charge higher out-of-pocket fees, slowing uptake among price-sensitive patients. Value-based reimbursement models now in pilot stages may reward superior clinical outcomes in future, but current fee-for-service frameworks limit near-term technology ROI.
*Our forecasts treat driver/restraint impacts as directional, not additive. The impact forecasts reflect baseline growth, mix effects, and variable interactions.
Segment Analysis
By Product: Digital Systems Reshape Traditional Dominance
Impression materials retained 53.72 % revenue share in 2025, underscoring their entrenched use in high-volume, price-sensitive restorative procedures. In emerging economies, elastomeric products remain the default due to low unit costs and universal lab compatibility. Yet digital systems propel the fastest expansion, growing 10.12 % annually as clinics prioritize precision and patient comfort. Consumables linked to scanners—single-use tips, calibration pucks, and annual software subscriptions—create recurring revenue streams that traditional materials cannot replicate. Clinical studies report up to 40 % fewer remakes with digital impressions, strengthening economic rationales for mid- and high-complexity cases.
Second-generation scanners now offer open-architecture STL files, allowing labs to integrate with any CAD platform. This interoperability further erodes material dominance by removing vendor lock-in concerns. Meanwhile, manufacturers of traditional materials respond with biocompatible formulations for specialized scenarios such as implant splinting, seeking to preserve relevance amid the digital shift.

By Application: Implantology Drives Premium Adoption
Implantology records the quickest ascent, registering an 11.28 % CAGR through 2031 as titanium fixture placements climb and case complexity intensifies. Correct three-dimensional alignment demands micron-level accuracy unattainable by many elastomeric techniques, making scanners essential for guided-surgery workflows. Digital impressions shorten implant restorative timelines by 30 % on average, enabling immediate-load protocols that raise both patient satisfaction and clinic throughput. Restorative and prosthodontic treatments continue to represent 45.88 % of revenue, buoyed by sheer procedural volume; yet digital penetration remains mixed because single-unit posterior crowns often tolerate slightly looser fits.
Orthodontics, now firmly aligned with clear-aligner therapy, enjoys near-universal digital workflows in developed markets. Scanner data feed cloud-based treatment-planning engines, cutting laboratory lead-times from weeks to days. Even conventional bracket cases employ digital models for indirect bonding trays, showing that once a clinic purchases a scanner for aligners, it invariably extends use to adjacent treatments.
By End User: Laboratory Centralization Accelerates Growth
Dental laboratories post the fastest CAGR at 11.02 % as CAD/CAM milling centers capitalize on economies of scale. Scanners captured in clinics travel digitally to labs, where automated nesting and milling optimize material yield. In contrast, clinics maintain the largest 61.45 % share because most impressions originate chair-side. Hospitals and universities, though smaller customers, act as technology incubators, setting protocols that private practice ultimately adopts. Cloud-based design portals now allow labs to deliver iterative design adjustments within hours, reinforcing centralized production advantages.
In developed regions, DSOs channel impression purchases through preferred suppliers, negotiating volume discounts that further shift workflows to centralized hubs. Emerging markets still rely heavily on chair-side elastomeric impressions, yet rising digital literacy and dropping scanner prices foresee rapid laboratory-centric transitions.
Geography Analysis
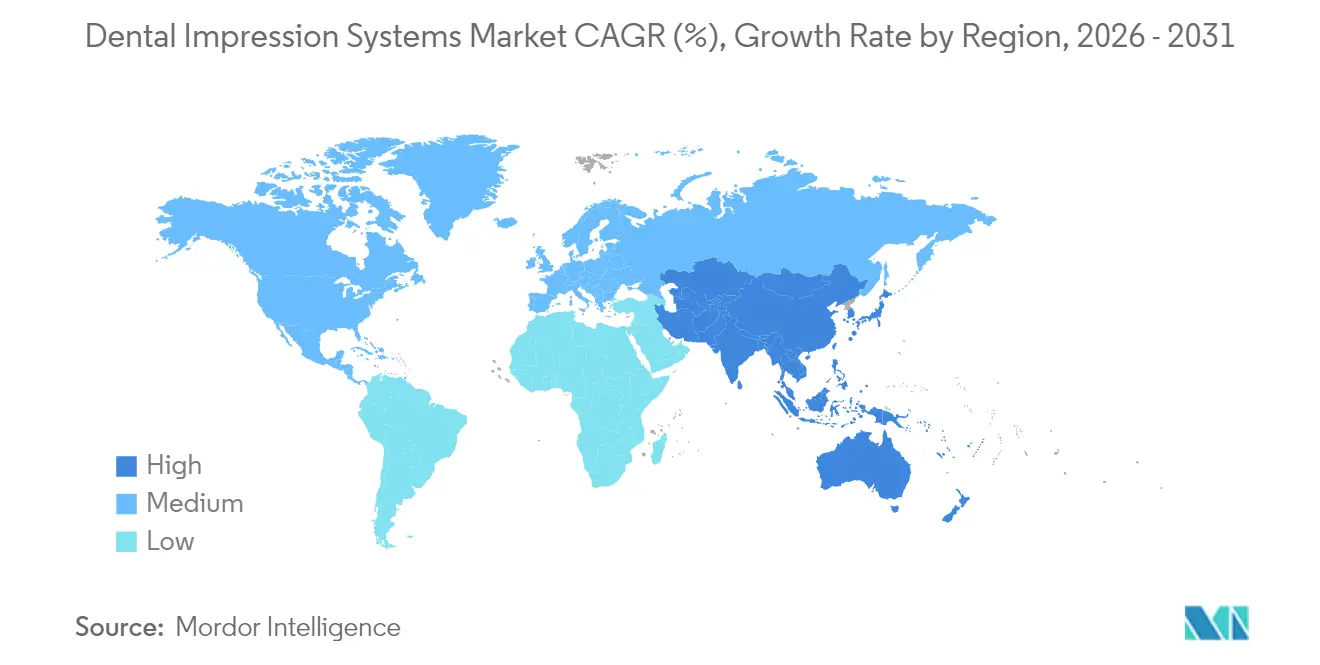
North America commands 34.02 % of 2025 revenue, underpinned by robust insurance coverage, high disposable incomes, and early technological adoption. Clear regulatory pathways via FDA 510(k) clearances foster predictable market entry. However, competitive pressure from DSOs drives equipment suppliers to sharpen pricing and bundle scanners with practice-management software to preserve margins.
Asia-Pacific is the fastest-growing region, expanding at 9.31 % CAGR. Urban middle-class populations seek higher-quality restorations, while Thailand and India attract international dental tourists who expect modern equipment. China leads absolute growth as domestic manufacturers introduce cost-optimized scanners customized for local price points.
Europe shows steady expansion on the back of comprehensive public dental coverage and standardized device regulations. Germany and the Nordic countries exhibit some of the world’s highest per-dentist scanner ratios. Harmonized MDR rules streamline cross-border equipment flows, benefiting pan-European lab networks.
Middle East-Africa and South America remain nascent yet promising. Government-funded oral-health programs in Saudi Arabia and Brazil now emphasize digital training, laying groundwork for future scanner procurement. Cost remains a barrier, yet local distributors increasingly offer leasing models that align payments with case volumes.
Regulatory Landscape
In the United States, dental impression materials, including elastomeric bite registration materials, are regulated by the FDA as Class II devices under 21 CFR 872.3660 (Product Code ELW). Market access is typically secured through the 510(k) pathway. A recent example is DiaDent Group International receiving FDA 510(k) clearance for its Dia-X Sil Bite (K254112) in March 2026, which underscores the need for documented performance and alignment with the stated intended use for conventional impression materials.
In Europe, dental impression materials fall under EU MDR 2017/745, where classification is typically Class I under Annex VIII rules, with movement to higher class in specific use scenarios. On standards, ISO 4823:2025 (Dentistry, elastomeric impression and bite registration materials) was published in June 2025, and DIN EN ISO 4823 was released as the German national adoption in July 2026, tightening expectations for dimensional stability and consistency claims across markets.
Competitive Landscape
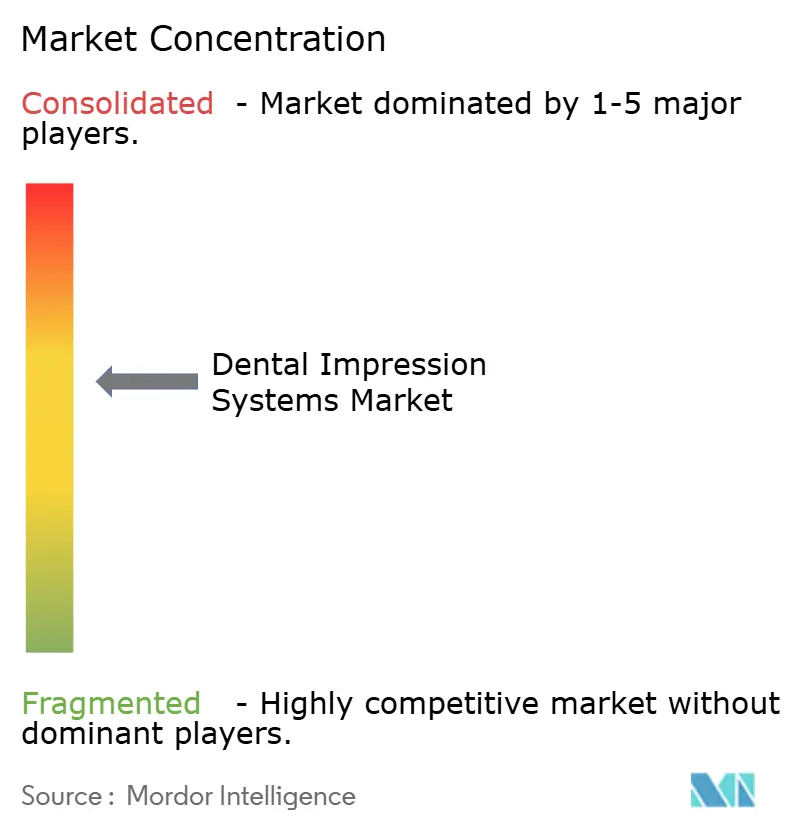
The dental impression systems market displays moderate fragmentation: global multinationals face nimble digital-first challengers. Dentsply Sirona, 3Shape, Align Technology, and Planmeca compete on comprehensive ecosystems linking scanners to design and milling. AI integration is emerging as the decisive differentiator; 3Shape’s 2025 TRIOS upgrade added automated caries detection, creating value beyond impression capture. Cost-effective regional players such as Medit gain share in Asia-Pacific by pricing scanners below USD 15,000 while offering open-file formats.
DSO consolidation reshapes procurement. The top 20 North American DSOs already account for nearly half of all scanner placements. Vendors that embed subscription analytics, technician training, and cloud storage into long-term contracts achieve sticky revenues. Intellectual-property barriers remain high: core scanning algorithms and optical-path designs enjoy active patent protection through 2030-2035, limiting commodification risks.
Software remains the battleground where vendors cultivate lock-in. Open-architecture proponents argue that file portability empowers clinicians, while closed-loop providers stress validated workflows and regulatory compliance. Strategic alliances—such as Planmeca’s partnership with myOrthos—illustrate the trend toward vertical integration, where hardware manufacturers link directly with specialized therapy platforms.
Dental Impression Systems Industry Leaders
-
Dentsply Sirona
-
3M
-
Ivoclar Vivadent
-
Danaher (Kerr)
-
3Shape A/S
- *Disclaimer: Major Players sorted in no particular order
Market Opportunities and Future Outlook
Hybrid clinical workflows create a clearer split in demand, with digital scanning expanding while conventional materials still hold ground in demanding applications, including full-arch and subgingival work. The evidence base shows that 39% of laboratory cases arrive as digital scans, while 61% still rely on physical impressions for certain applications. This pattern supports ongoing demand for high-performance elastomeric materials alongside digital penetration that reached about 60% in the United States and Northern Europe as of 2026.
Regulatory and standards updates also create room for tighter differentiation across product launches and quicker iteration cycles. The FDA issued final guidance in September 2024 for dental impression materials under the Safety and Performance Based Pathway, and ISO 4823:2025 provides an updated reference point for dimensional stability requirements. Combined with vendor roadmaps that add AI capabilities to scanners, such as diagnostic and automation features tied to TRIOS workflows, this environment supports strategies that bundle impression capture, diagnostics, and interoperable file export into clinic-to-lab ecosystems. It also highlights supplier opportunities to streamline compliance documentation across the United States and EU MDR regimes.
Recent Industry Developments
- April 2026: 3Shape received US FDA 510(k) clearance for 3Shape Dx software (Dx Plus and Dx Standard) to assist in detecting oral health conditions when used with TRIOS 6 scans. The clearance adds a regulated diagnostic layer to intraoral scanning workflows, reinforcing the role of scanner platforms as clinical decision-support tools beyond impression capture.
- February 2026: 3Shape released AI-powered workflow updates in the 3Shape Dental System 2025 for dental labs, including AI bite alignment and automated tooth outlining. The update targets lab throughput and consistency, reinforcing the value of integrated scanner-to-design software ecosystems for laboratories scaling digital case volumes.
- July 2025: Novenda Technologies secured USD 6.1 million in funding to advance 3D printing for dental products. The investment supports downstream digital manufacturing capacity that complements intraoral scanning adoption by expanding options for faster production of restorations and dental components from digital impressions.
Research Methodology Framework and Report Scope
Market Definition and Coverage
This market covers tools and materials used to capture a negative or digital replica of a patient's teeth and gums for orthodontic and restorative workflows. It includes traditional impression materials as well as intraoral scanning systems sold into dental clinics and labs.
Scope exclusions: Downstream restorative manufacturing and orthodontic treatment delivery services are excluded, along with general dental imaging systems that are not used for impression capture.
Segmentation Overview
- By Product
- Impression Materials
- Digital Impression Systems (Intra-/Extra-Oral Scanners)
- Accessories & Consumables
- By Application
- Restorative & Prosthodontics
- Orthodontics
- Implantology
- By End User
- Dental Clinics
- Hospitals
- Dental Laboratories
- Academic & Research Institutes
- Geography
- North America
- United States
- Canada
- Mexico
- Europe
- Germany
- United Kingdom
- France
- Italy
- Spain
- Rest of Europe
- Asia-Pacific
- China
- Japan
- India
- Australia
- South Korea
- Rest of Asia-Pacific
- Middle East & Africa
- GCC
- South Africa
- Rest of Middle East & Africa
- South America
- Brazil
- Argentina
- Rest of South America
- North America
Data Sources, Market Sizing, and Validation
Desk Research
Desk research helped us build the initial market map and decide what should be counted as impression capture versus adjacent dental equipment. We relied on public sources such as the US FDA device listings and safety notices, CDC oral health statistics, WHO oral health fact sheets, and OECD health system indicators to understand procedure demand signals and care-delivery capacity.
To ground the revenue model, we reviewed company annual reports, investor presentations, product catalogs, and reputable press coverage on scanner launches and material upgrades. Where useful, we checked patent databases to spot technology shifts (for example powder-free optics and faster scan processing), and we used a paid subscription for company financials and news to confirm business line exposure. These sources are illustrative, and additional public references were also used for data collection, validation, and clarification during the study.
Primary Interviews and Surveys
Primary interviews and surveys were used to test pricing and adoption assumptions that are not captured cleanly in public sources, particularly the shift from conventional materials to intraoral scanners by practice type. We spoke with manufacturers, distributors, dental labs, and clinic-side users across the Americas, EMEA, and APAC to fill gaps in secondary data, then we checked what respondents reported against observed purchasing behavior.
Distribution of primary research fieldwork respondents
| Company type | Respondent position | Region |
|---|---|---|
| Top tier: 30% | CXOs: 12% | APAC: 42% |
| Mid tier: 49% | Functional/Unit leaders: 36% | EMEA: 35% |
| Smaller Players: 21% | Managers: 52% | Americas: 23% |
Market-Sizing & Forecasting
Sizing starts with a top-down build that links dental procedure activity and care-delivery capacity to the likely demand pool for impressions. We then convert that pool into annual system and material revenues using adoption and replacement logic. Our team used repeatable inputs such as the volume mix of restorative and prosthodontic work versus orthodontics, the share of cases captured digitally, intraoral scanner installed base and refresh cycles, average selling prices for scanners, and usage rates for key impression materials per case.
We also used selective bottom-up approximations to corroborate totals, mainly through supplier revenue splits, channel checks on scanner shipments, and sampled ASP times unit volumes by region. Where certain smaller-country splits could not be supported by consistent signals, we allocated from regional totals using dental clinic density and procedure mix indicators, and then rechecked assumptions using interview feedback.
Forecasting used scenario analysis, since scanner adoption and pricing often move with practice investment cycles and reimbursement realities. The forward view was built from variable-level expectations shared by interviewees, including digital conversion pace, scanner price progression, material substitution trends, and regional growth in dental visits, with short sanity checks against historical smoothing to reduce abrupt step changes.
Data Validation & Update Cycle
Validation runs through several passes. Modeled outputs are compared with independent signals such as scanner installed base discussions, distributor stocking behavior, and published dental utilization trends. If a country or product line shows an unusual jump, we reopen the assumptions, rerun the calculations, and make targeted callbacks to confirm whether the change is real or caused by an input issue.
Before sign-off, the full model is reviewed by another analyst to catch unit mismatches, currency timing issues, and double counting between materials and devices. Reports are refreshed annually, and interim updates are made when material events occur (for example major pricing changes, product recalls, or policy shifts). Right before delivery, we do a final scan of recent developments so the published numbers reflect the latest evidence available.
Mordor Intelligence's Dental Impression Systems Market Size Compared Against Other Published Estimates
Published market sizes for dental impression systems do not always match because the counted product basket and year labeling can differ, and the underlying pricing and adoption assumptions can also diverge. We focus on what is included as an impression system, which end users are counted, and how quickly digital scanning is assumed to replace conventional materials.
Some external estimates expand the scope to include extra consumables like adhesives and bite registration materials, which can lift the total even when scanner adoption is modeled conservatively. Mordor Intelligence counts impression materials, intraoral scanners, and closely related impression products, and it keeps totals tied to application-level demand in orthodontics and restorative workflows, using region-wise ASP checks and an annual refresh discipline.
Benchmark comparison
| Source | Market Size | Gaps in Research Methodology |
|---|---|---|
| Mordor Intelligence | USD 1.90 B (2026) | |
| Trade Publisher A | USD 1.62 B (2024) | Uses an earlier base year and a broader consumables basket in parts of the definition, which changes the mix and then reduces comparability to a 2026 current-year view. |
| Industry Analytics Firm B | USD 1.87 B (2025) | Anchors the number to a 2025 base and applies faster growth expectations, with less transparent checks on scanner ASP declines and material substitution rates by region. |
The spread in published numbers is mainly explained by base-year choice and whether adjacent consumables are bundled into the same bucket as scanners and core materials. By keeping inputs traceable to procedure mix, digital conversion rates, and repeatable price-volume checks, our estimate is easier to reconcile across regions and over time.
Key Questions Answered in the Report
What is the current valuation of the dental impression systems market?
The dental impression systems market size is USD 1.9 billion in 2026.
How fast is the market expected to grow?
The market is projected to register an 8.12% CAGR and reach USD 2.81 billion by 2031.
Which product segment is expanding most rapidly?
Digital impression systems record the fastest growth, advancing at a 10.12% CAGR between 2026 and 2031.
Why is implantology driving scanner adoption?
Implant procedures need micron-level accuracy, and digital impressions cut treatment times by 30% while improving prosthetic fit.
Which region will add the most new revenue?
Asia-Pacific posts the highest regional CAGR at 9.31%, propelled by rising middle-class demand and dental-tourism inflows.
What key barrier inhibits scanner purchases?
High upfront equipment costs—scanners from USD 13,000 to USD 21,900 and complete chair-side suites above USD 100,000—remain the main deterrent for smaller practices.