
Dental Consumables Market Size and Share
Market Overview
| Study Period | 2020 - 2031 |
|---|---|
| Market Size (2026) | USD 43.26 Billion |
| Market Size (2031) | USD 64.12 Billion |
| Growth Rate (2026 - 2031) | 8.18 % |
| Fastest Growing Market | Asia-Pacific |
| Largest Market | North America |
| Market Concentration | Medium |
Major Players *Disclaimer: Major Players sorted in no particular order Image © Mordor Intelligence. Reuse requires attribution under CC BY 4.0. | |
Dental Consumables Market Analysis by Mordor Intelligence
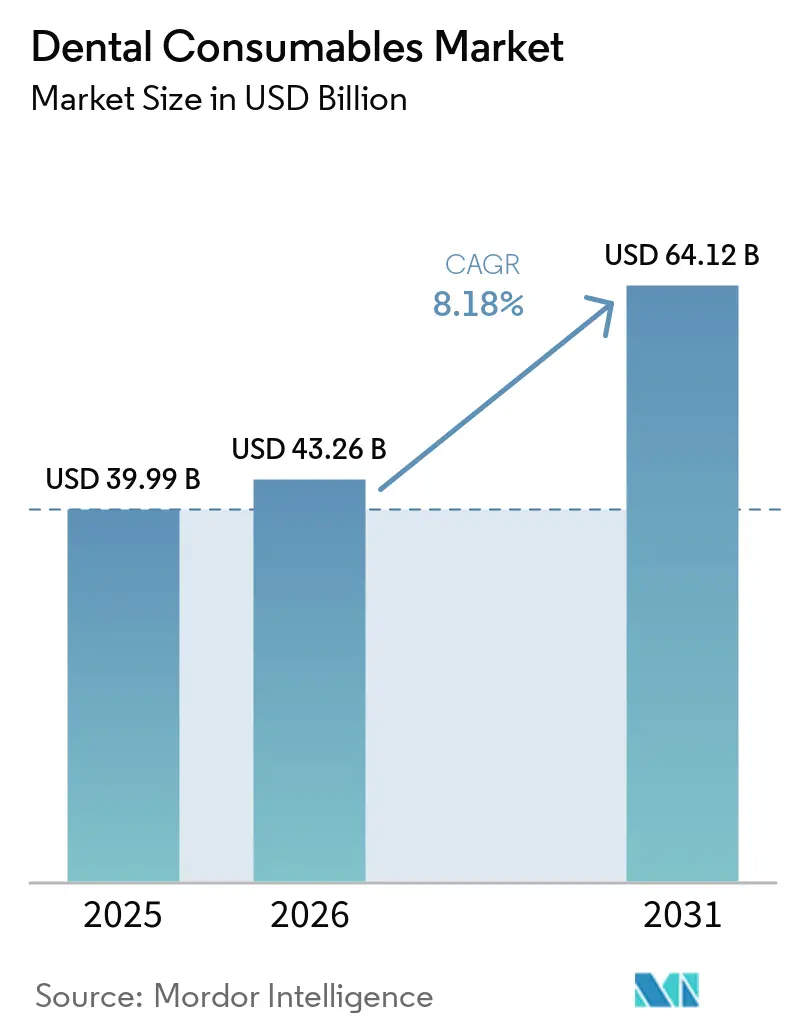
The dental consumables market size was valued at USD 39.99 billion in 2025 and estimated to grow from USD 43.26 billion in 2026 to reach USD 64.12 billion by 2031, at a CAGR of 8.18% during the forecast period (2026-2031). Steady gains stem from digital chairside workflows, bioactive implant materials, and bulk-procurement models that shift volumes toward premium product lines. DSOs are scaling rapidly, influencing procurement standards, while North America remains the revenue leader even as Asia-Pacific posts the fastest regional advance. Demand for same-day restorations, preventive sealants, and regenerative materials collectively elevate per-patient spending and favors suppliers with integrated digital ecosystems.
Key Report Takeaways
- By product type, dental implants held 18.10% of dental consumables market share in 2025; personal protective wear is projected to grow at a 9.74% CAGR to 2031.
- By treatment modality, prosthodontic procedures commanded 27.35% share of the dental consumables market size in 2025, while orthodontics is expected to expand at 9.42% CAGR through 2031.
- By distribution channel, offline B2B transactions accounted for 86.90% of the dental consumables market size in 2025; the online channel is advancing at a 9.66% CAGR to 2031.
- By end-user, dental clinics captured 52.55% of dental consumables market share in 2025 as DSO/group practices exhibit the highest forecast CAGR of 9.52% through 2031.
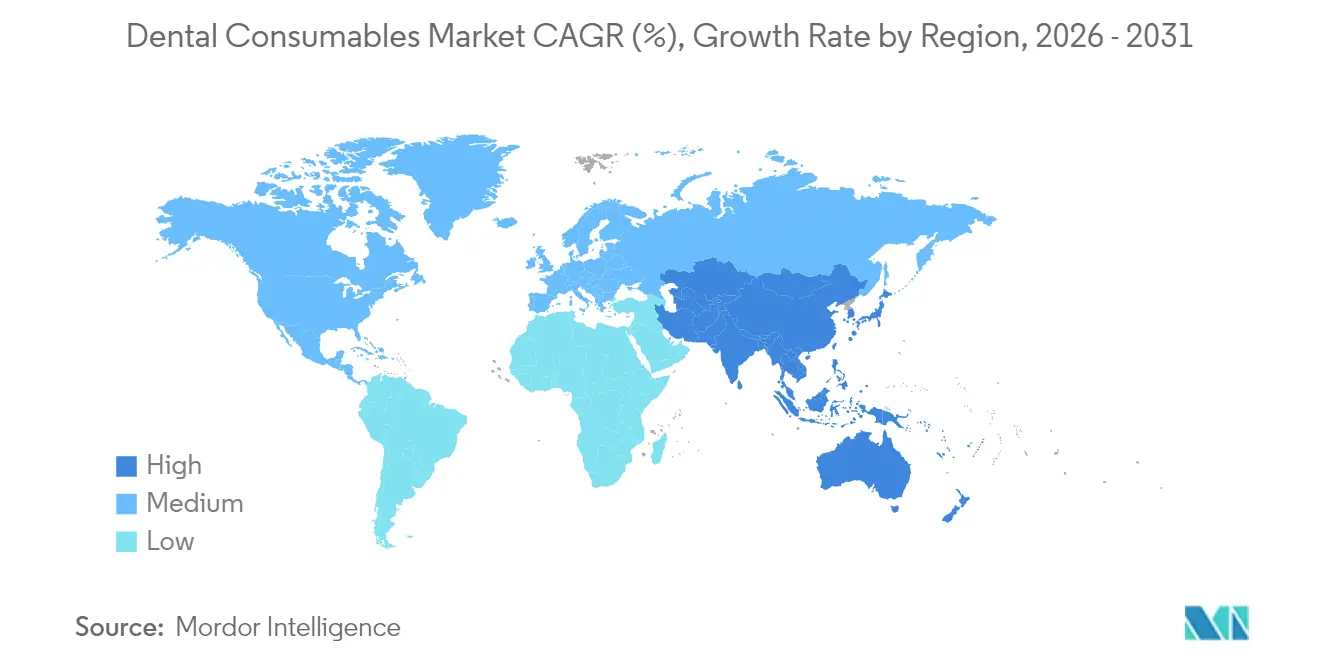
- By geography, North America led with 42.95% revenue share in 2025; Asia Pacific is projected to post the fastest 9.22% CAGR between 2026-2031.
Note: Market size and forecast figures in this report are generated using Mordor Intelligence’s proprietary estimation framework, updated with the latest available data and insights as of 2026.
Market Trends and Insights
Drivers Impact Analysis of Dental Consumables Market*
| Drivers | (~) % Impact on CAGR Forecast | Geographic Relevance | Impact Timeline |
|---|---|---|---|
| Rising demand for same-day CAD/CAM prosthetics | +1.8% | North America, Europe, Urban APAC | Medium term (2-4 years) |
| Elderly population growth increasing prosthodontic procedures | +1.6% | Japan, Europe, North America | Long term (≥ 4 years) |
| Expansion of DSOs driving bulk procurement | +1.5% | North America, expanding to Europe & APAC | Medium term (2-4 years) |
| Rapid adoption of clear-aligner orthodontics | +1.4% | Global, highest penetration in North America | Medium term (2-4 years) |
| Shift toward bioactive and regenerative implant materials | +1.2% | Global, early adoption in North America & Europe | Long term (≥ 4 years) |
| Preventive-oral care campaigns boosting sealant use | +0.8% | Developing markets | Short term (≤ 2 years) |
| Source: Mordor Intelligence | |||
Rising demand for same-day CAD/CAM prosthetics
More than half of U.S. dental practices already employ intraoral scanners, shortening treatment cycles and expanding indications for premium restorative materials. Chairside milling paired with cloud design services lowers laboratory overhead and lifts profitability. AI-enabled design modules automate complex margin and contact adjustments, further reducing chairtime. Adoption accelerated by 18% in 2024, and with scanner integration set to improve imaging precision in 2025, material throughput is expected to rise in tandem. Suppliers capable of bundling scanners, mills, and validated material blocks are securing long-term contracts with DSOs.
Elderly population expansion increasing prosthodontic procedures
Adults aged 65 plus represent the fastest-growing patient cohort. Japan already allocates specialized reimbursement pathways for implant-supported overdentures, and the EU’s Silver Economy program earmarks funds for geriatric dental care. Digital denture workflows reduce appointment burden, improving acceptance among seniors with mobility constraints. Material suppliers are commercializing lightweight polymer bases and high-impact acrylics[1] tailored to xerostomia-prone patients.
Growth of dental service organizations (DSOs) driving bulk procurement
DSOs are growing at 9.88% annually, consolidating practice ownership and centralizing purchasing decisions. Scale permits favorable long-term supply agreements that bundle implants, restorative kits, and chairside scanners. U.S. legal firm Dykema projects DSO penetration could reach 30% of all practices by 2030[2], reshaping manufacturer–provider negotiations toward integrated value propositions.
Shift toward bioactive and regenerative implant materials
Clinical evidence shows that carbon-based bioactive coatings improve osseointegration and reduce bacterial adhesion, allowing implants to integrate in compromised bone. As outcome data accumulates, practitioners favor higher-priced surfaces that cut revision risk, expanding the total implantable base. Manufacturers are adding proprietary bioactive topologies to differentiate, and European regulators have cleared the first generation of carbon-coated titanium fixtures[3] for broad release in 2025.
Restraints Impact Analysis of Dental Consumables Market*
| Restraint | (~) % Impact on CAGR Forecast | Geographic Relevance | Impact Timeline |
|---|---|---|---|
| Limited insurance reimbursement for cosmetic dentistry | -1.2% | North America, Europe | Medium term (2-4 years) |
| Skills gap in chairside CAD/CAM workflows | -0.9% | Emerging markets | Medium term (2-4 years) |
| Volatile resin and precious-metal prices | -0.7% | Global, higher impact in developing markets | Short term (≤ 2 years) |
| Regulatory delays for novel bio-ceramic approvals | -0.6% | North America, Europe | Long term (≥ 4 years) |
| Source: Mordor Intelligence | |||
Limited insurance reimbursement for cosmetic dentistry
Aesthetic veneers, bleaching, and gingival contouring remain predominantly self-pay. While Medicare will extend coverage to certain medically-linked dental procedures in 2025, elective cosmetic benefits remain constrained. This bifurcates the market, sustaining luxury segments yet limiting total unit volumes. Manufacturers counteract by offering tiered composite lines that balance price and polish retention.
Skills gap in chair-side CAD/CAM workflows
Transitioning from conventional impressions to intraoral scanners demands technician training unavailable in smaller practices. Emerging markets see slower technology uptake due to limited continuing-education budgets. Industry associations are funding modular e-learning, but a persistent proficiency gap tempers scanner shipments in low-resource settings.
*Our forecasts treat driver/restraint impacts as directional, not additive. The impact forecasts reflect baseline growth, mix effects, and variable interactions.
Dental Consumables Market Segment Analysis
By Product Type:
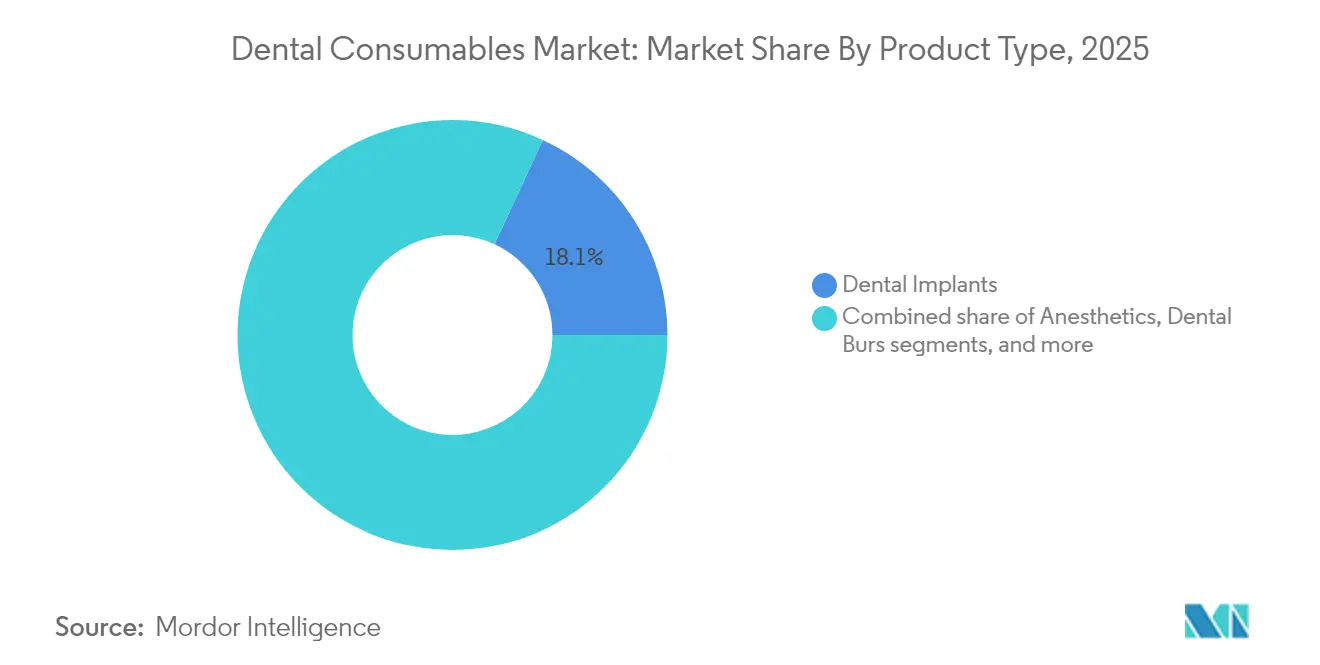
Premium Implants Anchor Revenue GrowthDental implants accounted for 18.10% of the dental consumables market share in 2025. High-success bioactive coatings and digital surgical planning expand indications into softer bone situations. The dental consumables market size for personal protective wear is forecast to climb at 9.74% CAGR to 2031, notably buoyed by Asia Pacific’s geriatric cohorts. The segment's sharp trajectory is further propelled by infection-control protocols that demand ASTM-certified respirators and autoclavable eye shields.
The prosthetics sub-segment benefits from CAD/CAM workflows that fabricate zirconia and lithium-disilicate crowns in under one hour. Universal bonding agents streamline inventory by covering multiple etching strategies. Regenerative materials such as calcium-phosphate granules grow in tandem with ridge-augmentation procedures. Meanwhile, sutures and dental burs, although mature, enjoy marginal gains from ergonomic handle redesigns that reduce operator fatigue.

By Treatment Modality:
Digital Workflows Redefine Clinical PracticeProsthodontic procedures accounted for 27.35% share of the dental consumables market in 2025 as full-arch rehabilitation moves chairside through guided surgery and immediate loading. Orthodontics, driven by clear aligners, records the highest modality growth of 9.42%; cloud-planning software and in-house 3-D printed aligners reduce cycle time and boost case starts.
Restorative dentistry embraces minimally invasive preps using bioactive composites that release fluoride and calcium ions, prolonging restoration life. Endodontics innovates with bioceramic sealers and reciprocation-motion files that cut procedure time. Periodontics integrates regenerative membranes and enamel-matrix derivatives that encourage new attachment. Cosmetic procedures, although self-funded, gain momentum via social media exposure and rising tele-consultation convenience.
By Distribution Channel:
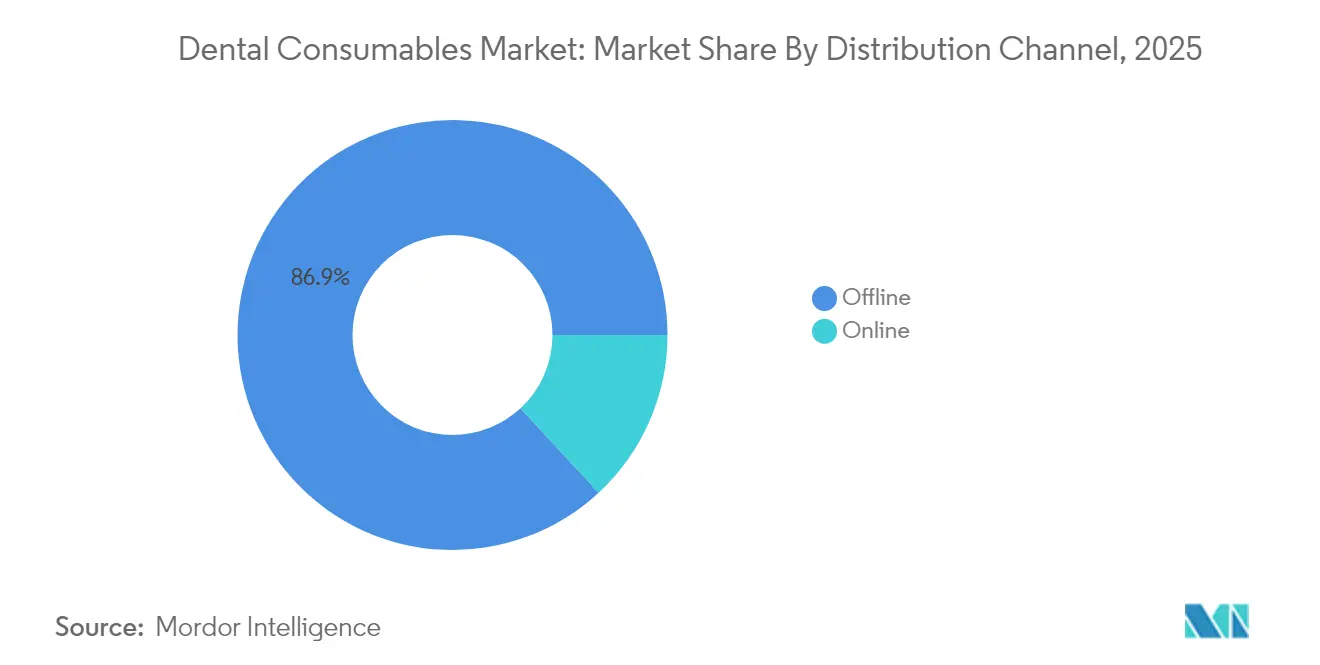
E-Commerce Captures Routine Re-ordersOffline distributors still command 86.90% of 2025 revenue by bundling consumables, equipment financing, and technical service. However, the dental consumables market is witnessing online platforms grow at 9.66% CAGR as price-comparison transparency and automated ordering modules simplify replenishment. DSOs increasingly negotiate directly with manufacturers for large-volume contracts, pressuring traditional wholesalers to adopt hybrid digital storefronts with same-day fulfillment.
Digital portals integrate with practice-management software, allowing usage analytics to trigger auto-stocking for high-velocity items such as anesthesia carpules and etchants. Multinational distributors pilot subscription boxes for clear aligner auxiliaries and hygiene kits, smoothing demand patterns and enhancing customer retention.
By End-User:
Consolidation Reshapes Buying PowerDental clinics represented 52.55% of 2025 demand. Independent offices emphasize reliable supplier relationships and on-site education. The dental consumables market expectations shift as DSO/group practices show a 9.52% CAGR; procurement teams standardize formularies, pushing vendors to demonstrate cost-per-procedure efficiency. Hospitals, though smaller in count, procure high-value items for oncology or trauma-linked oral rehabilitation, positioning them as early adopters of advanced biomaterials.
Laboratories transition from casting alloys to milled and printed substructures, broadening material pallets and spurring demand for zirconia discs and resin pucks. Academic institutions set training norms, elevating digital workflow familiarity among new graduates and indirectly shaping future purchasing preferences.
Geography Analysis
North America Dental Consumables Market
North America generated 42.95% of global revenue in 2025. Implant therapy and clear-aligner cases command premium pricing, while insurers expand preventive benefits that lift sealant and fluoride varnish volumes. Regulatory clarity under FDA 510(k) accelerates product launches; however competition among a growing dentist workforce may intensify price sensitivity in commodity segments.
APAC Dental Consumables Market
Asia Pacific is projected to grow at 9.22% CAGR through 2031, buoyed by urban middle-class expansion and inbound dental tourism. Governments in India and Thailand endorse public-private partnerships to equip rural clinics. Local manufacturers capitalize by offering cost-competitive scanners and implant systems while partnering with global majors for material validation, shortening supply chains and countering import tariffs.
EMEA and South America Dental Consumables Market
Europe maintains steady 8.14% CAGR supported by robust reimbursement frameworks and rigorous product-quality standards. Germany’s precision-engineering base nurtures high-strength ceramic production, while the United Kingdom accelerates digital dentistry adoption via NHS modernization funds. The Middle East & Africa and South America post 7.52% and 7.63% CAGRs respectively as private insurance penetration and public oral-health campaigns broaden access.
Regulatory Landscape
Dental consumables are regulated primarily as medical devices, with requirements varying by risk class and geography. In the United States, dental devices continue to be governed under FDA classification rules in 21 CFR Part 872. Recent FDA actions have also expanded the use of performance-based approaches for certain dental products, including final device-specific guidances (September 2024) under the Safety and Performance Based Pathway, which covers categories such as dental ceramics, impression materials, and dental cements. FDA also issued guidance on animal study recommendations for dental bone grafting material devices (August 2025), shaping evidence expectations for regenerative consumables.
In Europe, Regulation (EU) 2017/745 (EU MDR) remains the central framework for implantables and other higher-risk dental devices, including requirements such as PMCF and PSURs. Implementation details continue to affect time-to-market for manufacturers and dental laboratories involved in custom-made and in-house workflows. A notable change is the adoption of Commission Delegated Regulation (EU) 2026/1359 (March 2026), which identifies specific Class IIb implantable device groups (including certain dental implantables and related products) that are exempt from technical documentation assessment for every individual device, reducing repetitive conformity assessment steps while keeping MDR surveillance and post-market obligations in place.
Competitive Landscape
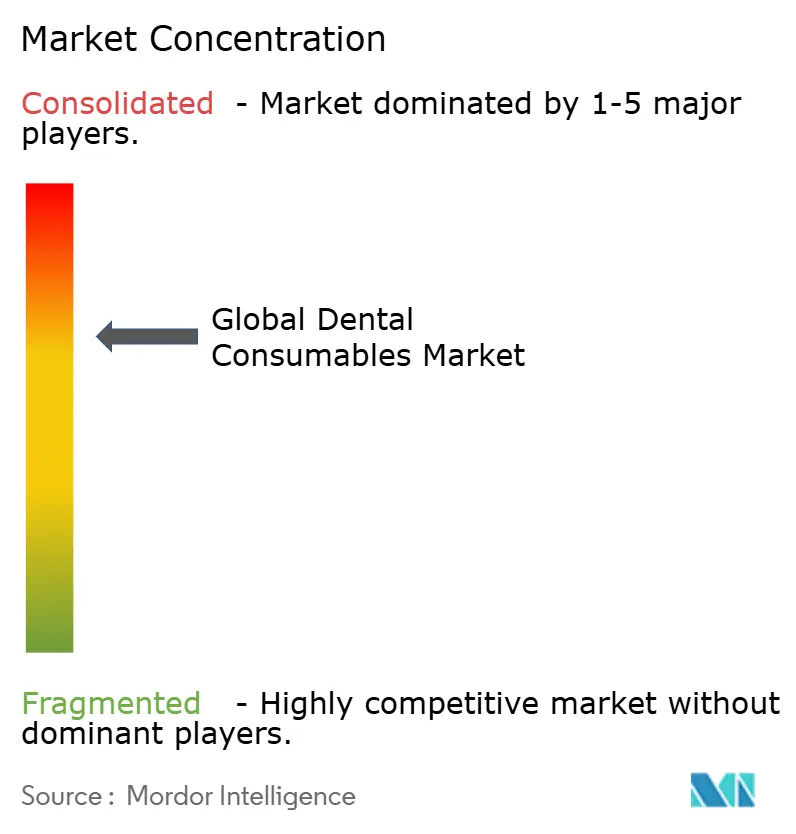
Top-five suppliers—Dentsply Sirona, Henry Schein, Envista, Straumann, and Ivoclar—collectively account for a large chunk of global revenue, indicating moderate concentration. These integrators cross-sell implants, restorative systems, and imaging hardware, leveraging service networks to lock in multi-year contracts. Straumann’s recent acquisition of an AI-planning start-up accelerates treatment-workflow integration, while Henry Schein expands European reach through distributor roll-ups.
Mid-tier specialists target niches: Coltene refines impression materials, GC introduces bioactive glass-ionomer innovations, and Septodont advances articaine anesthetics. Direct-to-patient disruptors like SmileDirectClub ignite aligner demand, compelling established orthodontic brands to enhance teledentistry capabilities. Sustainability emerges as a differentiator, with Ultradent piloting recyclable packaging and Young Innovations adopting solar-powered production lines.
DSO purchasing power alters negotiation leverage. Manufacturers able to bundle chairside units, consumables, and cloud support gain preferred-vendor status. In 2024, Benco Dental acquired two regional supply houses to boost logistics density in the U.S. Midwest, illustrating distributor consolidation aimed at defending share against online entrants.
Dental Consumables Industry Leaders
-
Dentsply Sirona
-
Envista Holdings
-
Henry Schein Inc.
-
Ivoclar Vivadent AG
-
Straumann Group
- *Disclaimer: Major Players sorted in no particular order
Dental Consumables Market Companies Covered in this Report
- Coltene Holding
- Dentsply Sirona
- Envista Holdings
- GC Corporation
- Henry Schein
- Hu-Friedy Mfg Co. LLC
- Ivoclar Vivadent
- Jeil Medical
- Kuraray Noritake Dental
- Nakanishi
- Osstem Implant
- Patterson Companies
- Septodont
- Shofu Inc.
- Solventum Corporation
- Straumann Group
- Thommen Medical
- Ultradent Products
- Young Innovations
- Ziacom Medical
- ZimVie
Market Opportunities and Future Outlook
Regionalized manufacturing capacity and materials validation for digital dentistry are creating whitespace for suppliers that can deliver consistent quality, traceability, and local availability of ceramics, resins, bonding systems, and preventive chemistries. In 2026, Solstice completed a 5.5 million Euro expansion in Seelze, Germany (January 2026), raising stannous fluoride capacity by about 45%, and Ivoclar extended its Local4Local production network with a new facility unveiled in Lipa City, Batangas, Philippines (June 2026), alongside a Letter of Intent for a Shanghai production site (April 2026). These investments support multi-region supply models that fit DSO-driven standardization and higher-throughput chairside workflows that use validated blocks, discs, and printable materials.
Compliance and audit readiness across distribution and post-market monitoring also support opportunities for distributors and manufacturers with strong documentation, labeling controls, and digital track-and-trace capabilities. FDA updated device inspection operations by replacing QSIT with a new inspection process (February 2026), and in Europe, the CJEU ruling in Case C 10/24 (June 2026) clarified distributor obligations to perform coherence checks for CE marking and MDR documentation before making devices available, which increases the value of compliant e-commerce and hybrid procurement platforms. At the same time, mid-2026 plans such as Kuraray Noritake Dental commencing expanded ceramic dental materials operations at its Miyoshi Plant reinforce the opportunity for suppliers that pair capacity expansion with validated compatibility across intraoral scanning, CAD/CAM milling, and 3D printing workflows.
Recent Industry Developments in Dental Consumables Market
- July 2026: PDS Health practices surpassed five million CEREC chairside restorations using Dentsply Sirona systems, highlighting scale in same-day restorative workflows. The milestone reinforces demand pull for compatible restorative blocks, burs, and bonding systems that support high-throughput chairside production across large group practices.
- May 2026: Dentsply Sirona launched Smart View - Detect, an FDA-cleared and CE-marked AI-enabled diagnostic aid for identifying periapical radiolucencies in CBCTs via the DS Core platform. The release supports cloud-centric clinical workflows and helps integrate imaging, case planning, and standardized consumable protocols in digitally enabled practices.
- September 2024: The US FDA issued final device-specific guidance documents under the Safety and Performance Based Pathway covering categories including dental ceramics, impression materials, and dental cements. Clearer performance-based expectations can shorten iteration cycles for materials developers while requiring suppliers to maintain robust test data packages aligned to FDA criteria.
Dental Consumables Market Report Scope and Research Methodology
Market Definition and Coverage
For this study, the market covers disposable and limited-life products used during dental diagnosis, prevention, and treatment in clinics, hospitals, and labs, and it is valued at manufacturer and distributor selling prices in USD.
Scope exclusions: Consumer retail oral-care staples like toothpaste, toothbrushes, and mouthwash are not counted.
Segments Covered in This Report
- By Product Type
- Aligners & Braces
- Anesthetics
- Bonding Agents & Adhesives
- Dental Burs
- Dental Implants
- Dental Splints
- Dental Sutures
- Hemostats
- Personal Protective Wear
- Prosthetics
- Regenerative Materials
- Restorative Materials
- Other Product Types
- By Treatment Modality
- Restorative
- Prosthodontic
- Endodontic
- Periodontic
- Orthodontic
- Cosmetic / Aesthetic
- Others
- By Distribution Channel
- Offline
- B2B
- B2C
- Online
- Offline
- By End-User
- Dental Clinics
- Dental Hospitals
- DSO / Group Practices
- Other End-Users
- By Geography (Value)
- North America
- United States
- Canada
- Mexico
- Europe
- Germany
- United Kingdom
- France
- Italy
- Spain
- Rest of Europe
- Asia-Pacific
- China
- India
- Japan
- Australia
- South Korea
- Rest of Asia-Pacific
- Middle East & Africa
- GCC
- South Africa
- Rest of Middle East & Africa
- South America
- Brazil
- Argentina
- Rest of South America
- North America
Data Sources, Market Sizing, and Validation
Desk Research
Desk research was used to set the market boundary, build a starting demand pool, and align the model to widely tracked health and trade indicators. We relied on public sources such as the World Health Organization (oral disease burden), the World Bank (macro and health spending context), OECD health statistics (utilization and spend proxies in member countries), and national health agencies like the US CDC (risk factors and prevention signals). Where relevant, trade and customs portals were also reviewed, with UN Comtrade, to sanity-check cross-border flows for dental materials that are commonly imported.
On the supply side, we referenced company filings and investor presentations to understand revenue mix, product positioning, and geographic exposure, which helps avoid mixing dental consumables with broader dental equipment lines. For cross-checks, we also used paid subscriptions for company financials and intelligence, patent databases to sense innovation cycles in restorative and endodontic materials, and shipment-level import and export data to validate directional volume movements. The sources listed here are illustrative only, and we reviewed other public documents and datasets to collect, validate, and clarify inputs.
Primary Interviews and Surveys
Primary work focused on turning broad demand indicators into realistic adoption and pricing assumptions, then confirming what is purchased and used per procedure in practice. We spoke with a mix of manufacturers, distributors, dental clinics, and lab-linked experts across APAC, EMEA, and the Americas so the model reflects differences in procedure mix, reimbursement patterns, and channel markups.
Distribution of primary research fieldwork respondents
| Company type | Respondent position | Region |
|---|---|---|
| Top tier: 37% | CXOs: 20% | APAC: 42% |
| Mid tier: 43% | Functional/Unit leaders: 33% | EMEA: 37% |
| Smaller Players: 20% | Managers: 47% | Americas: 21% |
Market-Sizing & Forecasting
Sizing starts with a top-down build that reconstructs spend from an addressable pool of dental visits and procedure types, then applies consumables usage per procedure with an average selling price that reflects channel structure. To keep it practical, we used a short list of measurable fingerprints, including dental caries and periodontal prevalence trends, dentist density and clinic throughput signals, implant and restoration procedure mix shifts, material price movement and inflation, and adoption of cosmetic and preventive visits that change per-patient consumption.
Those totals were then checked with selective bottom-up approximations using supplier revenue splits from public filings, distributor channel checks, and sampled volume multiplied by ASP for common consumables to see if any region looked overstated or undercounted. Where bottom-up coverage was incomplete, we handled gaps by scaling from interviewed penetration ranges and by using peer-market ratios tied to dental visit intensity.
For forecasting, scenario analysis was used around procedure volume growth and pricing, followed by a multivariate regression check where demand is explained by aging population share, disposable income, and oral healthcare utilization, then tuned through expert consensus on near-term purchasing behavior. This makes the forecast explainable, and it stays traceable to variables that a junior analyst can refresh each year.
Data Validation & Update Cycle
We run consistency checks between the modeled totals and independent signals, including procedure activity direction, reported revenue growth ranges, and trade flow movement for key material categories. If a region shows an unusual jump, we recheck the underlying inputs, compare assumptions against interview ranges, and trigger follow-up calls to confirm whether it is a true change or a modeling artifact.
Before sign-off, the model goes through multi-step analyst review where variances are documented and corrected, followed by a final pass to ensure currency timing and inflation adjustments are applied consistently. Reports are refreshed annually, and interim updates are made when material events shift procedure volumes, pricing, or reimbursement, so clients receive an up-to-date view at delivery.
Mordor Intelligence's Dental Consumables Market Size Compared With Other Published Estimates
Published numbers for dental consumables do not always match because the counted products and pricing levels vary, and the year used as the starting point also changes the total. Differences also come from whether estimates follow procedure-driven demand or lean more on broad healthcare spending ratios.
By tracking procedure-mix changes, channel-level ASP movement, and annual refresh checks, Mordor Intelligence keeps the model anchored to what gets consumed during dental treatments instead of blending in adjacent dental equipment revenue or consumer retail oral-care baskets.
Benchmark comparison
| Source | Market Size | Gaps in Research Methodology |
|---|---|---|
| Mordor Intelligence | USD 43.26 B (2026) | |
| Trade Publisher A | USD 37.60 B (2024) | Uses an earlier base year and can compress the market if procedure rebound and price inflation after 2024 are not fully reflected, and scope notes are less explicit on dental-only consumables versus broader categories. |
| Industry Portal B | USD 32.48 B (2024) | Applies a longer forecast window with conservative growth, and the smaller 2024 total can result if usage rates per procedure and distributor markups are simplified or averaged across regions. |
The spread mainly comes from base-year choice and what is counted as a consumable at the dental procedure level, followed by how pricing is carried forward by region and channel. Using procedure-linked demand drivers with clear price and validation steps helps keep the estimate repeatable, and it lets buyers see which assumptions move the total.
Key Questions Answered in the Report
How are dental service organizations (DSOs) reshaping purchasing strategies?
DSOs centralize procurement across large practice networks, favoring suppliers that can bundle implants, restorative kits, and digital workflow tools under volume-based contracts, which tightens margins for smaller distributors.
Why are bioactive implant materials attracting clinician interest?
Carbon-based coatings and regenerative surfaces actively promote osseointegration and reduce bacterial adhesion, helping practitioners lower revision rates and treat patients with compromised bone quality.
What is driving clinician adoption of same-day CAD/CAM workflows?
Intraoral scanners paired with chairside mills compress treatment time into a single visit, improve patient experience, and boost practice profitability by cutting reliance on external labs.
How does volatility in precious-metal prices impact restorative material choices?
Fluctuating costs for gold and palladium push labs and clinics toward zirconia and high-performance polymers, reducing exposure to commodity swings while preserving clinical outcomes.
What factors accelerate the migration to online purchasing platforms?
Widespread adoption of intraoral scanners and chairside mills accelerates same-day restorations, boosting usage of premium ceramics, bonding agents, and 3-D printable resins.
How do preventive-oral care campaigns influence consumable innovation?
Government and insurer emphasis on early intervention drives demand for sealants and fluoride varnishes, prompting manufacturers to develop faster-curing, higher-fluoride formulations tailored for school-based programs.