
Dental Caries Treatment Market Size and Share
Market Overview
| Study Period | 2020 - 2031 |
|---|---|
| Market Size (2026) | USD 7.58 Billion |
| Market Size (2031) | USD 8.83 Billion |
| Growth Rate (2026 - 2031) | 3.12 % |
| Fastest Growing Market | Asia Pacific |
| Largest Market | North America |
| Market Concentration | Medium |
Major Players *Disclaimer: Major Players sorted in no particular order Image © Mordor Intelligence. Reuse requires attribution under CC BY 4.0. | |
Dental Caries Treatment Market Analysis by Mordor Intelligence
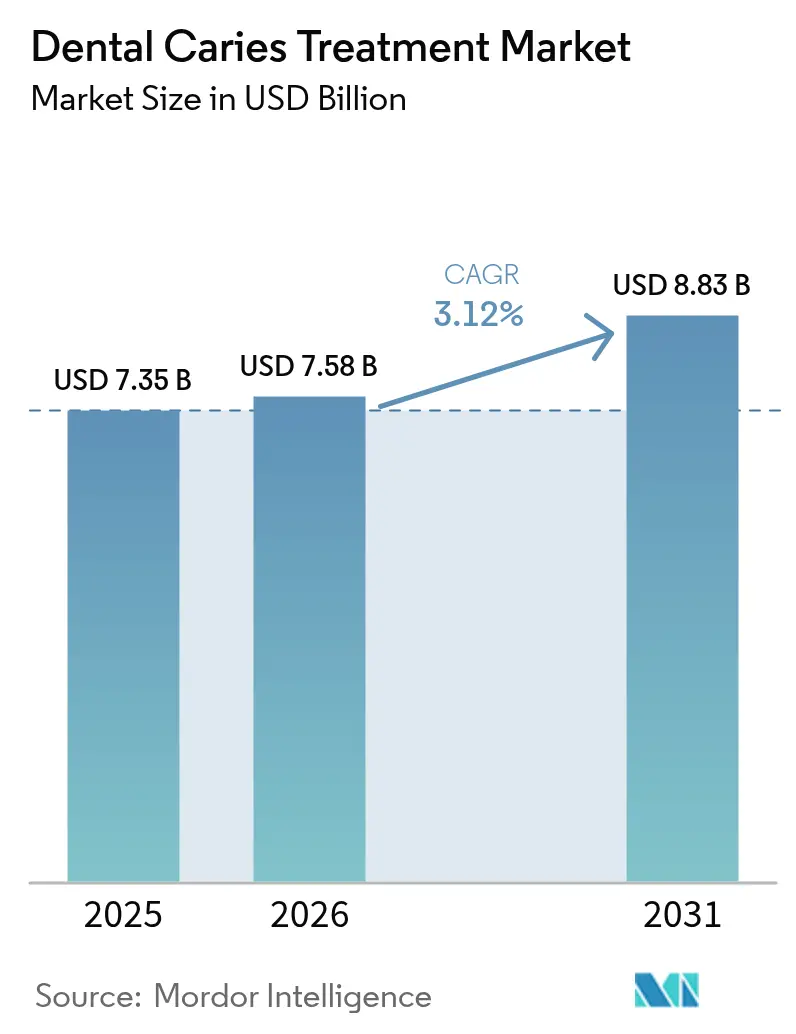
The Dental Caries Treatment Market size is expected to grow from USD 7.35 billion in 2025 to USD 7.58 billion in 2026 and is forecast to reach USD 8.83 billion by 2031 at 3.12% CAGR over 2026-2031.
This measured growth indicates a maturing competitive field in high-income economies, while emphasizing the new patient throughput now visible in emerging territories that have recently incorporated oral care into universal-coverage charters.[1] Momentum also stems from artificial-intelligence diagnostic suites that achieve 73-98% accuracy, compared to 45% for manual radiographic reading, thereby reducing misdiagnosis and expanding the addressable restorative pool.[2] At the same time, population ageing—by 2034, one in four U.S. residents will be older than 65 —shifts volume toward multi-surface restorations and vital-pulp therapies that carry higher per-procedure value. Clinical preference now tilts toward minimally invasive protocols; selective caries removal delivers 94% procedural success and reduces pulp-exposure risk from 27.5% to 2%. National fluoride programs, early screening mandates, and dental tourism bundles in the Asia-Pacific further widen access, ensuring a durable patient funnel for the dental caries treatment market.
Key Report Takeaways
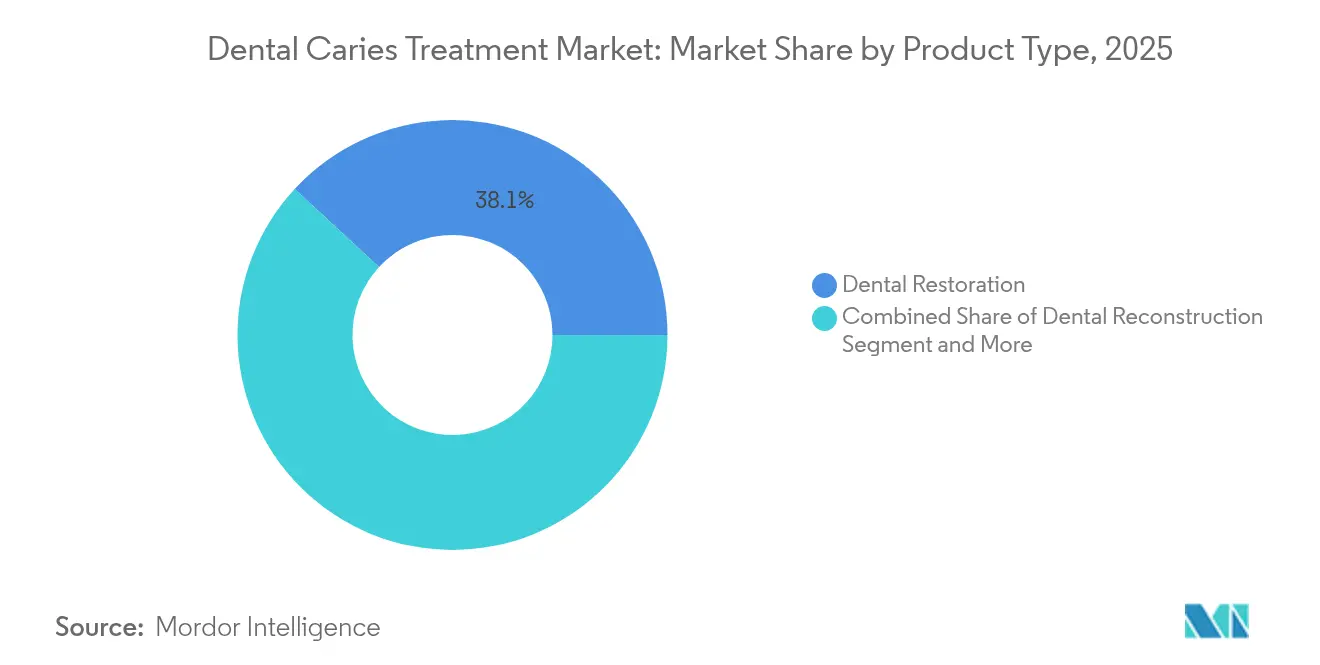
- By product type, dental restoration accounted for 38.12% of the revenue in 2025, while endodontic products are projected to rise at a 3.75% CAGR through 2031.
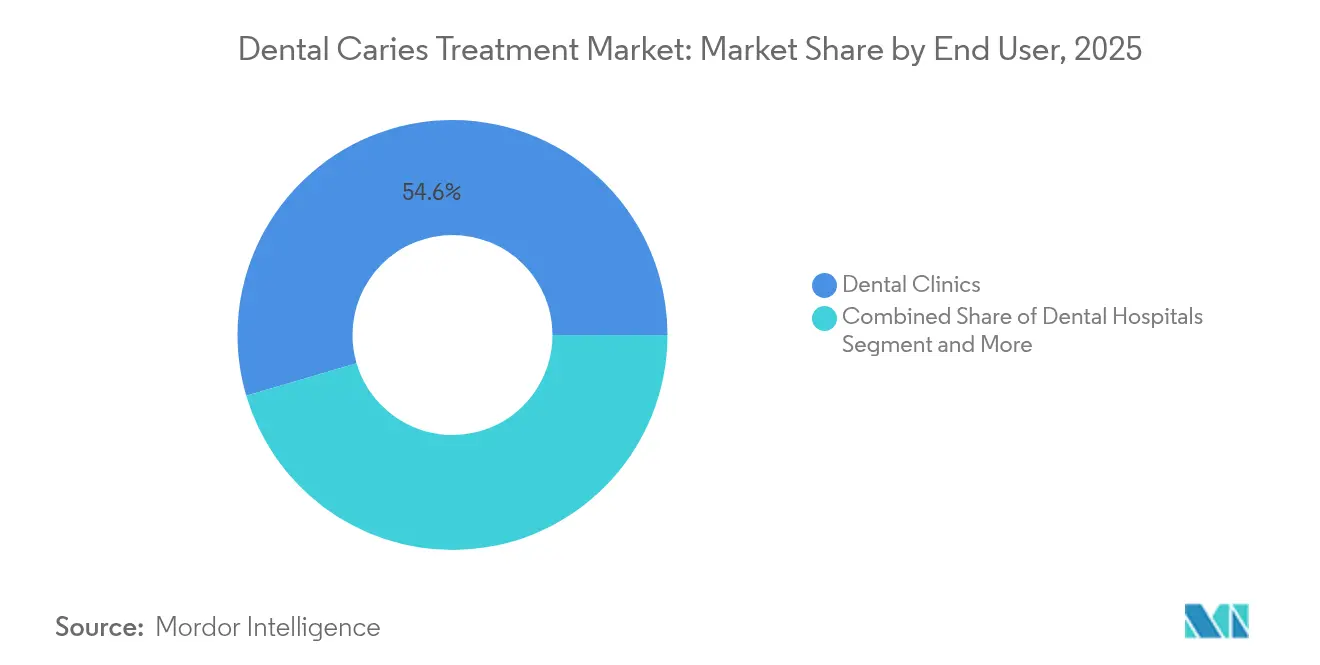
- By end user, dental clinics accounted for 54.55% of the dental caries treatment market share in 2025. In contrast, dental hospitals are expected to show the highest CAGR of 4.05% from 2025 to 2031, underscoring a gradual shift toward more complex case centers.
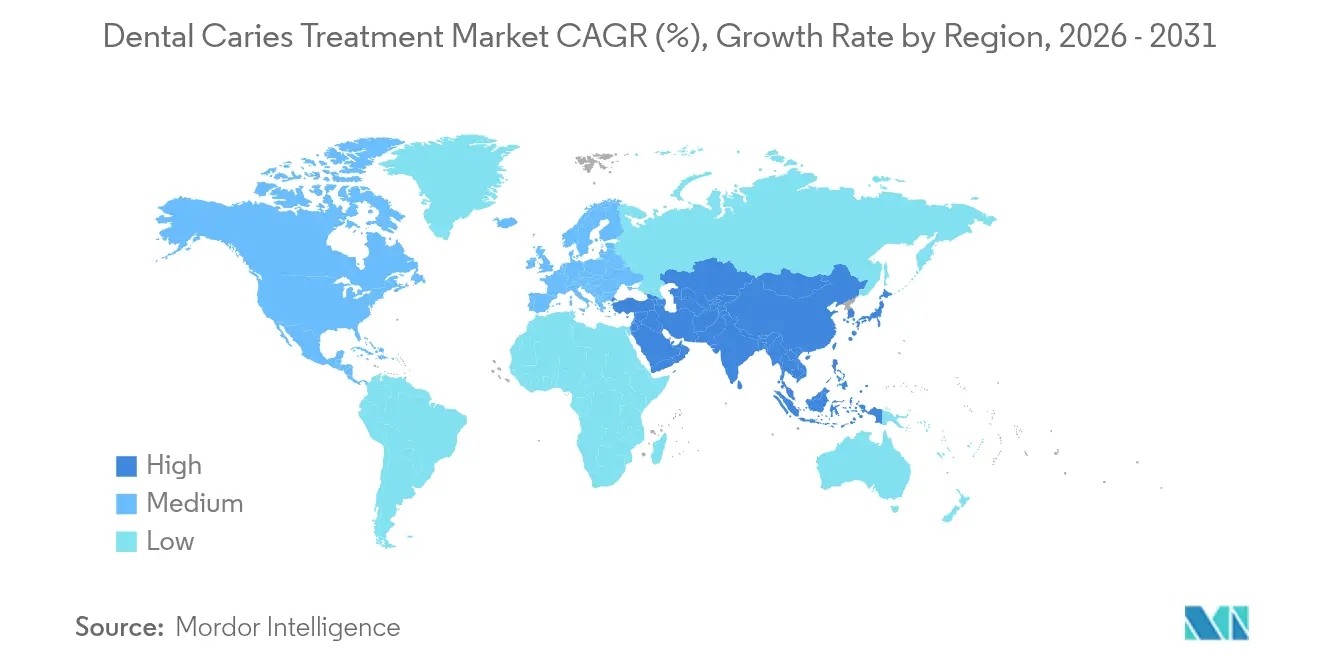
- By geography, North America represented 34.52% of global revenue in 2025, while the Asia-Pacific region is expected to advance at a 4.30% CAGR to 2031.
Note: Market size and forecast figures in this report are generated using Mordor Intelligence’s proprietary estimation framework, updated with the latest available data and insights as of 2026.
Global Dental Caries Treatment Market Trends and Insights
Drivers Impact Analysis*
| Drivers | (~) % Impact on CAGR Forecast | Geographic Relevance | Impact Timeline |
|---|---|---|---|
| Rising Prevalence of Dental Caries Worldwide | +1.0% | Global, with highest impact in developing regions | Long term (≥ 4 years) |
| Growing Geriatric Population Needing Restorative Care | +0.8% | North America & Europe, expanding to Asia-Pacific | Long term (≥ 4 years) |
| Technological Advances in Minimally-Invasive Caries Removal | +0.6% | Developed markets initially, global adoption | Medium term (2-4 years) |
| AI-Enabled Early Detection Tools Adoption | +0.5% | North America & Europe, selective Asia-Pacific markets | Medium term (2-4 years) |
| Expansion of Dental-Tourism Packages for Caries Treatment | +0.4% | Asia-Pacific core, spill-over to Latin America | Short term (≤ 2 years) |
| Universal-Health Coverage Schemes Adding Oral Health Benefits | +0.3% | Global, with priority in emerging economies | Long term (≥ 4 years) |
| Source: Mordor Intelligence | |||
Rising Prevalence of Dental Caries Worldwide
Untreated decay affects 2 billion adults and 514 million children, making caries the planet’s most common disease. Rapid urbanization increases access to sugar-dense snacks, potentially overwhelming the benefits of water fluoridation. In many low-income regions, public clinics often have multi-month waiting lists for simple fillings, allowing lesions to progress into costly endodontic cases that fuel the dental caries treatment market. Governments respond with community fluoride-varnish drives, yet workforce shortages persist. The net effect perpetuates a structural demand floor that shields the dental caries treatment market from broader economic cycles.
Growing Geriatric Population Needing Restorative Care
By 2030, more than 20% of EU residents will surpass 65 years, with similar ratios emerging across East Asia. Polypharmacy-induced xerostomia and reduced dexterity heighten root-surface decay, shifting treatment toward multi-surface restorations, partial pulpotomies, and root-caries sealants. Many seniors lack dental insurance, prompting policymakers to debate the expansion of Medicare dental coverage in the United States. Long-term-care facilities are now installing in-house operatories, further embedding restorative workflows into geriatric care and reinforcing demand for the dental caries treatment market.
Technological Advances in Minimally Invasive Caries Removal
Selective excavation, chemomechanical gels, and self-limiting burs preserve healthy dentin, achieving a 94% success rate and reducing pulp exposure to 2%. Chairside adoption lowers anaesthetic need, shortening visits and raising patient satisfaction. European insurers already reimburse conservative codes, encouraging further uptake. In the dental caries treatment market, product innovations that align with stricter infection control standards are helping vendors enhance their pricing strategies while supporting broader value-based care objectives.
AI-Enabled Early Detection Tools Adoption
Convolutional neural networks increase diagnostic accuracy to 98%, surpassing the 45% benchmark for manual reading. Early discovery supports resin-infiltration treatments that intercept decay before cavitation, creating new billing opportunities. The U.S. FDA clarified performance criteria in 2024, accelerating clearances. Subscription pricing models reduce capital hurdles for smaller practices, promoting wider installation of AI platforms and deepening data feedback loops that benefit the dental caries treatment market.
Restraints Impact Analysis*
| Restraints | (~) % Impact on CAGR Forecast | Geographic Relevance | Impact Timeline |
|---|---|---|---|
| High Cost of Advanced Restorative Materials & Devices | -0.6% | Global, with highest impact in price-sensitive markets | Medium term (2-4 years) |
| Limited Reimbursement for Dental Procedures | -0.4% | Global, particularly acute in developing economies | Long term (≥ 4 years) |
| Antimicrobial Resistance Reducing Cariostatic Efficacy | -0.3% | Global, with emerging hotspots in antibiotic-overuse regions | Long term (≥ 4 years) |
| Sustainability Scrutiny of Amalgam Alternatives | -0.2% | Europe & North America primarily, expanding globally | Medium term (2-4 years) |
| Source: Mordor Intelligence | |||
High Cost of Advanced Restorative Materials & Devices
Nanoparticle-reinforced composites and AI scanners can cost three times as much as conventional options. EU Medical Device Regulation paperwork raises overhead, squeezing smaller firms and nudging prices upwards. Latin American public payers cap reimbursements well below premium material costs, slowing the conversion to bioactive products.
Limited Reimbursement for Dental Procedures
Seventy percent of U.S. seniors lack dental coverage because Medicare does not cover routine care. Out-of-pocket spending exceeds 65% of dental spending in several low-income nations. Patients, therefore, delay early treatment until pain forces emergency extraction, a pattern that undercuts conservative therapy volumes.
*Our forecasts treat driver/restraint impacts as directional, not additive. The impact forecasts reflect baseline growth, mix effects, and variable interactions.
Segment Analysis
By Product Type: Restorative Materials Lead Innovation
The dental restoration segment captured 38.12% of the revenue in 2025, cementing its role as the cornerstone of the dental caries treatment market. Nano-hybrid composites compete on polish retention, wear resistance, and polymerisation shrinkage, while glass ionomers win in moisture-challenged cervical lesions with sustained fluoride release. Mercury amalgam phase-down under the Minamata Convention accelerates resin conversion, even in cost-sensitive clinics. Bioactive glass fillers that stimulate apatite formation expand premium price bands. Meanwhile, bulk-fill formulations that cure in 4 mm increments cut chair time, pleasing high-volume public clinics and solidifying throughput for the dental caries treatment industry. Manufacturers also develop shade-adaptive resins that reduce inventory complexity and cross-shade mismatch risk, strengthening brand stickiness across the dental caries treatment market.
Endodontic products are projected to grow at the fastest 3.75% CAGR through 2031, reflecting a global shift from extraction to pulp-vitality conservation. Bioceramic sealers bond chemically to dentin and resist micro-leakage, improving long-term outcomes. Rotary nickel-titanium files with regressive tapers reduce the risk of fracture and decrease the total number of instrumentation steps. Cone-beam CT guidance refines working-length estimation, curbing retreatment rates. Public health programmes in middle-income economies now reimburse pulpotomy for deciduous molars, delaying premature exfoliation and safeguarding occlusal development. These trends expand procedure counts and unit sales for obturators, sealers and irrigation solutions, reinforcing the dental caries treatment market trajectory.

By End User: Clinics Dominate Through Accessibility
Dental clinics accounted for 54.55% of the global revenue in 2025, underscoring consumer preference for local, relationship-based care pathways within the dental caries treatment market. Chain clinics backed by private equity roll out digital practice-management platforms that integrate intraoral scanning, chairside CAD/CAM, and AI lesion detection, thereby optimally lifting revenue per hour. Tele-triage portals triage pain cases and funnel patients to clinics, adding incremental restorative openings. Together, these service innovations keep the dental caries treatment market anchored in community-oriented settings.
Dental hospitals, although fewer in absolute number, are expected to clock a 4.05% CAGR through 2031. They manage medically complex patients with oncology therapy, anticoagulation, and severe systemic disease who require integrated anaesthesiology and emergency support. Multidisciplinary rounds coordinate cardiac clearance before root canal therapy, thereby reducing the risk of adverse events. Hospitals serve as training grounds for postgraduate residencies, giving them early access to prototype biomaterials and AI platforms. As population ageing accelerates, the prevalence of comorbidities increases, prompting referrals of high-risk restorative cases to hospital settings, thereby adding specialized volume to the dental caries treatment market.
Geography Analysis
North America accounted for 34.52% of the revenue in 2025, driven by employer-funded insurance enrollment, clinician density, and the rapid adoption of diagnostic AI solutions. Yet Medicare still excludes routine dentistry, limiting growth among retirees and influencing public hearings for benefit expansion. Corporate dental support organisations bulk-buy composites and liners, negotiating steep rebates that maintain margin resilience in the dental caries treatment market. Tele-dentistry pilots in remote Canada and Alaska expand fluoride-varnish coverage, increasing preventive caseloads and enhancing the rural reach of the dental caries treatment market.
Europe remains innovation-minded while managing tight budgets. Scandinavia subsidises fissure sealants and resin infiltration for schoolchildren, front-loading material usage early in life. The Medical Device Regulation introduces significant compliance costs, prompting consolidation and giving well-capitalized suppliers a competitive advantage. Germany trials bundled reimbursement for minimally invasive therapy, and France expands public-clinic fluoride-varnish programs, each generating steady revenue for the dental caries treatment market. Southern Europe is experiencing pent-up demand as economic recovery boosts private dental spending, helping to offset the maturity of the northern market.
The Asia-Pacific region charts the fastest growth at 4.30% CAGR, driven by rising disposable income, universal coverage expansion, and dental tourism inflows to Thailand, Vietnam, and Cambodia. Thailand reimburses atraumatic restorative treatment under its national scheme, fueling demand for glass hybrids. China’s Healthy Mouth Initiative doubles dental-school seats and mandates community-clinic quotas in underserved provinces, boosting workforce supply. Smartphone-based booking apps, popular among urban millennials, translate latent cosmetic interest into actual restorative appointments, adding volume to the dental caries treatment market. Simultaneously, local production of composites in India and Indonesia mitigates import duties, but quality-control discrepancies keep premium imports relevant for high-end clinics.
South America’s progress ties to Brazil’s public insurer, which extends fluoride-varnish coverage and builds demand for follow-up operative care. Currency volatility tempers premium import growth, encouraging regional suppliers to produce cost-optimised composites. The Middle East & Africa trail in absolute numbers, yet record high-value consumption in Gulf states, where expatriate professionals expect Western-grade restoratives and CBCT imaging. Sub-Saharan projects utilize mobile clinics for silver-diamine fluoride applications to school populations, providing early-stage interventions that funnel future restorative cases into the dental caries treatment market once disposable income increases.
Regulatory Landscape
Dental caries treatment products span both medical devices (diagnostic and procedural) and dental materials, so compliance in major markets is anchored on core device frameworks and, increasingly, harmonized quality systems. In the United States, the FDA regulates dental devices under 21 CFR Part 872, and caries detection devices (including laser fluorescence systems) are commonly classified as Class II devices, which brings requirements such as registration and listing, Medical Device Reporting, and design controls into scope. A key 2026 inflection point is the FDA Quality Management System Regulation (QMSR), effective February 2, 2026, which incorporates ISO 13485:2016 by reference and reshapes how manufacturers document and audit their quality systems across portfolios that include detection hardware, imaging adjuncts, and associated software workflows.
Alongside regulator requirements, standards evolution continues to affect technical documentation and audit readiness across restorative and implant-adjacent components used in caries-driven care pathways. For example, ISO 10451:2026 (published March 2026) specifies technical file content requirements for dental implant systems, which can affect suppliers whose product bundles include abutments and prosthetic components used in restorative reconstruction following advanced decay. Overall, these updates raise the premium on keeping technical files current, maintaining traceable design and change-control records, and sustaining post-market reporting discipline for global market access.
Competitive Landscape
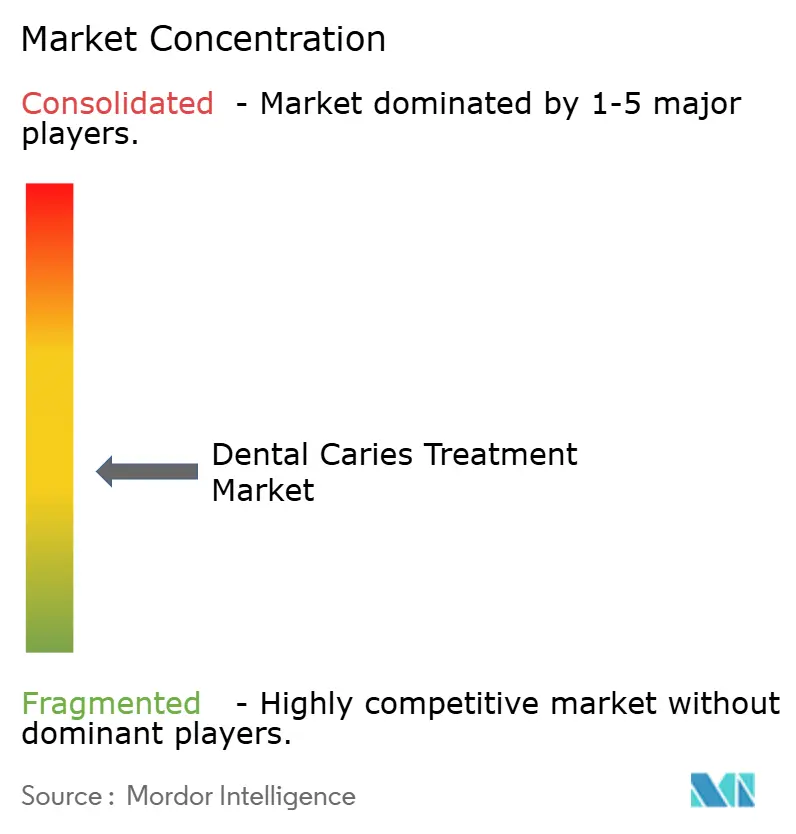
The dental caries treatment market is moderately concentrated, with the five largest companies accounting for over half of the aggregate revenue, while specialized challengers continue to thrive. Solventum, Dentsply Sirona, GC Corporation, and Colgate-Palmolive utilize a global scale to refresh composite chemistry, develop AI-integrated workflows, and distribute through direct sales footprints spanning more than 120 countries. Solventum’s spin-off from 3M sharpened its healthcare focus and accelerated launch cycles for 3D-printed aligner attachments now cleared in North America. Dentsply Sirona equips dental faculties with scanners and simulation units, locking in early-career brand preference.
AI software pioneers license diagnostic algorithms to imaging OEMs on a pay-per-scan basis, side-stepping hardware risk and tapping recurring revenue. Composite makers acquire syringe-tip specialists, ensuring ergonomic exclusivity that cements brand ecosystems within the dental caries treatment market. At the same time, regional suppliers address cost-sensitive segments with mercury-free glass ionomers and moisture-tolerant bioceramics. Venture funds inject capital into nanotechnology start-ups that explore peptide-functionalized fillers, promising genuine dentin remineralization. Regulatory stringency filters out undercapitalised entrants yet incentivises strategic alliances as a shortcut to compliance, keeping the dental caries treatment market dynamic and technologically progressive.
Supplier bargaining power rises as consolidation reduces competing bids, yet purchaser clout strengthens via group practices and dealer conglomerates. Pricing therefore remains stable; differentiation pivots on ease-of-use kits, digital workflow compatibility and evidence-backed clinical longevity. Marketing narratives spotlight value-based care materials that lower retreatment incidence over commodity discounting, a positioning that sustains gross margins even as reimbursement ceilings tighten. Consequently, the dental caries treatment market rewards firms that fuse science, software and service into integrated care pathways rather than isolated products.
Dental Caries Treatment Industry Leaders
-
Institut Straumann AG
-
Coltene Group
-
ZimVie Inc.
-
3M
-
Dentsply Sirona Inc.
- *Disclaimer: Major Players sorted in no particular order
Market Opportunities and Future Outlook
A clearer opportunity is emerging around Minimum Intervention Oral Care (MIOC) delivery models that shift emphasis from purely operative, procedure-centered dentistry toward structured prevention, surveillance, and tooth-preserving intervention. In April 2026, international expert consensus articulated an MIOC delivery framework, and in April 2026, EFCD, ESE, and ORCA published an S3-level guideline for deep caries management centered on selective excavation in vital permanent teeth. These signals point to demand for product ecosystems that support selective caries removal, pulp-preserving workflows, and longitudinal risk assessment, for example using ICCMS and caries risk frameworks such as CAMBRA and CariesCare4D, rather than focusing only on incremental improvements in commodity restorative materials.
Non-invasive arrest and public-health-oriented delivery also create commercialization room where reimbursement and provider pathways are being formalized. In the United States, the American Medical Association established a Category III billing code (0792T, effective July 1, 2023) to facilitate silver diamine fluoride (SDF) application by medical providers, expanding settings beyond traditional dental clinics when state scope-of-practice permits. In parallel, July 2026 WHO guidance on minimally invasive care and appropriate antibiotic use in oral health provides additional support for protocols that reduce unnecessary antibiotic exposure while increasing the role of diagnostics and conservative treatment kits, creating opportunities for vendors that bundle materials, training, and digital decision support into reproducible care pathways.
Recent Industry Developments
- May 2026: Institut Straumann AG released SIRIOS scanner software version 1.0.7, adding Smart HD scanning, improved NVIDIA GPU architecture support, and automated synchronization of patient demographics with Straumann AXS. The update reinforces performance and interoperability in chairside digital capture, supporting faster workflows that feed restorative and reconstruction planning. Strengthening the scanner-to-platform link also deepens ecosystem stickiness for clinics standardizing on Straumann digital tools.
- November 2025: Solventum launched 3M Clarity Precision Grip Attachments, positioned as 3D-printed aligner accessories tailored to tooth anatomy. While orthodontic, the launch reflects continued investment in dental-grade additive manufacturing and patient-specific components that share manufacturing, materials, and regulatory capabilities with restorative adjuncts. It also signals competitive differentiation through customized, workflow-integrated consumables sold through established dental channels.
- August 2024: Perceptive demonstrated a fully automated AI-guided restorative procedure reported to reduce crown placement time to about 15 minutes. The milestone highlights automation as a lever to raise throughput in clinics facing staffing constraints, and it elevates the role of integrated imaging, planning software, and guided instrumentation. Faster, standardized procedures can shift purchasing toward end-to-end systems that bundle detection, preparation, and restorative execution.
Research Methodology Framework and Report Scope
Market Definition and Coverage
This market covers the value of products and procedures used to treat dental caries in a clinical setting, from restorative fillings and reconstruction work through endodontic items used to manage decay-related damage.
Scope exclusions: routine dental checkups without caries treatment, general anesthesia services, and general oral care consumer goods such as toothpaste and mouthwash are excluded.
Segmentation Overview
- Product Type
- Dental Restoration
- Dental Reconstruction
- Abutments
- Bridges
- Crowns
- Dentures
- Implants
- Endodontic Products
- Files
- Obturator Devices
- Permanent Sealers
- Others
- By End User
- Dental Hospitals
- Dental Clinics
- Academic & Research Institutes
- By Geography
- North America
- United States
- Canada
- Mexico
- Europe
- Germany
- United Kingdom
- France
- Italy
- Spain
- Rest of Europe
- Asia-Pacific
- China
- India
- Japan
- South Korea
- Australia
- Rest of Asia-Pacific
- South America
- Brazil
- Argentina
- Rest of South America
- Middle East and Africa
- GCC
- South Africa
- Rest of Middle East and Africa
- North America
Data Sources, Market Sizing, and Validation
Desk Research
Desk research starts by mapping the disease and treatment pathway so the boundary stays clear between caries treatment and broader dental services. We reviewed public health and population indicators that influence demand, including oral health surveillance and caries prevalence summaries from the World Health Organization and the CDC.
To link demand with delivery capacity, we cross-checked procedure and reimbursement context using sources such as Centers for Medicare and Medicaid Services references, national health ministry publications where available, and professional association guidance such as the American Dental Association. We also used company filings, investor presentations, reputable press, and peer reviewed clinical publications to keep the treatment mix and adoption assumptions realistic. For numeric checks, we selectively used paid subscriptions for company financials and intelligence, patent databases, and an import and export shipment-level database when product flow context was needed. These examples are not exhaustive, and other public sources were used for data collection, validation, and clarification.
Primary Interviews and Surveys
Primary work focused on how treatment mix is shifting across restorations, reconstruction, and endodontic use, and how pricing is actually realized at the provider level. We spoke with stakeholders across dental clinics, dental hospitals, distributors, and manufacturing side roles, and coverage was balanced across major regions to validate utilization patterns, currency conversion timing, and the practical pace of ASP movement.
Distribution of primary research fieldwork respondents
| Company type | Respondent position | Region |
|---|---|---|
| Top tier: 29% | CXOs: 12% | APAC: 41% |
| Mid tier: 55% | Functional/Unit leaders: 39% | EMEA: 34% |
| Smaller Players: 16% | Managers: 49% | Americas: 25% |
Market-Sizing & Forecasting
Sizing is built using a top-down approach where treated demand is reconstructed from the care pipeline, and then converted into value using treatment mix and pricing logic. In practice, we start from population and oral health indicators, translate them into treated cases based on access to dentists and visit patterns, and then allocate the totals into restoration, reconstruction, and endodontic baskets.
Key inputs that shape the model include caries prevalence trends by age, dentist and clinic density as a proxy for access, procedure mix shifts (for example, more conservative interventions versus reconstruction-heavy care), utilization of endodontic items per treated case, and average selling price movement by product class. Prices are modeled in nominal terms with explicit assumptions for currency conversion timing, and then checked against country level signals gathered through interviews.
Forecasts rely on scenario analysis that ties forward demand to macro and care-delivery indicators, and then adjusts adoption and ASP paths based on what practitioners and industry participants expect. Bottom-up approximations are used as a control step, such as sampled ASP multiplied by estimated procedure volumes and selective supplier revenue roll-ups. Where data coverage is uneven, gaps are handled through transparent penetration assumptions.
Data Validation & Update Cycle
Outputs are validated by comparing model totals against independent signals, such as directional procedure volume indicators, oral health utilization trends, and the implied spend per treated patient. When a region shows an unexpected jump, we re-check drivers at the variable level, then take follow-up questions back to interviewees to confirm whether the change reflects a real shift or a modeling artifact.
Before sign-off, at least two analyst reviews are completed, where assumptions, currency timing, and the price progression steps are re-walked and stress-tested. Reports are refreshed annually, and interim updates are made when material events occur, such as major guideline shifts, reimbursement changes, or notable pricing moves. Right before delivery, a final pass is run so clients receive the latest updated view.
Mordor Intelligence's Dental Caries Treatment Market Estimate Compared With Other Published Estimates
Published market sizes for dental caries treatment do not always line up because each publisher makes slightly different choices on what to count, which year is treated as the anchor, and how prices are carried forward. Differences also come from how procedure intensity is translated into value, particularly when a study blends clinical activity with product revenue.
A key driver is refresh cadence and currency timing, since exchange rates can shift the reported USD value even when local demand is steady, and ASP logic can move totals depending on whether list prices or realized prices are used. The refresh-led checks applied in Mordor Intelligence help keep pricing progression and region conversion consistent when the treatment mix is changing year to year.
Benchmark comparison
| Source | Market Size | Gaps in Research Methodology |
|---|---|---|
| Mordor Intelligence | USD 7.35 B (2025) | |
| Global Research Publisher A | USD 8.01 B (2025) | This estimate appears to apply a broader value capture per treated case and may lean on different ASP progression assumptions across reconstruction and endodontic categories, which can lift the total for the same year. |
| Industry Research Publisher B | USD 7.70 B (2025) | The gap is likely explained by scope alignment choices and currency conversion timing, where a different treatment mix split or country coverage can raise the reported USD value even with similar underlying demand. |
Across the three figures, the spread is mainly explained by what is counted within treatment-related value, plus how pricing and exchange rates are carried into the stated year. By keeping the model tied to a clear treated-demand pathway and repeatable price steps, the resulting number stays traceable and easier to re-check when assumptions need to be updated.
Key Questions Answered in the Report
How large is the dental caries treatment market in 2026?
It stands at USD 7.58 billion and is projected to reach USD 8.83 billion by 2031, giving a 3.12% CAGR.
Which product group generates the most revenue?
Restorative materials lead with 38.12% of global revenue in 2025.
What is the fastest-growing product segment?
Endodontic procedures grow at a 3.75% CAGR, driven by pulp-preservation therapies.
Which region shows the quickest expansion?
Asia-Pacific grows at a 4.30% CAGR, propelled by universal-coverage schemes and dental tourism.
How does artificial intelligence influence treatment?
AI improves lesion detection to 98% accuracy, enabling earlier, less invasive interventions and boosting clinic productivity.
What reimbursement gap limits access?
Most national plans lack comprehensive dental benefits, so seniors and low-income populations often self-pay, delaying early care.