
Dental Caries Detector Market Size and Share
Market Overview
| Study Period | 2020 - 2031 |
|---|---|
| Market Size (2026) | USD 414.56 Million |
| Market Size (2031) | USD 612.51 Million |
| Growth Rate (2026 - 2031) | 8.12 % |
| Fastest Growing Market | Asia-Pacific |
| Largest Market | North America |
| Market Concentration | Medium |
Major Players *Disclaimer: Major Players sorted in no particular order Image © Mordor Intelligence. Reuse requires attribution under CC BY 4.0. | |
Dental Caries Detector Market Analysis by Mordor Intelligence
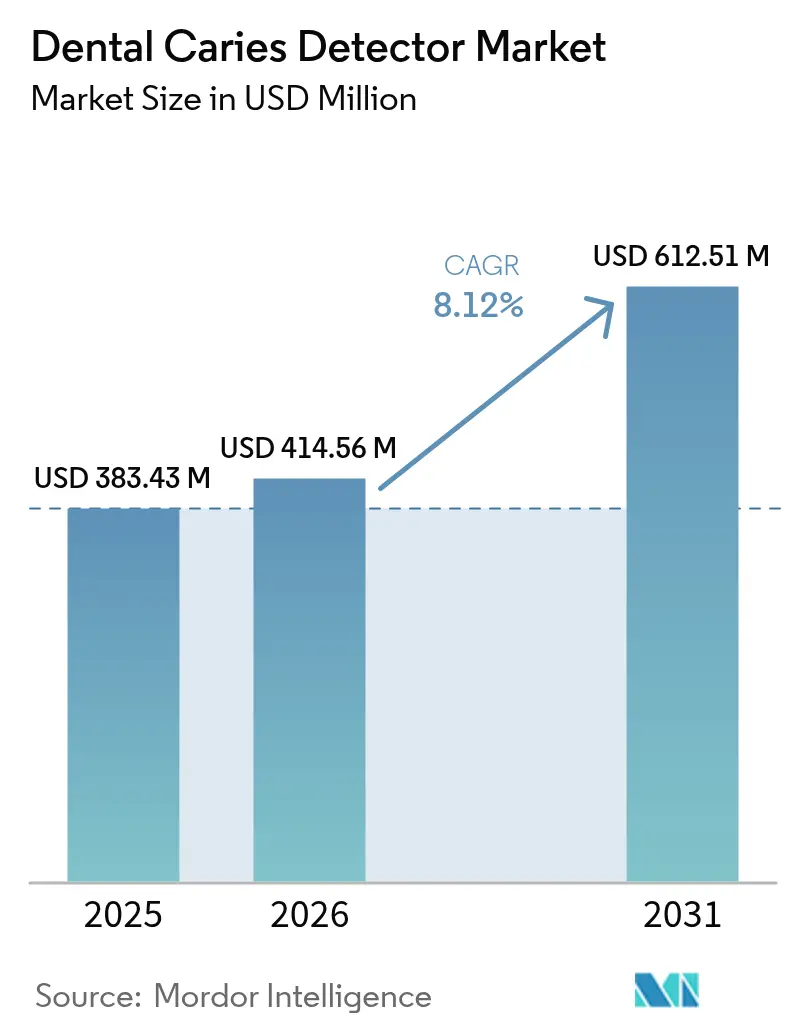
The Dental Caries Detector market size is expected to grow from USD 383.43 million in 2025 to USD 414.56 million in 2026 and is forecast to reach USD 612.51 million by 2031 at 8.12% CAGR over 2026-2031.
Momentum comes from the convergence of artificial intelligence (AI), laser fluorescence, and supportive regulatory pathways that prioritize preventive care over reactive treatment. Roughly 3.5 billion people now live with dental caries, and health systems are moving rapidly toward early-stage detection that can identify demineralization before cavitation sets in . Technology providers respond with integrated platforms that pair intraoral scanners, AI-based pattern recognition, and cloud analytics, yielding workflow efficiencies that raise treatment acceptance rates and shorten chair time. Venture capital keeps pouring into diagnostic start-ups underscoring sustained investor confidence in scalable, software-oriented solutions. Despite high acquisition costs in emerging economies, equipment leasing, mobile diagnostic services, and government oral-health campaigns temper price sensitivity and extend market outreach.
Key Report Takeaways
- By product category, laser fluorescence devices held 45.73% of the dental caries detector market share in 2025, while AI-based imaging platforms are forecast to rise at 10.98% CAGR through 2031.
- By end user, dental clinics commanded 56.02% share of the dental caries detector market size in 2025, whereas ambulatory surgical centers are expanding at 12.15% CAGR to 2031.
- By geography, North America led with 41.18% revenue share in 2025; Asia-Pacific is projected to register the fastest 11.74% CAGR between 2026 and 2031.
Note: Market size and forecast figures in this report are generated using Mordor Intelligence’s proprietary estimation framework, updated with the latest available data and insights as of 2026.
Global Dental Caries Detector Market Trends and Insights
Drivers Impact Analysis*
| Driver | (~) % Impact on CAGR Forecast | Geographic Relevance | Impact Timeline |
|---|---|---|---|
| Rising prevalence of dental caries | +2.1% | Global, highest in Asia-Pacific | Long term (≥ 4 years) |
| Adoption of advanced diagnostic devices | +1.8% | North America, EU, spill-over to Asia-Pacific | Medium term (2-4 years) |
| Demand for minimally invasive chairside diagnostics | +1.5% | Developed markets | Medium term (2-4 years) |
| AI-powered image analysis with intraoral scanners | +1.3% | North America, Western Europe, urban Asia-Pacific | Short term (≤ 2 years) |
| At-home salivary biosensor kits | +0.9% | Developed markets first | Long term (≥ 4 years) |
| Government oral-health initiatives | +0.7% | Asia-Pacific, Middle East & Africa | Long term (≥ 4 years) |
| Source: Mordor Intelligence | |||
Rising Prevalence of Dental Caries
Roughly 3.5 billion people now face untreated oral disease, making early detection solutions a global necessity.[1] Health ministries increasingly pivot toward preventive care, budgeting for mass screening programs that hinge on portable fluorescence or AI-aided imaging. Untreated caries can escalate into complex interventions that consume scarce healthcare resources, so payers are incentivizing early diagnosis to curb downstream costs. Portable detectors that run on battery power gain popularity in outreach clinics and school-based programs across Asia-Pacific. Population-level epidemiological data feed machine-learning models that help providers stratify risk and allocate resources precisely. This systemic shift from reactive fillings to proactive demineralization monitoring underpins a sizeable slice of the dental caries detector market.
Increasing Adoption of Advanced Diagnostic Devices
Traditional visual-tactile exams often miss incipient lesions, so clinicians turn to laser fluorescence, near-infrared transillumination, and AI decision-support to raise diagnostic sensitivity. Intraoral scanners have reached a 57% adoption rate among U.S. practices, now bundling AI modules that flag demineralization otherwise overlooked on 2-D radiographs.[2] Practices adopting AI report 22% higher patient treatment acceptance and up to USD 78,000 in additional annual production per location. Workflow upgrades pose short-term training burdens, yet early adopters find competitive differentiation in faster diagnoses and richer patient communication. Vendors are consequently embedding tutorials and real-time decision aids into software updates, lowering the learning curve for late adopters.
Growing Demand for Minimally-Invasive Chairside Diagnostics
Minimally invasive dentistry calls for tools that spot lesions when remineralization is still viable. Devices such as the DIAGNOdent pen post about 90% reliability for early-stage caries, supporting micro-invasive treatment strategies that preserve enamel.[3] Chairside feedback loops allow immediate counseling, reducing the psychological barrier for patients who dread traditional drilling. Parents in particular favor laser-based diagnostics for children, as the method is contact-free and painless. Integration with practice-management software simplifies record-keeping, speeds insurance submissions, and ties diagnoses directly to restorative planning. The patient experience improves, lifting Net Promoter Scores and repeat visit probabilities for practices.
AI-Powered Image Analysis Integration with Intraoral Scanners
VideaHealth’s Caries 3.0 model cut diagnostic variability by 70% and false positives by 65%, demonstrating clinical gains that resonate in multisite dental service organizations. FDA clearance for patients aged 3 years and older enables cradle-to-lifetime applicability, de-risking adoption for family practices. AI integration also automates clinical note-taking and cross-links radiographs to CDT codes, reducing administrative overhead. Over 30,000 clinicians currently rely on at least one AI-powered detection platform, a figure projected to double by 2027. Smaller practices hesitate due to subscription fees and IT requirements, but cloud-hosted models and tiered pricing are narrowing the affordability gap. Uniform diagnostic standards also support insurers’ push toward value-based reimbursement, further catalyzing uptake.
Restraints Impact Analysis*
| Restraint | (~) % Impact on CAGR Forecast | Geographic Relevance | Impact Timeline |
|---|---|---|---|
| Alternative diagnostic techniques | -1.2% | Global, higher in cost-sensitive markets | Medium term (2-4 years) |
| High device cost & limited reimbursement | -1.8% | Asia-Pacific emerging, MEA, South America | Long term (≥ 4 years) |
| Practitioner scepticism over specificity | -0.9% | Global, traditional settings | Short term (≤ 2 years) |
| Data-privacy and cybersecurity concerns | -0.7% | North America, EU (GDPR) | Medium term (2-4 years) |
| Source: Mordor Intelligence | |||
High Device Cost & Limited Reimbursement in Emerging Markets
Advanced detectors run between USD 15,000 and USD 50,000 per unit, and annual maintenance or software subscriptions can add 25% to operating costs. Many public and private insurers in emerging economies classify these devices as elective, pushing the financial burden onto patients. Out-of-pocket payments often surpass average monthly income, restricting uptake to affluent urban centers. Leasing schemes and revenue-sharing partnerships have begun mitigating capital constraints, while mobile diagnostic vans bring portable units to rural communities on rotational schedules. National oral-health programs in India, Brazil, and Egypt now pilot reimbursement bundles that include preventive diagnostics, yet wide-scale inclusion in basic coverage remains years away.
Practitioner Scepticism Over Variable Device Specificity
Studies catalogue specificity variation among fluorescence systems, with some units dipping to 50% in identifying certain lesion types. Seasoned clinicians worry false positives may trigger unnecessary interventions, undermining patient trust. Workflow adjustments, including extra imaging steps and additional data entry, can lengthen appointment slots in already compressed schedules. Peer-reviewed guidelines from professional bodies like the American Dental Association now outline evidence-based protocols, but widespread comfort will take time. Continuing-education credits linked to AI and fluorescence training help bridge knowledge gaps and foster confidence in quantitative thresholds for treatment decisions.
*Our forecasts treat driver/restraint impacts as directional, not additive. The impact forecasts reflect baseline growth, mix effects, and variable interactions.
Segment Analysis
By Product: AI Platforms Drive Innovation
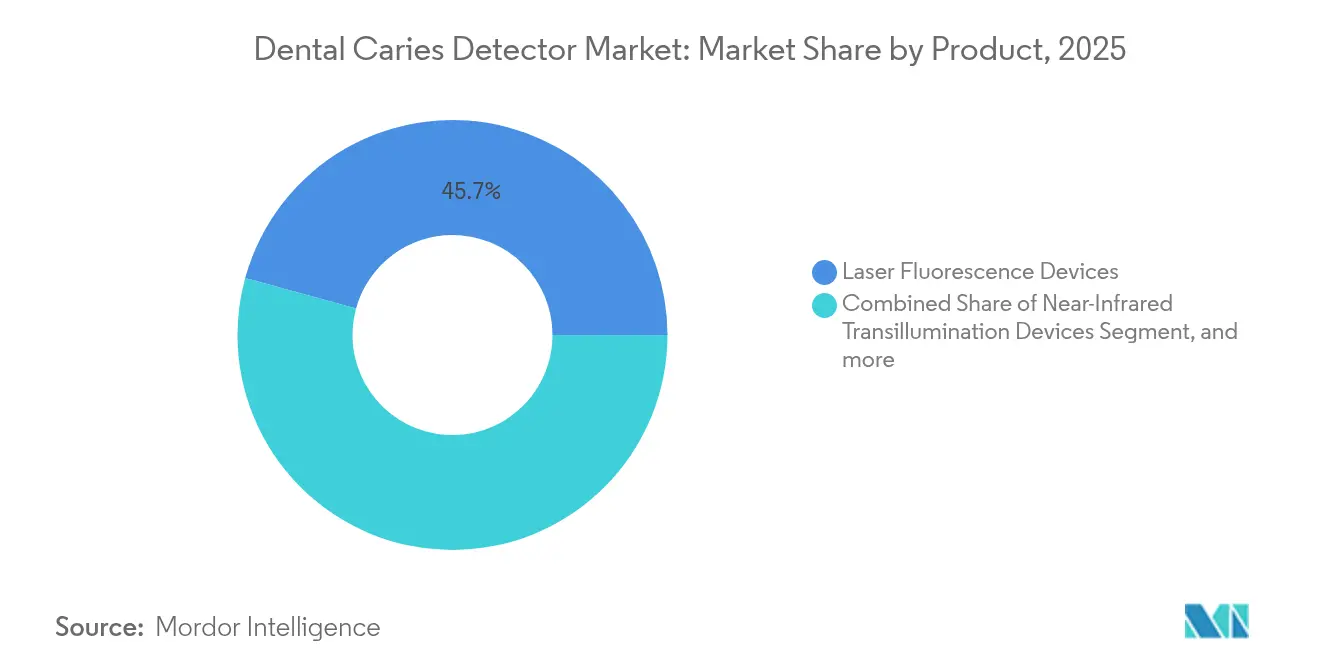
Laser fluorescence devices retained the largest 45.73% slice of the dental caries detector market in 2025, thanks to established clinical familiarity and diagnostic reliability. These hardware-centric solutions remain staples for practices seeking immediate, chairside confirmation without major IT overhauls. However, AI imaging platforms are expanding at 10.98% CAGR, propelling a structural pivot toward software subscriptions that decouple diagnostic power from fixed equipment purchases. AI modules continuously learn from new radiographs, so diagnostic accuracy improves throughout the product life cycle. Near-infrared transillumination and fiber-optic systems fulfill niche preferences for radiation-free imaging, especially in pediatric and pregnant cohorts. Optical coherence tomography stretches into premium territory, offering micrometer-resolution cross-sections valuable for research and complex restorative planning.
Hardware and software convergence blurs category boundaries as fluorescence wands embed AI firmware and intraoral scanners bundle caries algorithms. Vendors secure FDA approvals not just for devices but for cloud-based engines spanning multiple imaging modalities, elevating value propositions beyond point solutions. Integrated product ecosystems synchronize detection data with digital treatment-planning suites, enhancing restorative accuracy and cementing customer lock-in. Vendors with modular upgrade paths such as firmware downloads that unleash new algorithms win favor among cost-conscious practices. Competitive differentiation increasingly hinges on cybersecurity credentials, uptime guarantees, and user-experience design rather than just hardware optics or laser wavelengths.

By End User: Ambulatory Centers Lead Growth
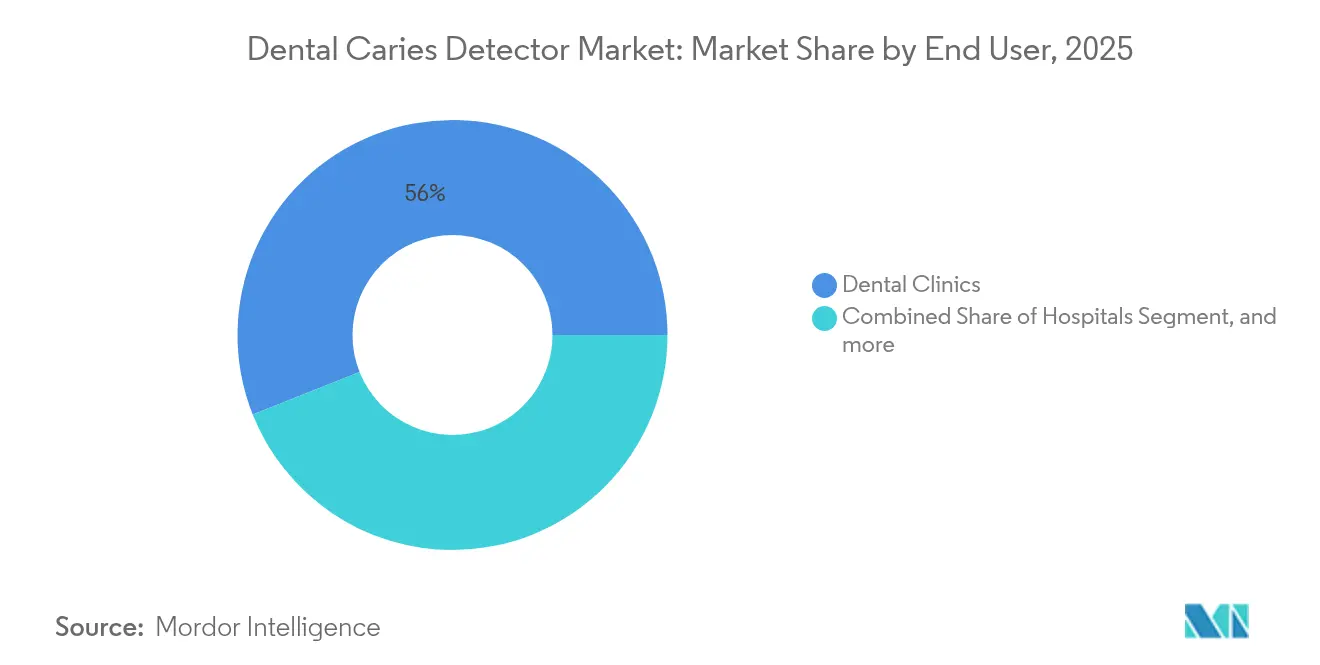
Dental clinics accounted for 56.02% of the dental caries detector market size in 2025, supported by broad patient bases and steady replacement cycles. Clinics rely on easy-to-operate fluorescence pens and plug-and-play AI packages that integrate with existing imaging suites. Hospitals sustain stable demand through trauma and oncology departments that need precise lesion mapping ahead of maxillofacial surgeries. Yet ambulatory surgical centers log the swiftest 12.15% CAGR, mirroring healthcare’s migration to outpatient venues that promise cost savings and faster scheduling. Ambulatory facilities integrate high-throughput scanners and AI dashboards to manage volume-driven models, shortening patient turnover while upholding diagnostic rigor.
Dental service organizations scale technology across multi-state footprints, leveraging centralized IT teams to manage AI updates and analytics dashboards. Academic institutes continue to incubate novel detection concepts, validating performance through randomized clinical trials that feed regulatory dossiers. Teledentistry platforms extend diagnostic reach to care deserts by funneling intraoral images from mobile hygiene units to centralized AI hubs for instant triage. Across all settings, the embrace of evidence-based preventive care aligns with insurers’ pay-for-performance programs, creating financial incentives to adopt technologies that reduce restorative burden downstream.
Geography Analysis
North America delivered 41.18% of 2025 sales, anchored by abundant private insurance, favorable reimbursement codes, and early FDA clearances for AI platforms. Dental-technology clusters around Boston, New York, and Silicon Valley funnel capital and talent into continuous product upgrades. Cross-border collaboration between U.S. device makers and Canadian dental service organizations accelerates rollout in both countries. The dental caries detector market share for North America remains resilient as group practices and DSOs deploy standardized diagnostics across hundreds of rooms.
Europe exhibits steady uptake despite stringent EU Medical Device Regulation (MDR) compliance costs. Germany, France, and the United Kingdom account for most regional orders, propelled by academic-industry partnerships that validate AI specificity under evidence-based protocols. Public health services in Scandinavia and the Netherlands reimburse for fluorescence-based preventive exams, nudging private practitioners toward similar tech stacks. Although MDR raises entry barriers for small manufacturers, it enhances patient confidence and reduces counterfeit imports, solidifying market baseline quality. The region’s focus on cross-border data privacy requires end-to-end encryption and GDPR-aligned cloud storage, influencing vendor selection criteria.
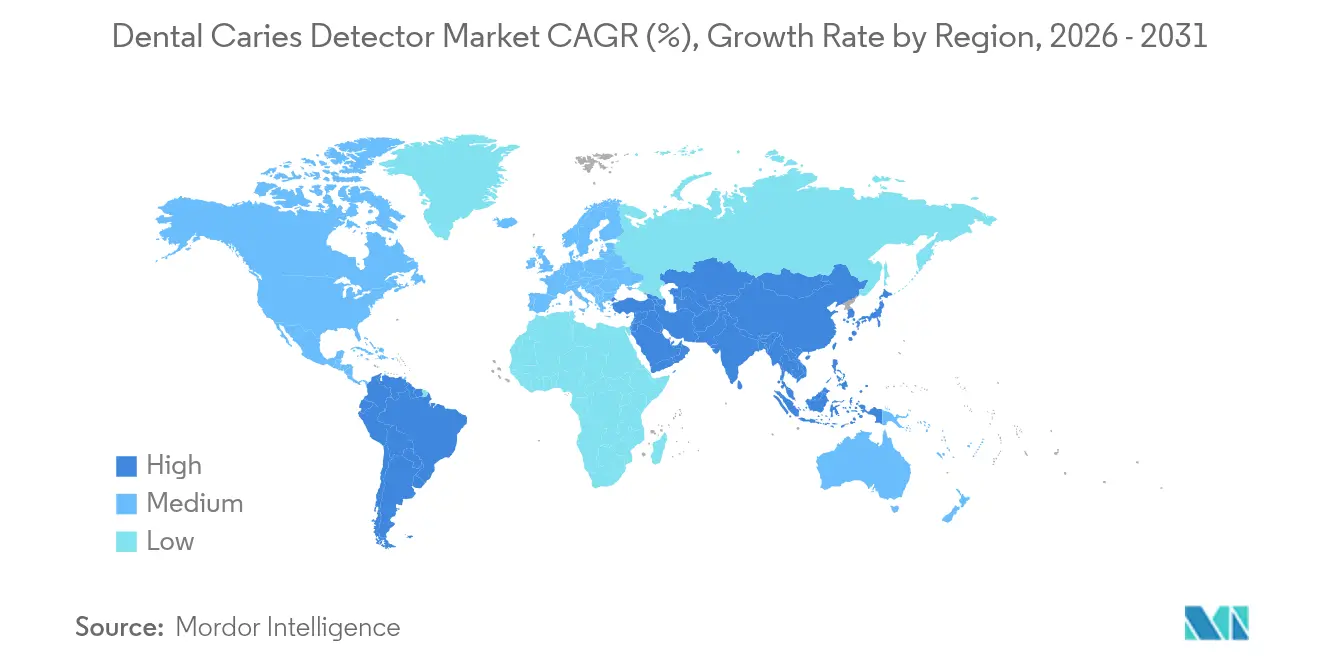
Asia-Pacific is the fastest-growing arena with a projected 11.74% CAGR. Urbanization in China and India unleashes middle-class demand for modern cosmetic and preventive dentistry. Government oral-health drives provide screening buses equipped with portable fluorescence devices that roam rural provinces. Japan spearheads technology adoption, while South Korean manufacturers export cost-effective transillumination units tailored for price-sensitive Southeast Asian clinics. Innovative financing leasing, pay-per-scan, and micro-loans facilitates adoption among smaller practitioners. Middle East & Africa and South America trail but show accelerating uptake as economic diversification funnels resources into primary healthcare and preventive dentistry infrastructure.
Regulatory Landscape
In the United States, laser fluorescence caries detection devices are regulated by the FDA under 21 CFR 872.1745 as Class II devices, typically requiring a 510(k) premarket notification and compliance with special controls. This established pathway continues to support iteration in fluorescence-based caries detection and adjacent digital diagnostics, including integrated scanning workflows. For example, the FDA 510(k) clearance associated with Dentsply Sirona Primescan 2 (K250771, dated March 2025) positions caries-related fluorescence response as an adjunct to conventional image data rather than a standalone replacement for clinical judgment.
In Europe, dental diagnostic devices are governed by the EU Medical Device Regulation (MDR) 2017/745, where classification commonly falls under Class IIa depending on intended use and patient contact, increasing the emphasis on clinical evaluation and Notified Body scrutiny. Technical guidance also continues to tighten documentation expectations, with CEN/TR 12401:2025 providing updated direction on mapping dental devices to MDR risk classes. Alongside device regulations, clinical standardization frameworks such as ICDAS and the 2024 ORCA/EFCD consensus reinforce that visual-tactile examination remains central for lesion activity assessment, shaping how manufacturers position fluorescence and AI tools as decision-support aids within evidence-based protocols.
Competitive Landscape
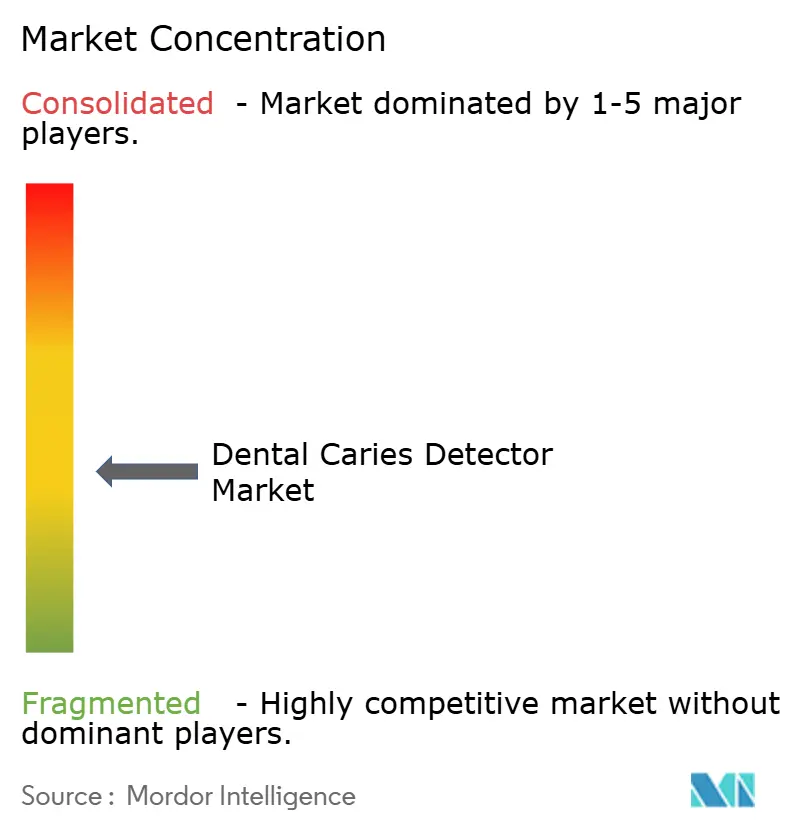
The dental caries detector market features moderate fragmentation. Incumbents such as Dentsply Sirona, KaVo, Planmeca, and BIOLASE leverage large installed bases, but AI-centric disrupters like VideaHealth, Pearl, and Overjet chip away with subscription revenue models that scale rapidly. Hardware manufacturers respond by embedding partner AI engines, creating symbiotic alliances that marry optics to algorithms. In 2024, 3Shape integrated third-party AI modules into its TRIOS scanners, reporting a 53% surge in usage among digital dentistry adopters.
Competitive positioning is increasingly won on user-experience and regulatory readiness rather than raw technical specs. Firms with ISO-certified manufacturing, HIPAA-compliant clouds, and MDR class-IIb approvals attract institutional buyers in group practice and hospital networks. Patent arsenals remain strategic; BIOLASE maintains 266 active patents covering laser-tissue interaction and photoacoustic detection pathways, raising entry barriers for newcomers. Start-ups compensate by crowding into white-space niches at-home salivary biosensors, pediatric-specific AI datasets, and teledentistry APIs that incumbents find difficult to prioritize. Mergers and acquisitions are likely as established players seek to shore up portfolios before software-only providers capture outsized margin.
Strategic moves in 2024-2025 underscore the shift. VideaHealth deepened distribution via Dentalcorp and Henry Schein One, widening its footprint across multi-clinic networks. Pearl’s USD 58 million Series B fueled expansion into 120 countries, and Overjet’s rollout inside Dental Care Alliance’s 400 clinics signaled enterprise-level confidence in AI diagnostics. Hardware players pivot: KaVo announced a roadmap to integrate cloud analytics into its Spectra fluorescence line, while Planmeca unveiled chairside transillumination units designed for AI plug-ins. Competitive intensity therefore migrates from equipment price wars to ecosystem stickiness, recurring software revenue, and data stewardship.
Dental Caries Detector Industry Leaders
-
AdDent, Inc
-
Centrix, Inc.
-
Dentsply Sirona
-
DentLight, Inc.
-
Air Techniques, Inc.
- *Disclaimer: Major Players sorted in no particular order
Market Opportunities and Future Outlook
A clear whitespace is forming around multi-modal workflows that embed caries signals into tools dentists use daily, particularly intraoral scanning and digital imaging ecosystems. Regulatory activity supports this direction, as recent FDA clearances highlight integration of fluorescence and near-infrared modes into standard scanning workflows (for example, Dentsply Sirona Primescan 2 under K250771), reducing dependence on standalone detection handpieces and improving fit with clinic throughput targets. This also aligns with procurement behavior among large dental groups and DSOs that standardize imaging and documentation across multi-site footprints, favoring platforms that combine acquisition, analysis, and reporting.
Longitudinal monitoring is another opportunity, moving beyond binary detection toward quantification that can be trended over time and paired with minimally invasive care pathways. Clinical literature continues to position fluorescence-based technologies as adjunctive tools that complement visual exams and bitewing radiographs, leaving room for vendors to differentiate through repeatable measurement, specificity management, and workflow integration rather than replacement-diagnosis claims. As AI-driven dental imaging software expands under computer-assisted detection (CADe) regulatory frameworks, vendors that can validate performance while meeting cybersecurity and data-privacy requirements (notably GDPR-aligned cloud handling in Europe and HIPAA-aligned controls in the United States) can translate diagnostic adoption into recurring software revenue and broader enterprise deployments.
Recent Industry Developments
- May 2026: Dentsply Sirona launched Smart View - Detect, an FDA-cleared AI-enabled diagnostic aid for identifying teeth with periapical radiolucencies in CBCT scans, with availability starting May 12, 2026. The release extends AI decision support deeper into routine 3D imaging workflows and strengthens the company's position in cloud-connected diagnostics alongside its existing digital dentistry ecosystem.
- January 2025: VideaHealth launched its Caries 3.0 model, reporting a 65% reduction in false positives and a 70% reduction in diagnostic variability. This upgrade raised the performance bar for AI-based caries detection and reinforced the shift toward subscription software as a core purchasing criterion for DSOs and multi-clinic groups.
- July 2024: Dental Care Alliance rolled out Overjet's FDA-cleared AI platform across more than 400 dental practices to detect and quantify oral disease and support patient education. Large-scale deployment signaled enterprise readiness for AI diagnostics, pressuring competing vendors to strengthen integrations, IT support, and standardized reporting across networked clinics.
Research Methodology Framework and Report Scope
Market Definition and Coverage
This market covers the revenues generated from dental caries detector devices used to identify tooth decay during dental diagnosis, including commonly used optical and fluorescence-based detection approaches across care settings.
Scope exclusions: We exclude restorative dental materials, general dental imaging systems not primarily used for caries detection, and routine dental consumables and services.
Segmentation Overview
- By Product
- Laser Fluorescence Devices
- Near-Infrared Transillumination Devices
- Fiber-Optic Transillumination Devices
- Optical Coherence Tomography Systems
- Photothermal Radiometry & Modulated-Luminescence Devices
- AI-Based Imaging Software & Platforms
- By End User
- Hospitals
- Dental Clinics
- Ambulatory Surgical Centers
- Academic & Research Institutes
- By Geography
- North America
- United States
- Canada
- Mexico
- Europe
- Germany
- United Kingdom
- France
- Italy
- Spain
- Rest of Europe
- Asia-Pacific
- China
- Japan
- India
- Australia
- South Korea
- Rest of Asia-Pacific
- Middle East & Africa
- GCC
- South Africa
- Rest of Middle East & Africa
- South America
- Brazil
- Argentina
- Rest of South America
- North America
Data Sources, Market Sizing, and Validation
Desk Research
We start with desk research to build the market frame and to capture the most repeatable demand signals for dental care activity and caries screening. Public and official sources help us capture oral health burden, dental visit patterns, and technology adoption basics, using sources such as CDC oral health statistics, WHO oral health facts, NIH and NIDCR publications, and peer reviewed dentistry journals. We also review FDA device and safety communications where relevant, since regulatory clearances affect what products are practically available in each geography.
On the supply side, we review company filings, investor decks, product brochures, and credible press coverage to map device types and typical go to market routes. We also use paid subscriptions for company financials and intelligence, patent databases, and news and financials to cross check product timelines and ownership changes that can shift reported revenues. The examples listed above are illustrative only, and many other sources were also used for data collection, validation, and clarification during the study.
Primary Interviews and Surveys
To fill gaps that desk sources do not answer well, we run expert interviews and structured surveys across the value chain, including device manufacturers, distributors, dental clinic decision makers, and clinicians who use these tools in daily diagnosis. We cover major regions so inputs like average selling price movement, replacement cycles, and channel margins can be checked, and then adjusted when the story from the interviews does not match the desk view.
Distribution of primary research fieldwork respondents
| Company type | Respondent position | Region |
|---|---|---|
| Top tier: 30% | CXOs: 13% | APAC: 52% |
| Mid tier: 56% | Functional/Unit leaders: 38% | EMEA: 29% |
| Smaller Players: 14% | Managers: 49% | Americas: 19% |
Market-Sizing & Forecasting
The core model uses a top-down approach where the demand pool is reconstructed from dental care activity and caries screening intensity, then narrowed down to the share of exams where dedicated caries detection devices are used. Those totals are corroborated with selective bottom-up approximations, such as sampled ASP multiplied by estimated annual unit placements and replacements through key channels, which helps us sanity check the final number and correct for overcounting.
Key inputs used in the model include dental visit volume and procedure mix, caries prevalence signals that influence screening frequency, the share of clinics equipped with fluorescence or trans-illumination tools, average device price bands by technology, and replacement cycles tied to utilization and service life. When a data point is not available for a smaller country, we bridge it through proxy indicators like dentist density and clinic count, and then confirm the direction with interviews before locking assumptions.
For forecasting, we use scenario analysis supported by expert consensus on adoption speed, pricing progression, and care delivery shifts, and then translate each scenario into yearly market values. The final forecast is stress tested against expected technology diffusion curves and regional healthcare spending trends so growth does not rely only on one optimistic assumption.
Data Validation & Update Cycle
We validate the outputs by triangulating the modeled totals against independent signals, such as device installation patterns discussed by distributors, regional dental care utilization trends, and observed price moves for major device types. Any sharp jumps are reviewed by analysts in multiple steps, where assumptions are rechecked, calculations are replicated, and outliers are traced back to the specific driver that caused them.
The report is refreshed annually, and interim updates are triggered when material events occur, such as product launches, major recalls, regulatory changes, or meaningful pricing shifts. Before delivery, we run a fresh review pass so the final output reflects the latest available data and confirmed market feedback.
Mordor Intelligence's Dental Caries Detector Market Size Compared Against Other Published Estimates
Published market values for dental caries detectors often differ because each publisher draws the market line in a slightly different place, and then applies different price, adoption, and currency assumptions. We also see gaps when the base year is not the same, or when older assumptions stay in place even after product mix and pricing have shifted.
Some external estimates appear to bundle adjacent dental diagnostic categories or broader dental imaging revenues into the same total, which mechanically raises the value. In Mordor Intelligence, the count is limited to dedicated caries detection devices (laser fluorescence and fiber optic trans-illumination) and the pricing is validated through channel checks and interviews, before regional values are rolled up and converted using consistent year specific exchange rates.
Benchmark comparison
| Source | Market Size | Gaps in Research Methodology |
|---|---|---|
| Mordor Intelligence | USD 414.56 M (2026) | |
| Industry Publisher A | USD 342.00 M (2024) | Uses an earlier base year and a different adoption curve, and it may not fully normalize ASP by technology mix and channel margin differences across regions. |
| Industry Publisher B | USD 674.00 M (2031) | Reports a later forecast-year number and can look larger when readers compare it to a current-year figure, and the model assumptions are not clearly tied back to dental visit volumes and replacement cycles. |
Taken together, the spread is mostly explained by year alignment and how tightly the scope is tied to actual use of caries detection devices in dental workflows. Our approach keeps the totals traceable to a few repeatable inputs, like screening intensity, device penetration, and verified price bands, which makes the sizing easier to replicate and update.
Key Questions Answered in the Report
What is the current valuation of the dental caries detector market?
The dental caries detector market size stands at USD 414.56 million in 2026 and is forecast to reach USD 612.51 million by 2031.
How fast is growth expected over the forecast period?
The market is projected to expand at an 8.12% CAGR between 2026 and 2031, driven by AI integration, fluorescence advances, and preventive-care policies.
Which product segment leads in revenue?
Laser fluorescence devices hold the largest 45.73% share, buoyed by clinical familiarity and immediate chairside usability.
Which end-user segment is expanding the quickest?
Ambulatory surgical centers are growing at a 12.15% CAGR as dental services decentralize into outpatient settings.
Why is Asia-Pacific considered the most promising region?
Rising middle-class populations, public oral-health campaigns, and creative financing models support a projected 11.74% regional CAGR.
How do AI platforms improve diagnostic outcomes?
AI reduces diagnostic variability by up to 70% and cuts false positives by 65%, boosting patient trust and treatment acceptance rates.