
Dental CAD Market Size and Share
Market Overview
| Study Period | 2020 - 2031 |
|---|---|
| Market Size (2026) | USD 3.33 Billion |
| Market Size (2031) | USD 4.96 Billion |
| Growth Rate (2026 - 2031) | 8.32 % |
| Fastest Growing Market | Asia Pacific |
| Largest Market | Europe |
| Market Concentration | Medium |
Major Players *Disclaimer: Major Players sorted in no particular order Image © Mordor Intelligence. Reuse requires attribution under CC BY 4.0. | |
Dental CAD Market Analysis by Mordor Intelligence
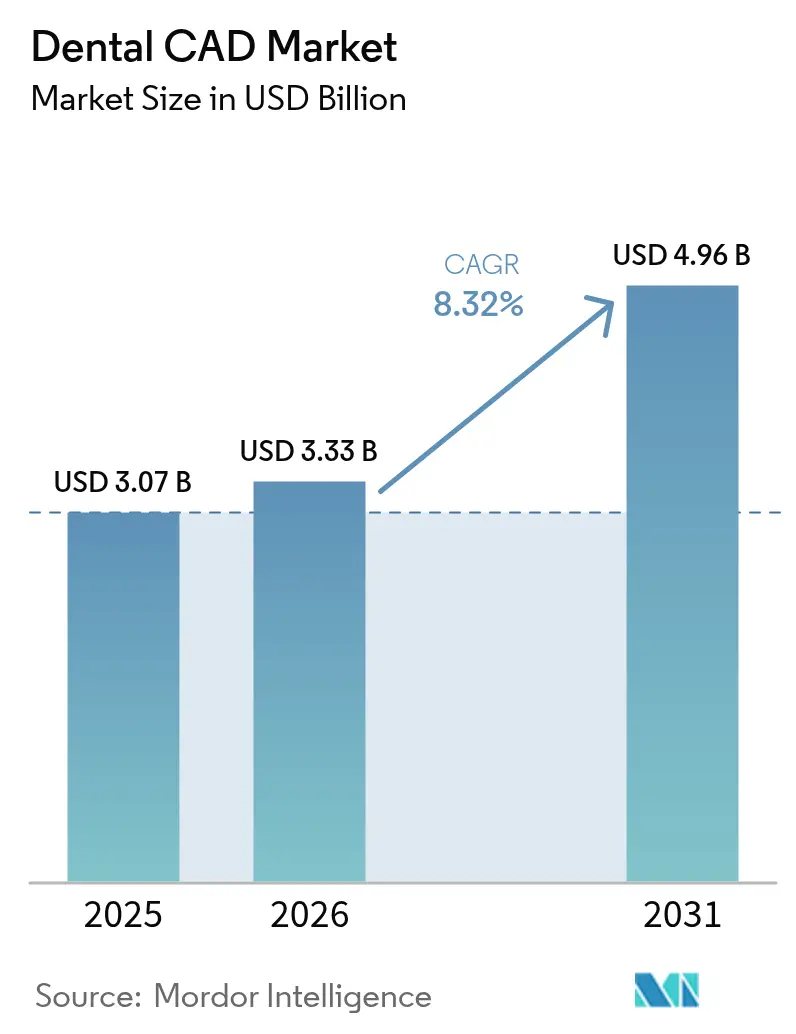
The Dental CAD market size is expected to grow from USD 3.07 billion in 2025 to USD 3.33 billion in 2026 and is forecast to reach USD 4.96 billion by 2031 at 8.32% CAGR over 2026-2031.
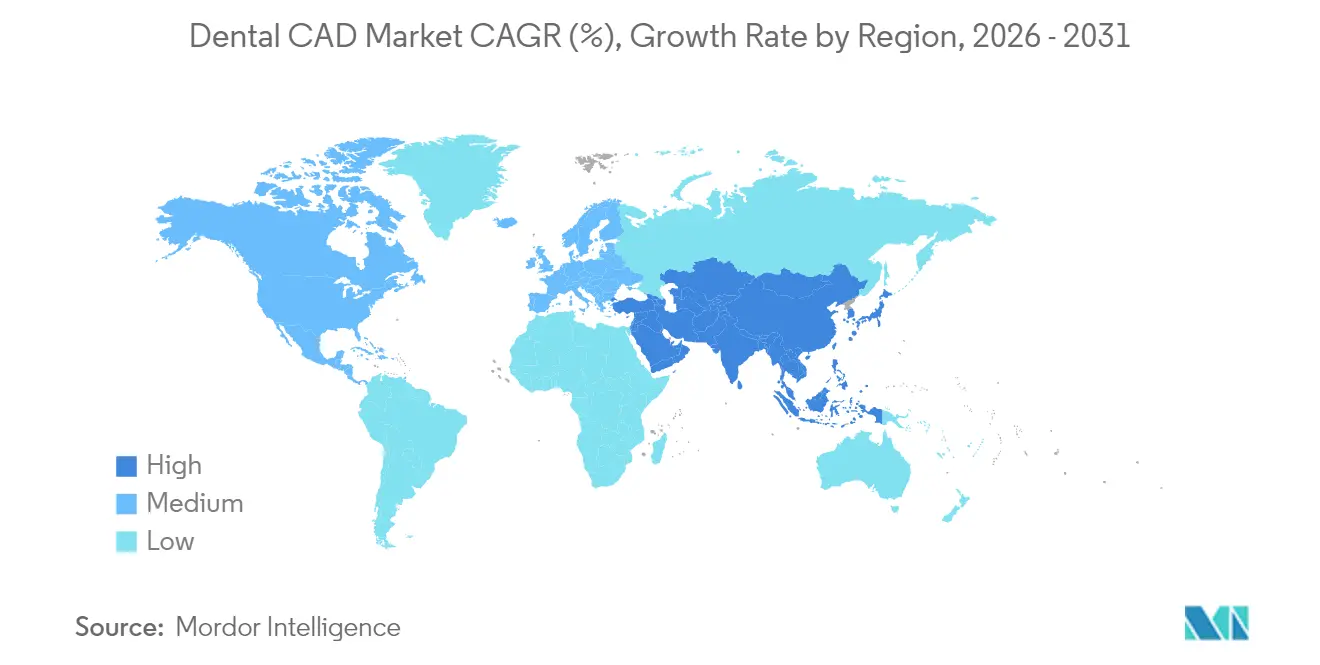
Growth rests on the accelerating shift from analog laboratories to end-to-end digital workflows, which shorten crown design-to-delivery cycles from hours to minutes while preserving micrometer-level accuracy. Artificial-intelligence (AI) layers now automate restoration design, suggesting connectors, emergence profiles, and occlusal contacts in real-time, and trim two-thirds of manual CAD time per case. Hardware commoditization is nudging competitive advantage toward software ecosystems that unify intraoral scanners, cloud collaboration portals, and chairside milling units. Demographic aging, rising implant acceptance, and global DSO consolidation further anchor long-range growth as large practice networks standardize procurement and training across hundreds of sites. Europe maintains leadership through stringent quality standards and early digital adoption, yet Asia-Pacific shows the steepest curve as healthcare infrastructure investment coincides with growing patient spending power.
Key Report Takeaways
- By component, milling machines led with a 63.12% revenue share in 2025; software is projected to register a 9.48% CAGR from 2026 to 2031.
- By end user, dental laboratories held 42.05% of the market in 2025, while dental clinics and hospitals are set to expand at a 10.05% CAGR through 2031.
- By application, crowns and bridges captured a 60.85% revenue share in 2025; implants are the fastest-growing segment, forecasted to rise at an 10.62% CAGR through 2031.
- By geography, Europe accounted for 32.20% of the 2025 revenue, whereas the Asia-Pacific region is poised for an 11.08% CAGR to 2031.
Note: Market size and forecast figures in this report are generated using Mordor Intelligence’s proprietary estimation framework, updated with the latest available data and insights as of 2026.
Market Trends and Insights
Drivers Impact Analysis of Dental CAD Market*
| Driver | (~) % Impact on CAGR Forecast | Geographic Relevance | Impact Timeline |
|---|---|---|---|
| Increasing Adoption of Chairside Digital Workflows | +2.1% | Global, with North America & Europe leading | Medium term (2-4 years) |
| Rising Prevalence of Restorative & Prosthetic Procedures | +1.8% | Global, with APAC showing highest growth | Long term (≥ 4 years) |
| Cost- & Time-Efficiency Versus Conventional Techniques | +1.5% | Global, particularly high-volume practices | Short term (≤ 2 years) |
| Integration with Intraoral Scanning & 3-D Printing Ecosystems | +1.3% | North America & Europe, expanding to APAC | Medium term (2-4 years) |
| AI-driven Generative Design for Complex Restorations | +0.9% | North America & Europe initially | Long term (≥ 4 years) |
| DSO Roll-outs of Standardized CAD Platforms | +0.7% | North America primarily | Medium term (2-4 years) |
| Source: Mordor Intelligence | |||
Increasing Adoption of Chairside Digital Workflows
Same-day dentistry is now tangible because chairside systems link intraoral scanners, AI-enabled CAD engines, and four-axis mills in a single appointment window. Practices deploying a second mill report 145% production lifts within four months as average monthly units jump from 13.3 to 27.5. Patients show strong preference for single-visit crowns, with 85% valuing convenience and half agreeing to premium pricing. Scanner refresh rates of 1.3 seconds and 94% acceptance rates for AI-proposed designs further compress clinical bottlenecks. Nevertheless, offices must synchronize scanning, design, nesting, and milling while adhering to infection-control protocols and insurance coding.
Rising Prevalence of Restorative & Prosthetic Procedures
The proportion of adults aged 65+ is swelling in every major economy, raising restorative workloads that reward CAD precision. Full-arch implant plans merge cone-beam CT with parametric libraries to place fixtures within ±50 µm of intended axes. Surgeons increasingly deploy 3-D-printed titanium meshes shaped by CAD to steer guided bone regeneration, customizing pore width to vascularization requirements and lowering bill-of-materials versus machined alternatives. Digital smile-design modules overlay facial scans on intraoral data, allowing shade simulation and occlusal mapping before irreversible drilling. Integration of photogrammetry devices further expands data richness, enabling bite capture during open-tray impressions without splints.
Cost- & Time-Efficiency Versus Conventional Techniques
Complete chairside rigs cost USD 75,000-200,000, spanning scanners, software, and milling hardware. Practices achieving 30 crowns a month recoup the investment inside 24 months once laboratory fees, shipping, and remake waste are stripped out. Chairside workflows also wipe out the two-week lag tied to physical impressions and resin models, improving case acceptance and reducing second appointments. Material spend for in-house crowns averages 17% of external lab invoices, with AI routines cutting manual design labor by 40 minutes per unit. Low-volume offices, by contrast, lean on leasing or pay-per-use models that neutralize obsolescence risk.
AI-Driven Generative Design for Complex Restorations
Artificial intelligence integration represents the most transformative trend in dental CAD, with generative design algorithms automating complex restoration geometry while maintaining clinical requirements and aesthetic preferences. VideaHealth's FDA clearance for over 30 AI algorithms marks the largest regulatory approval in dental AI history, enabling automated detection and treatment planning across virtually every disease state in dentistry. AI-powered design tools achieve 94% acceptance rates for automatically generated crown geometries, reducing design time through manual processes while improving consistency across different technicians. The technology extends beyond simple automation to predictive capabilities, with AI systems analyzing the creation of ent-specific factors, including occlusal patterns, material properties, and long-term wear characteristics. Machine learning algorithms trained on thousands of successful restorations can identify optimal design parameters for specific clinical scenarios. The integration challenge involves validating AI-generated designs against clinical outcomes, necessitating the use of independent datasets to prevent algorithmic bias and ensure diagnostic accuracy.[1]
Restraints Impact Analysis of Dental CAD Market*
| Restraint | (~) % Impact on CAGR Forecast | Geographic Relevance | Impact Timeline |
|---|---|---|---|
| High Upfront Capital Expenditure | -1.2% | Global, particularly smaller practices | Short term (≤ 2 years) |
| Limited Reimbursement for CAD/CAM Restorations | -0.8% | North America & Europe primarily | Medium term (2-4 years) |
| Cyber-Security & Data-Interoperability Risks | -0.6% | Global, with stricter EU regulations | Long term (≥ 4 years) |
| Technician Skills Gap in Parametric Modelling | -0.4% | Global, more acute in emerging markets | Medium term (2-4 years) |
| Source: Mordor Intelligence | |||
High Upfront Capital Expenditure
A premium chairside package can top USD 150,000 and depreciates over three to five years, forcing smaller offices to weigh loan payments against fluctuating case volumes. Annual service contracts and software subscriptions tack on 20-30% of list prices, while frequent firmware updates can mandate hardware upgrades. Leasing, revenue-share agreements, and design-as-a-service portals have emerged to cushion the blow, but each model imposes its own margin erosion and data-sovereignty questions.
Limited Reimbursement for CAD/CAM Restorations
Insurance schedules seldom differentiate between laboratory crowns and same-day CAD units, transferring extra material and equipment costs to patients. Chairside units therefore skew toward fee-for-service geographies or premium patient segments. Compliance adds further drag: digital audits require storage of STL, scan, and mill logs for up to 10 years in some states. Professional associations are lobbying insurers to craft new CDT codes that reflect the demonstrable reduction in remakes and secondary caries.
*Our forecasts treat driver/restraint impacts as directional, not additive. The impact forecasts reflect baseline growth, mix effects, and variable interactions.
Dental CAD Market Segment Analysis
By Component:
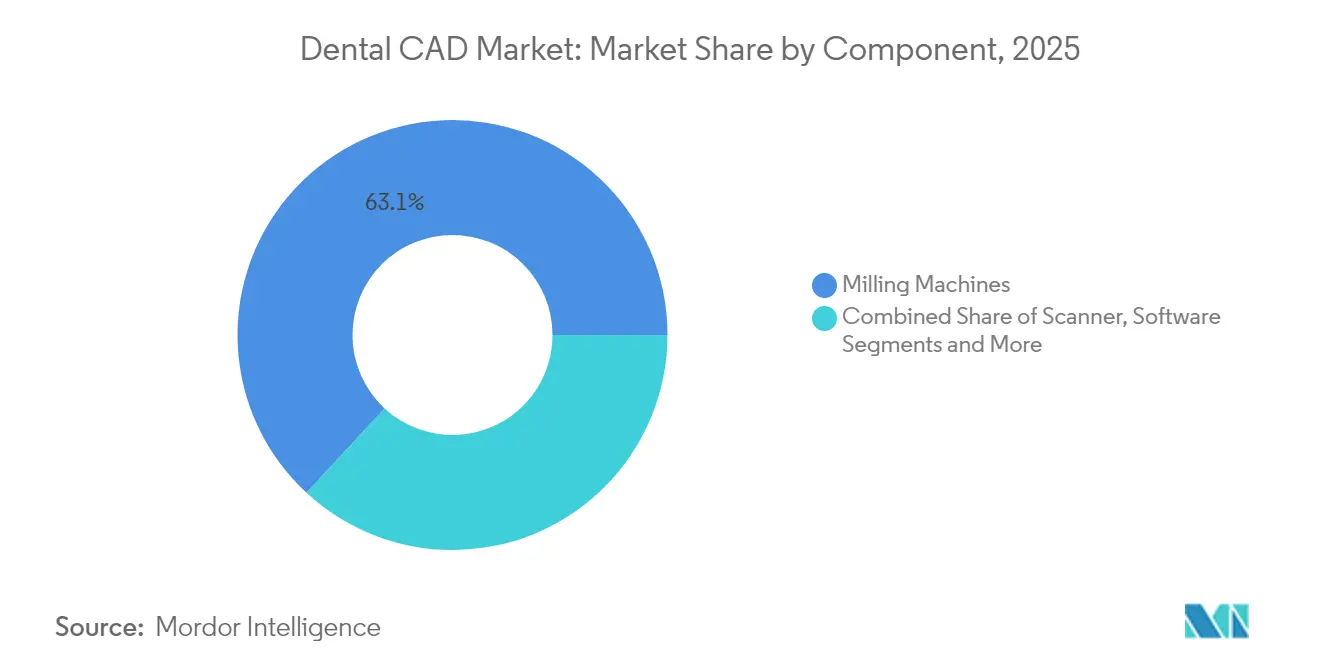
Software Captures Value as Hardware MaturesMilling units held 63.12% of the dental CAD market share in 2025, underscoring the indispensability of subtractive workflows for final zirconia and hybrid ceramic restorations. Entry-level mills list at USD 20,000-50,000, mid-range at USD 50,000-100,000, and flagship five-axis systems at USD 100,000-150,000, allowing clinicians to scale capacity to patient throughput. Scanner throughput leapt 53% over the last hardware generation, capturing full-arch data in under 40 seconds and pre-segmenting margin lines via embedded AI.
Software, however, is the fastest-growing component, with a 9.48% CAGR. Vendors are pivoting to subscription and cloud license bundles that smooth cash flows while continuously updating their AI models. Exocad’s DentalCAD 3.2 shipped AI Design to auto-generate crown libraries, whereas 3Shape Automate now closes roughly 94% of crown designs without technician touch-ups. Beyond design, platforms integrate case tracking, remote approval, and KPI dashboards, letting multi-site groups compare rounding errors and turnaround-time deltas. Open API philosophies are likewise proliferating to court niche startups that supply AI margin detection or shade-matching algorithms, deepening ecosystem stickiness.

By End User:
Laboratories Retain Scale, Clinics Chase Chairside SpeedDental laboratories accounted for 42.05% of 2025 revenue, driven by industrial-grade mills, sintering ovens, and technician expertise that enables the fabrication of multi-unit bridges and complex anatomical shading. Laboratories utilize robotic loading and 24-hour shifts to meet next-day delivery windows, often bundling design services so that dentists only need to supply scan images. Yet the dental CAD market is seeing laboratories invest heavily in AI-based nesting and auto-sinter scheduling to guard against chairside encroachment.
Dental clinics and hospitals comprise the fastest-growing end-user segment, growing at a 10.05% CAGR. Chairside systems shorten treatment plans, drive higher patient satisfaction scores, and eliminate freight costs. Margin realization rises once clinics exceed 25-30 crowns a month, prompting high-volume offices to internalize milling and glaze units. University hospitals, meanwhile, leverage in-house CAD suites for research trials, customizing scaffold designs for tissue engineering and producing surgical guides for maxillofacial reconstructions.
By Application:
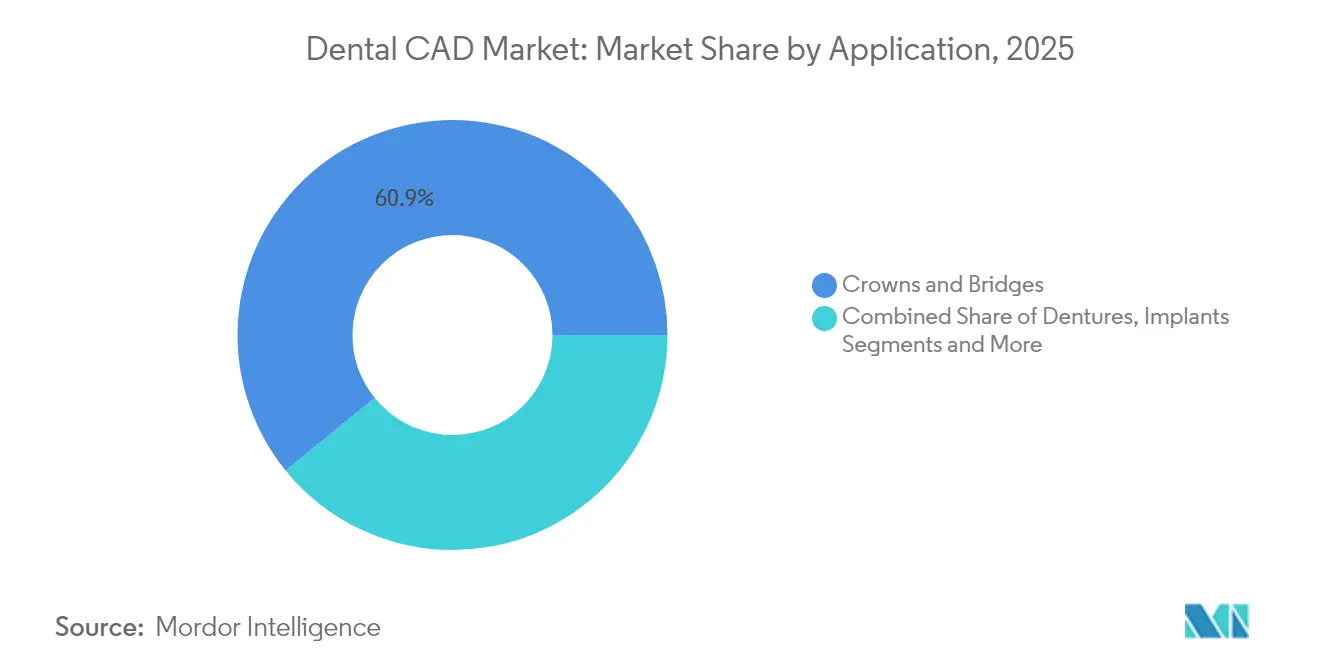
Implants Outpace Crowns in Growth VelocityCrowns and bridges captured 60.85% of the dental CAD market size in 2025, reflecting the elemental nature of single-tooth restorations in everyday practice. AI libraries now house over 10,000 morphology templates that pair with shade recommendation engines, enabling fresh graduates to produce esthetic crowns on par with veteran ceramists.
Implants, though smaller in absolute revenue, are advancing at an 10.62% CAGR. Planning modules integrate CBCT bone-density heatmaps and nerve-canal visualizations to map safe insertion corridors. Immediate-load cases benefit from mucosa-supported guides 3-D printed overnight, delivering provisional crowns within four hours of surgery. Beyond traditional fixtures, CAD workflows also craft patient-specific zygomatic implants and porous titanium meshes tailored for ridge augmentation, expanding the implants' domain into reconstructive niches.
Geography Analysis
Europe Dental CAD Market
Europe retained 32.20% of the dental CAD market revenue in 2025 thanks to substantial reimbursement, rigorous CE marking discipline, and early adoption of intraoral scanners across Germany, the United Kingdom, and France. CE compliance routines drive continuous software validation cycles, compelling vendors to roll out iterative updates and data-protection safeguards. Consolidation among continental laboratories fosters standardized production pipelines that tap five-axis mills and multi-chamber sintering furnaces, reducing per-unit labor overhead. Aging populations are driving demand for prosthetics higher, solidifying long-term volume growth.
APAC Dental CAD Market
The Asia-Pacific region is the sprint leader, forecasted to grow at an 11.08% CAGR through 2031. China and India are pouring capital into community oral-health clinics, while large private chains are opening implant-focused centers that advertise same-day crowns. Domestic hardware manufacturers now supply mid-range scanners and mills at 20-30% lower price points than European imports, augmenting affordability without sacrificing baseline precision. Governments in Japan and South Korea subsidize AI-driven diagnostic projects, enabling hybrid cloud architectures that comply with stringent patient data localization laws. Training remains a chokepoint, so vendors host certified academies in Bangkok and Shenzhen to accelerate clinician onboarding.
North America Dental CAD Market
North America presents a mature but still dynamic landscape. DSOs consolidate purchasing power, forcing vendors into national tender contracts that bundle hardware, license seats, and service SLAs. FDA clearances for AI design and diagnostic modules are gathering pace, but reimbursement frameworks are lagging, prompting practices to market CAD crowns as premium elective offerings.Data security compliance under HIPAA and state data breach statutes compels cloud providers to employ zero-knowledge encryption and redundant backups within continental borders. Market focal points have therefore moved from raw adoption to interoperability, uptime, and analytics-rooted ROI metrics.
Competitive Landscape
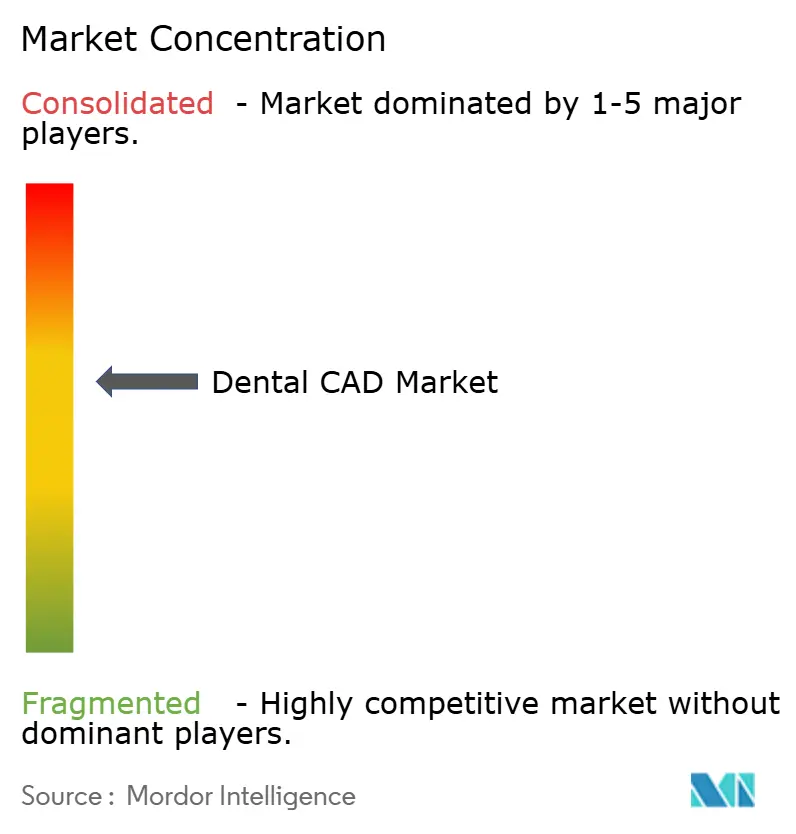
The dental CAD market exhibits moderate concentration, with the top five suppliers controlling an estimated half of the annual revenue, balancing between legacy manufacturers and AI-centric entrants. Align Technology’s EUR 376 million (USD 435.09 million) acquisition of exocad in February 2025 formed the world’s most comprehensive CAD-CAM ecosystem, combining clear-aligner leadership with laboratory-grade design breadth. Dentsply Sirona doubles down on vertical integration, pairing the Primescan 2 intraoral scanner with DS Core cloud to court DSO chains that prize distributed access control and MAC-agnostic interfaces. 3Shape focuses on open-architecture leadership, courting third-party AI plugins and offering pay-as-you-go design portals for small practices.
Start-ups like VideaHealth, Pearl, and Imagoworks focus on AI diagnostics that integrate into existing workflows, offering immediate chairside caries detection and auto-margin identification. White-space remains in geriatric and pediatric digital solutions, where morphology libraries and occlusion parameters must account for mixed dentition and compromised bone density. Competitive advantage hinges on speed to FDA clearance, dataset size, and the ability to integrate with lab ERP systems via standardized REST APIs. Vendors also compete via educational ecosystems, offering certificate pathways that teach scan capture best practices and AI result validation, thereby fueling downstream hardware demand.
Notably, cloud uptime and cybersecurity credentials now rival spindle RPM and micrometer precision on RFP documents. ANSI/ADA 1110-1:2025 provides a compliance benchmark for AI claims, prompting incumbents to open their algorithms for third-party auditing. Companies that ride this compliance curve early stand to win multinational accounts wary of liability exposure.
Dental CAD Industry Leaders
-
Dentsply Sirona
-
ZimVie Inc.
-
3Shape A/S
-
Align Technology (exocad GmbH)
-
Planmeca Oy
- *Disclaimer: Major Players sorted in no particular order
Dental CAD Market Companies Covered in this Report
- Dentsply Sirona
- Align Technology (exocad GmbH)
- 3 Shape
- Planmeca
- Ivoclar Vivadent
- Straumann Group
- Amann Girrbach
- Zirkonzahn GmbH
- Dental Wings Inc.
- Carestream Dental
- Roland DG Corp. (DGSHAPE)
- Shining 3D Tech Co., Ltd.
- Renishaw plc
- ZimVie
- Vatech Co., Ltd.
- Medit Corp.
- Kulzer
- 3M
- Bego GmbH & Co. KG
- Argen
Market Opportunities and Future Outlook
Software-led ecosystems are creating new whitespace for providers seeking faster design throughput without adding trained technicians or on-prem compute. This direction shows up in vendor roadmaps that push more automation into routine workflows, including 3Shape Dental System 2025 adding AI-bite alignment and automated margin line detection for denture workflows, and exocad shifting batched crown design and compute loads to cloud services. For multi-site DSOs and lab networks, standardized training and centralized QA fit these use cases, while platform integrations that connect intraoral scanning, case tracking, and restoration design gain practical value.
A second opportunity pocket is the convergence of dental CAD with regulated additive manufacturing for dentures and restorative indications, which extends digital production beyond subtractive milling. In March 2026, Stratasys reported CE Class IIa certification in Europe for its TrueDent solution for monolithic 3D-printed dentures, highlighting how certified materials and traceable workflows can support uptake in tightly regulated markets. On the clinical side, FDA clearance activity continues to broaden AI-enabled software use in dental workflows, including 3Shape receiving U.S. FDA 510(k) clearance in April 2026 for its Dx Software (Plus and Standard) for AI-assistive diagnostics using TRIOS intraoral scans, tightening the link from scanning data to downstream planning and design steps.
Recent Industry Developments in Dental CAD Market
- May 2026: Dentsply Sirona launched Smart View - Detect, an AI-enabled diagnostic aid for identifying periapical radiolucencies in CBCT scans, delivered through the DS Core platform. The release positions DS Core as a workflow hub where imaging, decision support, and downstream digital dentistry tools can be orchestrated within one environment.
- April 2026: 3Shape received U.S. FDA 510(k) clearance for 3Shape Dx Software (Dx Plus and Dx Standard) and proceeded with a U.S. launch later in the month. The clearance supports AI-assistive diagnostics using TRIOS intraoral scans and reinforces scanner-linked software modules as a growth lever alongside core CAD workflows.
- February 2026: 3Shape introduced updates in 3Shape Dental System 2025 at LMT LabDay, including AI-bite alignment to automate occlusion setup and AI-driven margin line detection for copy denture workflows. These enhancements are aimed at improving lab throughput and consistency, supporting higher case volumes with less manual CAD time per unit.
Dental CAD Market Report Scope and Research Methodology
Market Definition and Coverage
This market covers dental computer-aided design tools used to digitally design restorations and appliances, along with the closely linked enabling components that make the CAD workflow usable in clinics and labs. Revenue is counted in USD for sales and licensing tied to dental CAD usage across major regions.
Scope exclusions: We exclude non-dental CAD uses and general-purpose design software that is not primarily sold for dental workflows.
Segments Covered in This Report
- By Component
- Scanner
- Milling Machines
- Software
- Other Components
- By End User
- Dental Laboratories
- Dental Clinics & Hospitals
- Academic & Research Institutes
- By Application
- Crowns & Bridges
- Dentures
- Implants
- Orthodontic Appliances
- Other Applications
- By Geography
- North America
- United States
- Canada
- Mexico
- Europe
- Germany
- United Kingdom
- France
- Italy
- Spain
- Rest of Europe
- Asia-Pacific
- China
- Japan
- India
- Australia
- South Korea
- Rest of Asia-Pacific
- Middle East & Africa
- GCC
- South Africa
- Rest of Middle East & Africa
- South America
- Brazil
- Argentina
- Rest of South America
- North America
Data Sources, Market Sizing, and Validation
Desk Research
Desk work started by mapping what gets counted in dental CAD revenue and what does not, so the numbers do not accidentally drift into adjacent digital dentistry tools. We used public references such as the US FDA databases for cleared dental software and devices, CDC oral health indicators, and OECD health statistics to anchor demand direction and procedure intensity by geography.
To keep inputs practical, we also reviewed sources such as UN Comtrade for trade signals on relevant dental equipment, World Bank macro series for currency and inflation context, and peer-reviewed dentistry journals for adoption and workflow shifts (chairside versus lab-led). Company annual reports, investor presentations, and product price sheets were used to understand pricing structure, typical bundling, and the split between one-time and recurring software revenue. When needed, a paid subscription for company financials and a patent database were used to validate timing of launches and the durability of claims. The examples above are not exhaustive, and many other public sources were checked to collect, validate, and clarify data points.
Primary Interviews and Surveys
Primary work focused on confirming what is actually purchased and used in the dental CAD workflow across clinics, dental laboratories, and academic or research settings, followed by checks on how pricing moves as features and subscriptions change. Interviews and surveys also helped us test regional adoption differences across APAC, EMEA, and the Americas, and then tighten assumptions around replacement cycles, utilization, and the share of systems sold as part of integrated digital dentistry bundles.
Distribution of primary research fieldwork respondents
| Company type | Respondent position | Region |
|---|---|---|
| Top tier: 38% | CXOs: 15% | APAC: 39% |
| Mid tier: 44% | Functional/Unit leaders: 39% | EMEA: 36% |
| Smaller Players: 18% | Managers: 46% | Americas: 25% |
Market-Sizing & Forecasting
Sizing starts with a top-down build where dental restoration and appliance activity, digital penetration, and installed base replacement patterns are used to reconstruct the revenue pool for CAD-driven workflows by region. Because the market mixes hardware-led and software-led revenue, our model separates scanners, milling-related enabling components, and CAD software into consistent revenue buckets before totals are added.
The main inputs include the volume mix of crowns and bridges, dentures, implants, and orthodontic appliances, the share of cases designed digitally, and the average price movement for software licenses and subscriptions over time. We also track replacement cycles for connected equipment, clinic versus laboratory workflow share, and regional macro indicators that influence capital purchases. Results are then corroborated with selective bottom-up approximations using sampled price points, shipment and channel checks where visible, and revenue sanity checks against disclosed business lines, which helps us adjust for gaps when smaller private players do not publish detail.
For forecasting, scenario analysis is used, supported by expert views on adoption speed and pricing progression, and then refined with smoothing on the historical series where volatility is driven by one-time equipment cycles. Assumptions are kept simple enough to be repeated, and every change in penetration or pricing is traceable to a specific input rather than a broad growth multiplier.
Data Validation & Update Cycle
Validation is done through several checks, where model outputs are compared with independent signals such as procedure direction, product launch timing, and region-level purchasing sentiment collected in primary work. When a region or component line shows a sudden jump, the driver is reviewed, the assumption is challenged, and follow-up outreach is triggered if the explanation is not clear.
Before sign-off, the full workbook goes through an analyst review that tests arithmetic integrity, currency conversions, and year-to-year continuity so the story matches the numbers. Reports are refreshed annually, and interim updates are made when material events occur such as major pricing model changes, large regulatory shifts, or notable M&A. Right before delivery, a final pass is completed so clients receive the most current view available at that time.
Mordor Intelligence's Dental Cad Market Size Versus Other Published Estimates
Published market sizes for dental CAD often do not match because the timing and refresh cycle behind the numbers is different, and that affects currency conversion, inflation treatment, and how subscription pricing is annualized. Even when the label looks similar, some studies mix CAD-only revenue with broader CAD/CAM systems, which can shift totals noticeably.
In practice, the widest gaps come from how average selling prices are carried forward, especially when software moves from perpetual licensing to subscriptions and when bundles include adjacent hardware. Another frequent difference is whether the estimate is updated after major product launches or policy changes, since a one-year lag can overstate or understate growth in regions with fast adoption. The refresh-led checks used in this study, including consistent USD conversion timing and re-validation of ASP steps during the update cycle, are a key reason the Dental CAD value in Mordor Intelligence does not always align with older or scope-expanded figures.
Benchmark comparison
| Source | Market Size | Gaps in Research Methodology |
|---|---|---|
| Mordor Intelligence | USD 3.07 B (2025) | |
| Global Consultancy A | USD 2.40 B (2025) | Uses a broader dental CAD/CAM framing with a different base-year cut, and the public summary suggests a lower carried-forward ASP for software, which can compress the 2025 value. |
| Industry Publisher B | USD 2.81 B (2024) | Reports a 2024 base and a longer horizon, so the number is not directly comparable to a 2025 current-year value, and the scope can include in-office and in-lab system totals that blend CAD with adjacent manufacturing revenue. |
The table shows that year alignment and what gets bundled into the definition explain much of the spread, before any real difference in demand is assumed. When the scope is kept tight to dental CAD revenue and the pricing and currency steps are refreshed in a consistent way, the resulting market size becomes easier to reproduce and easier to reconcile with observable adoption signals.
Key Questions Answered in the Report
What is the current value and growth outlook for the dental CAD market?
The dental CAD market is worth USD 3.33 billion in 2026 and is projected to reach USD 4.96 billion by 2031, reflecting an 8.32% CAGR driven by AI automation, chairside workflows, and global DSO consolidation.
Which component leads spending today?
Milling machines dominate revenue with 63.12% share in 2025 because subtractive manufacturing remains essential for zirconia and hybrid ceramic restorations, even as software delivers the fastest growth.
Why are implants the fastest-growing application?
Implants benefit from demographic aging and CBCT-integrated CAD planning that enables micron-level accuracy; the segment is forecast to advance at an 10.62% CAGR through 2031.
Which region has the biggest share in dental CAD market?
In 2025, the Europe accounts for the largest market share in dental CAD market.
How do DSOs shape technology adoption?
DSOs leverage purchasing scale to standardize CAD platforms across multi-state networks, trimming training costs and boosting data analytics while steering vendor roadmaps toward cloud interoperability.