
Dental Bone Void Filler Market Size and Share
Market Overview
| Study Period | 2020 - 2031 |
|---|---|
| Market Size (2026) | USD 112.74 Million |
| Market Size (2031) | USD 151.18 Million |
| Growth Rate (2026 - 2031) | 6.04 % |
| Fastest Growing Market | Asia Pacific |
| Largest Market | North America |
| Market Concentration | Medium |
Major Players *Disclaimer: Major Players sorted in no particular order Image © Mordor Intelligence. Reuse requires attribution under CC BY 4.0. | |
Dental Bone Void Filler Market Analysis by Mordor Intelligence
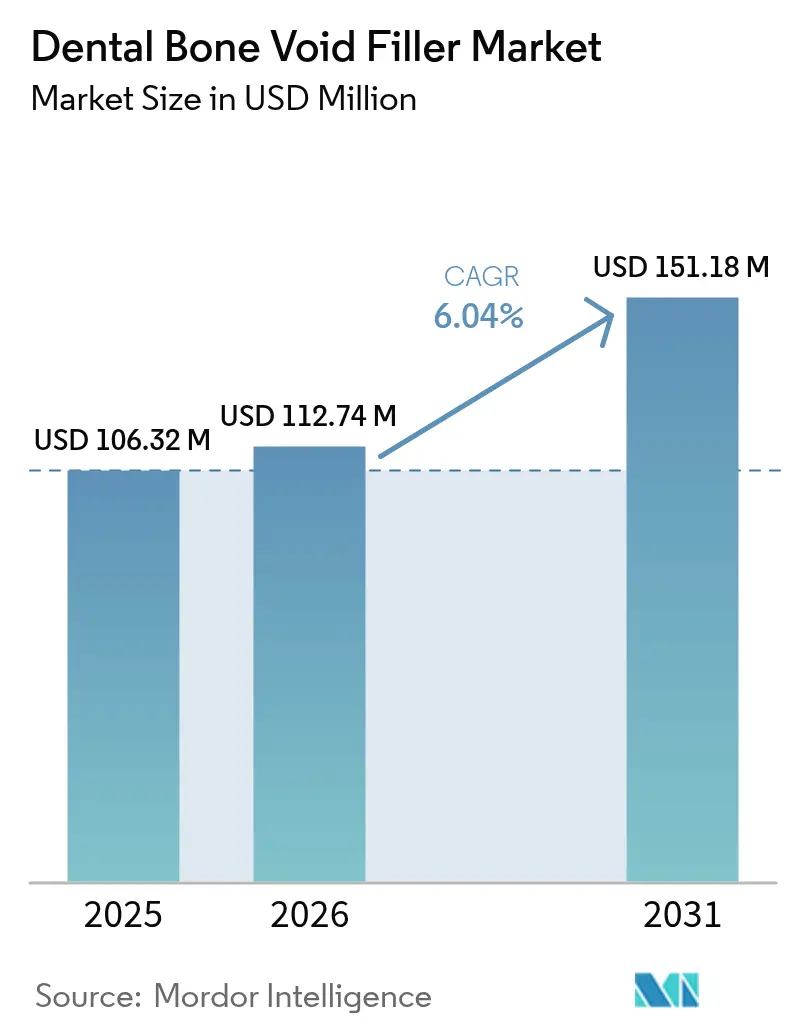
The dental bone void filler market size was valued at USD 106.32 million in 2025 and estimated to grow from USD 112.74 million in 2026 to reach USD 151.18 million by 2031, at a CAGR of 6.04% during the forecast period (2026-2031). Demand expands as aging populations require complex implant procedures, while next-generation bioceramics improve osteoinduction and address autograft morbidity. North American clinicians adopt premium biomaterials quickly because of robust reimbursement structures and well-defined regulatory pathways. Asia-Pacific registers the fastest growth as dental tourism, rising disposable incomes, and technology transfer accelerate high-value procedure volumes. Moderate industry fragmentation continues to narrow as leading device manufacturers invest heavily in 3D printing and nanotechnology to differentiate product portfolios.
Key Report Takeaways
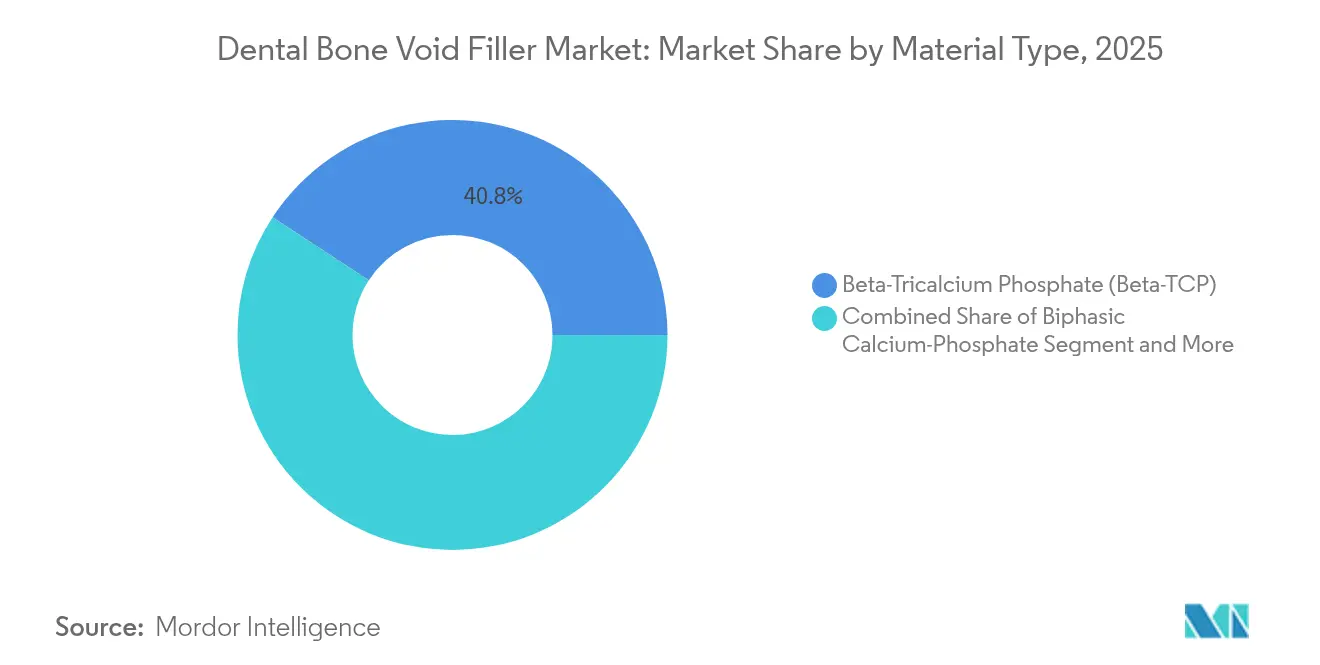
- By material type, β-tricalcium phosphate led with 40.78% of the dental bone void filler market share in 2025, whereas calcium-phosphate cements are projected to grow at a 9.03% CAGR through 2031.
- By form factor, granules accounted for 40.12% of the dental bone void filler market size in 2025; injectable formats are advancing at an 8.12% CAGR to 2031.
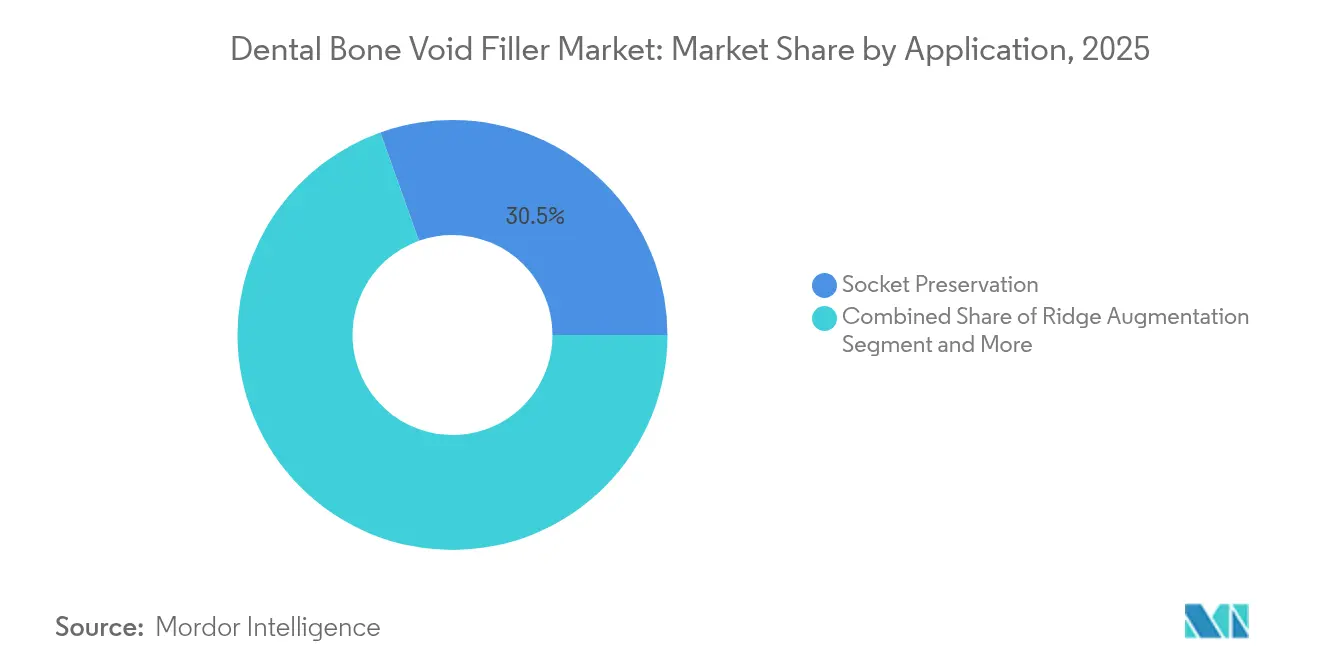
- By application, socket preservation held 30.45% revenue share of the dental bone void filler market size in 2025, while ridge augmentation is forecast to expand at a 9.01% CAGR.
- By end user, dental clinics captured 37.26% of the dental bone void filler market size in 2025, and ambulatory surgical centers record the highest CAGR at 8.37% through 2031.
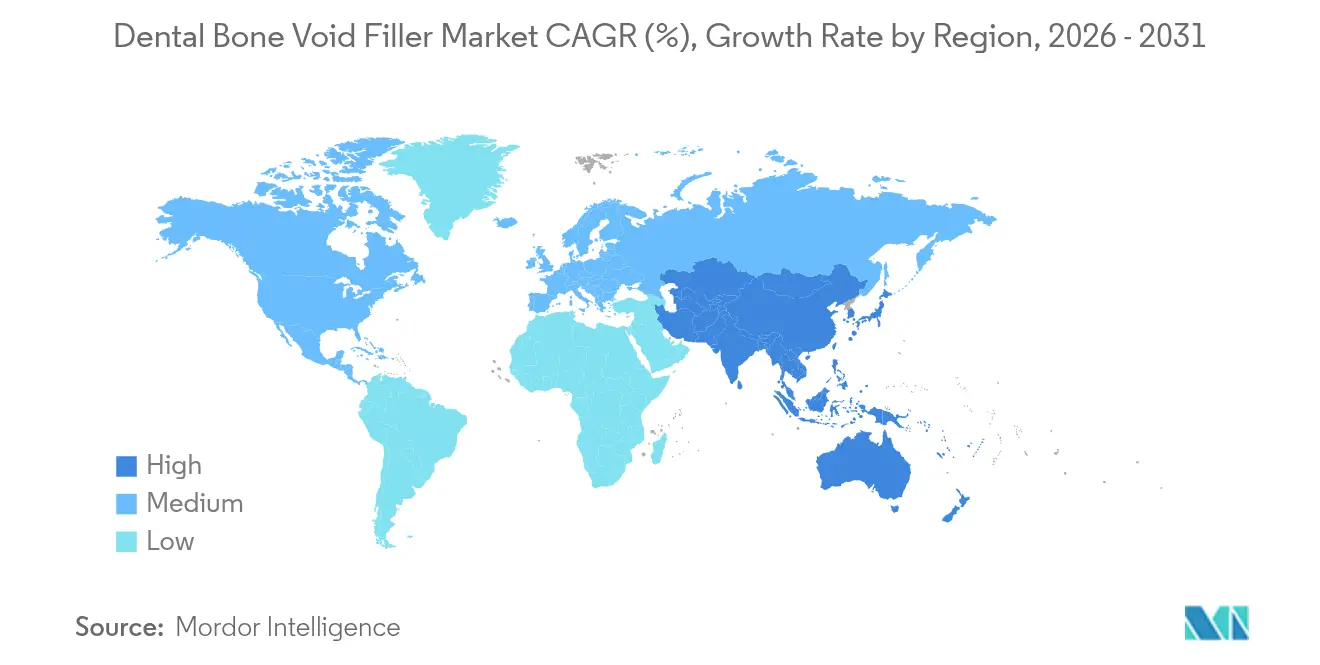
- By geography, North America commanded 35.41% of the dental bone void filler market in 2025, yet Asia-Pacific is growing at a 9.33% CAGR on the back of dental-tourism inflows.
Note: Market size and forecast figures in this report are generated using Mordor Intelligence’s proprietary estimation framework, updated with the latest available data and insights as of 2026.
Market Trends and Insights
Drivers Impact Analysis of Dental Bone Void Filler Market*
| Driver | (~) % Impact on CAGR Forecast | Geographic Relevance | Impact Timeline |
|---|---|---|---|
| Growing Adoption Of Bioceramics For Dental Reconstruction | +1.8% | Global, with early adoption in North America & Europe | Medium term (2-4 years) |
| Rapid Rise In Dental-Implant Procedures Among Aging Population | +2.1% | North America & Europe core, expanding to APAC | Long term (≥ 4 years) |
| Advances In Synthetic Biomaterials (Nano-HA, β-TCP) Enhancing Osteoinduction | +1.4% | Global, led by R&D centers in US, Germany, Switzerland | Medium term (2-4 years) |
| Chair-Side 3-D Printing Of Custom Graft Scaffolds | +0.9% | North America & Europe, emerging in urban APAC | Short term (≤ 2 years) |
| Dental-Tourism-Led Demand Surge In Cost-Competitive APAC & MEA Hubs | +1.2% | APAC core, spill-over to MEA | Short term (≤ 2 years) |
| Source: Mordor Intelligence | |||
Growing Adoption of Bioceramics for Dental Reconstruction
Next-generation, ion-doped hydroxyapatite and β-TCP formulations demonstrate superior bone formation and reduced inflammatory response. Fluorine-incorporated hydroxyapatite significantly accelerates socket healing by modulating macrophage activity. Clinicians embrace these synthetic options to avoid donor-site morbidity and achieve predictable outcomes. Broader regulatory acceptance and positive long-term data boost surgeon confidence. As prices stabilize, adoption permeates mid-tier markets, reinforcing the dental bone void filler market growth.
Rapid Rise in Dental-Implant Procedures Among Aging Population
A global cohort of more than 280 million older adults experiences tooth loss yet seeks fixed restorations rather than dentures. Implant success exceeding 95% when supported by quality grafts fuels procedure volumes. Age-related alveolar resorption necessitates bone augmentation, anchoring sustained demand for fillers. Public-health campaigns that emphasize oral health in senior care further lift procedure utilization. Consequently, the dental bone void filler market benefits from demographics that ensure multi-year procedural pipelines.
Advances in Synthetic Biomaterials (Nano-HA, β-TCP) Enhancing Osteoinduction
Nanostructuring increases surface area, improving protein adsorption and cellular attachment. Nano-hydroxyapatite doped with antibacterial ions offers mechanical strength and infection resistance. β-TCP now leverages controlled porosity to activate mesenchymal stem cells and shorten healing times[1]. Tailored degradation rates align scaffold resorption with new bone deposition, elevating clinician confidence. These innovations reduce reliance on allografts, bolstering adoption within the dental bone void filler market.
Chair-Side 3-D Printing of Custom Graft Scaffolds
Point-of-care printing converts CBCT data into patient-specific scaffolds during surgery, eliminating inventory delays. Open-source CAD-CAM software streamlines the workflow, while titanium or polymer meshes are fabricated in minutes. Surgeons achieve precise fit and reduced operative time, enhancing patient comfort. Cost curves decline as printer utilization rises, making personalization accessible beyond flagship centers. This digital shift differentiates forward-leaning providers in the dental bone void filler market.
Restraints Impact Analysis of Dental Bone Void Filler Market*
| Restraint | (~) % Impact on CAGR Forecast | Geographic Relevance | Impact Timeline |
|---|---|---|---|
| Unpredictable Resorption & Clinical Limitations Of Certain Bioceramics | -0.8% | Global, particularly affecting new material adoption | Medium term (2-4 years) |
| High Procedure Cost & Reimbursement Gaps | -1.2% | North America & Europe core, emerging markets affected | Long term (≥ 4 years) |
| Supply-Chain Risk For Xenografts Amid Tighter Zoonotic-Disease Surveillance | -0.6% | Global, with heightened scrutiny in regulated markets | Short term (≤ 2 years) |
| Source: Mordor Intelligence | |||
Unpredictable Resorption & Clinical Limitations of Certain Bioceramics
Interpatient variability in bioceramic degradation complicates treatment planning and implant stability. Highly porous scaffolds may fracture under load, restricting posterior-jaw usage. Systematic reviews highlight contamination risks that compromise biocompatibility. Regulators demand extensive post-market surveillance, lengthening product approval cycles. These uncertainties temper the dental bone void filler market expansion until next-wave formulations demonstrate consistent performance.
High Procedure Cost & Reimbursement Gaps
Many insurers classify bone grafting as elective, imposing strict clinical criteria and annual caps. Patients shoulder material and surgical fees that can exceed USD 3,000 per site, limiting uptake among middle-income groups. Multi-stage augmentations inflate costs further, creating socioeconomic disparities in care access. Emerging value-based payment models may eventually widen coverage, but near-term growth remains constrained. Affordability challenges particularly affect large-volume emerging markets, where out-of-pocket spending dominates dental expenditures.
*Our forecasts treat driver/restraint impacts as directional, not additive. The impact forecasts reflect baseline growth, mix effects, and variable interactions.
Dental Bone Void Filler Market Segment Analysis
By Material Type:
β-TCP Dominance Faces Injectable Innovationβ-tricalcium phosphate retains 40.78% share of the dental bone void filler market in 2025 because surgeons trust its resorption profile and osteoconductivity. Calcium-phosphate cements, advancing at a 9.03% CAGR, satisfy demand for injectable solutions that simplify minimally invasive techniques. Biphasic blends combine hydroxyapatite volume stability with β-TCP resorption, winning cases that need balanced remodeling. Recent cement upgrades shorten setting times and improve compressive strength, broadening indications beyond socket preservation. Growth prospects favor materials offering surgeon-friendly handling, predictable integration, and compatibility with digital delivery systems.
Procedural selection now hinges on clinical objective: fast-resorbing powders for sockets, slower materials for ridge augmentation. Regulatory approvals are accelerating as dossier evidence meets stringent safety endpoints. Supply resilience, aided by synthetic production, shields clinicians from xenograft shortages. Consequently, competitive intensity centers on proprietary ion-doping and nanostructuring that enhance bioactivity without escalating cost.

By Form Factor:
Granules Lead While Injectables Gain MomentumGranules commanded 40.12% of the dental bone void filler market in 2025, favored for versatility and straightforward application. Injectable formats rise at an 8.12% CAGR by providing precise placement through specialized cannulas and reducing surgical trauma. Putty and paste options fill irregular defects, while rigid blocks remain essential for non-contained augmentation. Customizable, chair-side printed scaffolds blur the line between traditional form factors and bespoke constructs.
Digitally guided delivery systems synchronize implant drills with graft injection, decreasing material wastage and operative time. Surgeons increasingly value closed syringe packaging that maintains sterility and eases workflow. As printing technologies mature, hybrid approaches—injecting a flowable phase around a printed core—promise enhanced stability and vascularization. Market acceptance will hinge on clinical evidence demonstrating that convenience does not sacrifice long-term structural integrity.
By Application:
Socket Preservation Leads Diverse Clinical NeedsSocket preservation represented 30.45% of the dental bone void filler market size in 2025, reflecting its routine adoption immediately after extraction. Ridge augmentation posts the fastest 9.01% CAGR because implant therapy often encounters insufficient native bone. Periodontal defect regeneration benefits from biomaterials that support vertical attachment gain, while peri-implantitis management sparks interest in antibacterial fillers. Sinus lifts and complex reconstructive cases populate the “others” category, each requiring tailored graft characteristics.
Guided tissue regeneration membranes complement grafts by excluding epithelium and stabilizing clot formation. Growth-factor-augmented fillers accelerate vascular ingrowth, shortening healing timelines and supporting early implant loading. Evidence-based protocols advise socket preservation to mitigate future augmentation, saving cost and morbidity. This preventive focus sustains steady material volumes even when implant placement is deferred.
By End User:
Dental Clinics Dominate Growing MarketDental clinics held 37.26% of the dental bone void filler market in 2025 thanks to integrated implant services and patient-centric care models. Ambulatory surgical centers, expanding at an 8.37% CAGR, optimize overheads and scheduling flexibility, attracting complex graft cases traditionally performed in hospitals. Multispecialty hospitals remain indispensable for medically compromised patients needing coordinated anesthesia and postoperative monitoring. Academic and research institutes drive early adoption of novel biomaterials and digital workflows, influencing private-sector standards.
Clinic chains invest in chair-side imaging, CAD-CAM, and on-site sterilization to deliver full-cycle implant rehabilitation. Insurance partnerships that bundle grafting into implant packages aim to soften out-of-pocket shocks. As procedure volumes migrate from hospital to outpatient settings, suppliers tailor product kits to smaller inventories and rapid turnover. Training programs emphasize standardized graft protocols, reinforcing repeatable outcomes and sustaining material pull-through.
Geography Analysis
North America Dental Bone Void Filler Market
North America maintained 35.41% of the dental bone void filler market in 2025, driven by sophisticated reimbursement, clinician familiarity with advanced biomaterials, and stringent FDA performance pathways that protect innovation investment. Premium pricing prevails because practitioners prioritize long-term success over material cost. Professional societies disseminate evidence-based protocols, accelerating uptake of ion-doped and nano-structured grafts.
APAC Dental Bone Void Filler Market
Asia-Pacific records a 9.33% CAGR through 2031 as dental tourism funnels international patients into cost-competitive hubs. Procedure pricing in destinations like Malaysia and Thailand averages 60–80% lower than in Australia or the United States, yet maintains robust quality benchmarks. Rising middle-class incomes and government spending on oral-health infrastructure amplify domestic demand. Multinational manufacturers localize production to benefit from tariff relief and supply-chain resiliency.
Europe Dental Bone Void Filler Market
Europe exhibits steady expansion supported by an aging populace and payer systems that reimburse evidence-backed biomaterials. Harmonized Medical Device Regulation fosters predictable approvals for synthetic grafts emphasizing sustainability and traceability. Swiss and German R&D centers collaborate with universities to refine calcium-phosphate chemistries, while the region’s cross-border directive facilitates patient mobility, allowing clinics in Spain and Portugal to attract Northern European patients seeking competitive pricing.
Competitive Landscape
The dental bone void filler market is moderately fragmented, yet consolidation intensifies as diversified device companies spin off non-core units to focus on biomaterials. ZimVie’s 2024 restructuring into a pure-play dental firm channelled capital toward 3D-printed scaffolds and sterilization technologies that have processed 11 million implants without infection. Johnson & Johnson earmarked a portion of its USD 50 billion annual R&D pool for nano-ceramic surfaces that promote faster osseointegration[3].
Strategic acquisitions target startups with proprietary ion-doping and bioactive-glass platforms, improving pipeline diversity. Partnerships with 3D-printer OEMs integrate material cartridges calibrated for dental indications, creating bundled solutions that lock in consumable demand. Supply-chain vigilance heightens after a nationwide tuberculosis outbreak traced to contaminated allografts in 2024 prompted urgent xenograft audits. As a result, synthetic producers highlight pathogen-free manufacturing to win share from biologics.
Competitive differentiation now hinges on digital ecosystems that link imaging, design, and graft delivery. Firms bundle treatment-planning software with chair-side printers and validated materials, creating service-oriented revenue models. Market entrants lacking end-to-end solutions struggle against incumbents that offer full digital workflows, clinical education, and robust post-market surveillance data.
Dental Bone Void Filler Industry Leaders
-
Curasan Inc
-
Graftys
-
Johnson & Johnson
-
Medtronic plc
-
Olympus-Terumo Biomaterials
- *Disclaimer: Major Players sorted in no particular order

Dental Bone Void Filler Market Companies Covered in this Report
- Medtronic
- Johnson & Johnson
- ZimVie
- Dentsply Sirona
- Geistlich Pharma
- Straumann Group
- BioHorizons
- RTI Surgical
- BoneSupport AB
- Graftys
- Olympus-Terumo Biomaterials
- Orthorebirth Co Ltd
- OsteoBiol (Tecnoss)
- Kuros Biosciences
- NovaBone Products
- Collagen Matrix
- Genoss
- Stryker
- LifeNet Health
- Curasan
Market Opportunities and Future Outlook
White space is opening for indication-specific solutions that move beyond passive osteoconductive granules toward bioactive and workflow-integrated formats, particularly for ridge augmentation and sinus lift where handling, stability, and predictable remodeling are key. In 2026, multiple clinical and regulatory signals supported this shift, including FDA clearance to begin a first-in-human dental pilot trial of RevBio's TETRANITE regenerative bone adhesive for ridge augmentation and Theradaptive completing patient enrollment in its RESTORE feasibility study evaluating OsteoAdapt DE in dental procedures. On the product access side, new clearances such as Hudens Bio's FDA 510(k) for BONTREE PLUS expand supply options in synthetics, aligning with provider interest in pathogen-free sourcing amid tighter surveillance for biologics.
Opportunity is also tied to distribution reach and outpatient workflows as procedure volumes shift toward clinic and ambulatory settings, where sterile, easy-to-use kits and injectable delivery can simplify adoption. June 2026 commercial deliveries by Osteopore in Malaysia via a DKSH Malaysia distribution partnership illustrate how channel build-out is being used to support fast-growing procedure hubs linked to dental tourism and localized purchasing. Alongside these commercial steps, ongoing R&D in 3D-printed and composite scaffolds, including recent preclinical work on low-temperature 3D-printed collagen/dentin constructs, reinforces demand for suppliers that can pair evidence, reproducible manufacturing, and digitally enabled delivery with calcium-phosphate cements and next-generation bioceramics.
Recent Industry Developments in Dental Bone Void Filler Market
- May 2026: Johnson & Johnson's DePuy Synthes entered an exclusive distribution agreement with CGBIO for NOVOSIS in the United States, Canada, and Australia. The agreement broadens access to a growth-factor-containing bone graft substitute across major developed dental implant markets. It also increases competitive pressure on incumbent graft portfolios as distribution scale and surgeon familiarity support adoption of newer regenerative options.
- January 2025: UnitedHealthcare updated its dental clinical policy for bone replacement grafts, clarifying criteria while maintaining elective-procedure restrictions. This policy framing shapes utilization for grafting tied to implants and augmentation, particularly in markets where coverage decisions drive patient out-of-pocket costs. Clearer criteria can also affect how suppliers support documentation and indications for use in provider settings.
- April 2024: ZimVie divested its spine division for USD 375 million, sharpening its focus as a pure-play dental company. The streamlined capital allocation supported investments around dental biomaterials and implant-adjacent technologies. Portfolio focus by major dental players can intensify product development and commercialization activity in graft materials used alongside implant procedures.
Dental Bone Void Filler Market Report Scope and Research Methodology
Market Definition and Coverage
This market covers biomaterial products used to fill or rebuild small bone voids in the jaw around dental procedures. The intent in the scope is to support bone formation before or during implant and graft related treatment.
Scope exclusions: It does not count autologous grafting, and it excludes bone void filler use in non-dental procedures such as orthopedic or spine cases.
Segments Covered in This Report
- By Material Type
- Beta-Tricalcium Phosphate (Beta-TCP)
- Biphasic Calcium-Phosphate
- Calcium-Phosphate Cements
- Others
- By Form Factor
- Granules
- Putty/Paste
- Injectable
- Blocks/Molds & Others
- By Application
- Socket Preservation
- Ridge Augmentation
- Periodontal Defect Regeneration
- Implant Bone Regeneration
- Others
- By End User
- Hospitals
- Dental Clinics
- Ambulatory Surgical Centers
- Academic & Research Institutes
- Geography
- North America
- United States
- Canada
- Mexico
- Europe
- Germany
- United Kingdom
- France
- Italy
- Spain
- Rest of Europe
- Asia-Pacific
- China
- Japan
- India
- South Korea
- Australia
- Rest of Asia-Pacific
- Middle East and Africa
- GCC
- South Africa
- Rest of Middle East and Africa
- South America
- Brazil
- Argentina
- Rest of South America
- North America
Data Sources, Market Sizing, and Validation
Desk Research
Desk research was used to set the demand context and to build the first cut of the country mix. We leaned on public sources such as the World Health Organization for oral health burden, the US CDC for dental health indicators, and the OECD Health Statistics for procedure and spend signals where available. For trade and supply-side checks, we reviewed import and export statistics from sources like UN Comtrade, along with customs and tariff schedules that help map relevant product codes.
To anchor product and innovation signals, we also checked regulatory and safety cues from agencies such as the US FDA and the European Commission medical device database pages, supported by peer reviewed dental journals and dentistry association publications. Company filings, investor decks, and reputable press were reviewed to understand product positioning, channel routes, and regional emphasis. Where needed, a paid subscription covering company financials and patent databases was used selectively to cross-check revenue visibility and IP activity. These sources are illustrative, and we also used other public documents and references for data collection, validation, and clarification.
Primary Interviews and Surveys
Primary work focused on validating how dental bone void fillers are used in real treatment pathways, and what drives ordering behavior at clinics and hospitals. We spoke with a mix of manufacturers, distributors, clinicians, and procurement roles across major regions so pricing ranges, utilization patterns, and near-term demand shifts could be confirmed. Inputs from these interviews were then fed back into the model assumptions.
Distribution of primary research fieldwork respondents
| Company type | Respondent position | Region |
|---|---|---|
| Top tier: 33% | CXOs: 14% | APAC: 46% |
| Mid tier: 52% | Functional/Unit leaders: 38% | EMEA: 32% |
| Smaller Players: 15% | Managers: 48% | Americas: 22% |
Market-Sizing & Forecasting
We built the market using a combined top-down and bottom-up approach. The top-down view started by reconstructing the treated procedure pool and then applying adoption and usage rates for dental bone void filler products. In practice, procedure volume signals for implant placement, socket preservation, and ridge augmentation were translated into likely filler usage. We then converted usage to value using average selling price ranges gathered from channel discussions.
Several market fingerprints were used as model inputs, such as implant procedure trends, tooth extraction patterns that lead to socket preservation, clinician preference shifts between synthetic and naturally derived materials, and observed price changes by formulation and pack size. Reimbursement pressure and out-of-pocket affordability were reflected through country level adjustment factors, since these factors influence whether graft support steps are added to treatment plans. Where public procedure data was thin, gaps were handled with proxy indicators, such as dentist density and clinic throughput signals, and then checked back with interview feedback.
Forecasting relied on scenario analysis, where procedure growth and material mix shifts were flexed under base, conservative, and faster adoption paths. The final forecast path was selected only after re-testing key drivers, especially procedure growth and price progression assumptions, with primary respondents to ensure the near-term story aligned with what they see.
Data Validation & Update Cycle
Validation was done through triangulation across demand signals, supply indicators, and pricing reality checks so the total was not driven by a single dataset. Outliers, like sudden jumps in implied volume per procedure or price levels that did not match channel feedback, were flagged and reviewed in a second analyst pass before sign-off.
We also compared country outputs against independent indicators, such as procedure momentum, regulatory timing, and trade movements where relevant. When a variance could not be explained with the documented assumptions, we re-contacted experts. The report is refreshed annually, with interim updates made when material events occur, and a final pre-delivery review is completed so clients receive the latest updated view.
Mordor Intelligence's Dental Bone Void Filler Market Size Measured Against Other Published Estimates
Published numbers for dental bone void filler can look different across sources because the product boundary is not always consistent, and because procedure-based demand is modeled in different ways. Differences also show up when some estimates use list prices versus realized selling prices, or when they apply a broader dental biomaterials umbrella and then allocate shares using high-level assumptions.
The table points to a spread that is largely explained by what is counted as a dental bone void filler and when it is counted. Some publishers blend adjacent graft substitutes or include clinic-applied biologics that are not sold as filler products. Under Mordor Intelligence's model, the value is built around dental-use bone void filler products at factory-gate prices and it excludes autologous grafting and non-dental applications, which keeps the demand pool tied to jaw procedures like socket preservation and ridge augmentation.
Benchmark comparison
| Source | Market Size | Gaps in Research Methodology |
|---|---|---|
| Mordor Intelligence | USD 112.74 M (2026) | |
| Global Consultancy A | USD 0.18 B (2026) | Uses a broader dental graft substitutes bucket and allocates a share to fillers, which can pull in barrier membranes and related dental biomaterials, and it often relies on list pricing without channel discount normalization. |
| Industry Association B | USD 0.09 B (2025) | Reports a prior-year value based on member-reported sales snapshots, which can miss non-member volumes and may apply simple currency conversion without consistent timing, leading to a lower or uneven global total. |
Taken together, the comparison suggests that the main differences come from scope boundaries and pricing treatment rather than from a fundamentally different demand trend. By tying value to a defined set of dental procedures, checking adoption and usage rates through interviews, and keeping pricing anchored to observed selling ranges, the sizing steps stay traceable and repeatable when the model is updated.
Key Questions Answered in the Report
What is the current size of the dental bone void filler market?
The market stands at USD 112.74 million in 2026 and is projected to reach USD 151.18 million by 2031.
Which material type holds the largest share?
Β-tricalcium phosphate leads with 40.78% of global revenue in 2025, reflecting strong clinical familiarity.
Why is Asia-Pacific the fastest-growing region?
Dental-tourism inflows, rising middle-class incomes, and localized manufacturing underpin its 9.33% CAGR through 2031.
How are 3D-printed scaffolds influencing the market?
Chair-side printing enables patient-specific grafts, reducing operative time and enhancing fit, thereby accelerating material adoption.
What are the main barriers to wider market uptake?
High procedure costs coupled with limited insurance coverage and variability in bioceramic resorption rates restrain near-term growth.