
Market Overview
| Study Period | 2021 - 2031 |
|---|---|
| Forecast Data Period | 2026 - 2031 |
| Base Year Market Size (2025) | 18.80 gigawatt |
| Market Volume (2026) | 20.14 gigawatt |
| Market Volume (2031) | 28.42 gigawatt |
| Growth Rate (2026 - 2031) | 7.12 % |
| Market Concentration | High |
Major Players *Disclaimer: Major Players sorted in no particular order Image © Mordor Intelligence. Reuse requires attribution under CC BY 4.0. | |
Denmark Power Market Analysis by Mordor Intelligence
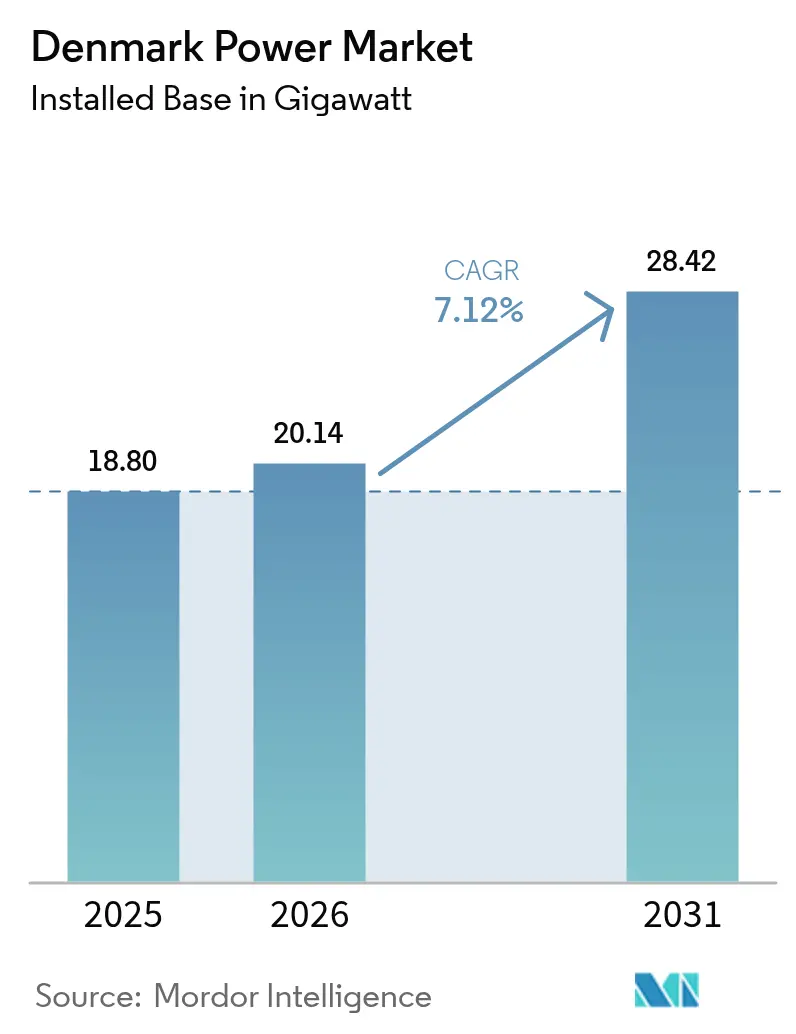
The Denmark Power Market size is expected to grow from 18.80 gigawatt in 2025 to 20.14 gigawatt in 2026 and is forecast to reach 28.42 gigawatt by 2031 at 7.12% CAGR over 2026-2031.
Growth is propelled by government-backed offshore wind tenders, rapid corporate renewable procurement, and the country’s emerging role as a Power-to-X export hub. Investments in grid digitalization, hybrid renewable installations, and battery storage keep momentum high even as onshore siting constraints tighten.[1]Danish Energy Agency, “Monthly Electricity Statistics,” ens.dk The Denmark power market already integrates 58.7% wind in its generation mix, turning the grid into a living laboratory for flexible technologies and cross-border energy trade, Danish Energy Agency. Industrial electrification and data-center expansion add fresh demand, while large-scale energy-island projects promise surplus-power exports to mainland Europe. Policymakers continue to align carbon taxes, permitting reforms, and interconnector funding, reducing investor risk and underpinning the Denmark power market’s long-term trajectory.[2]International Energy Agency, “Denmark 2024 Energy Policy Review,” iea.org
Key Report Takeaways
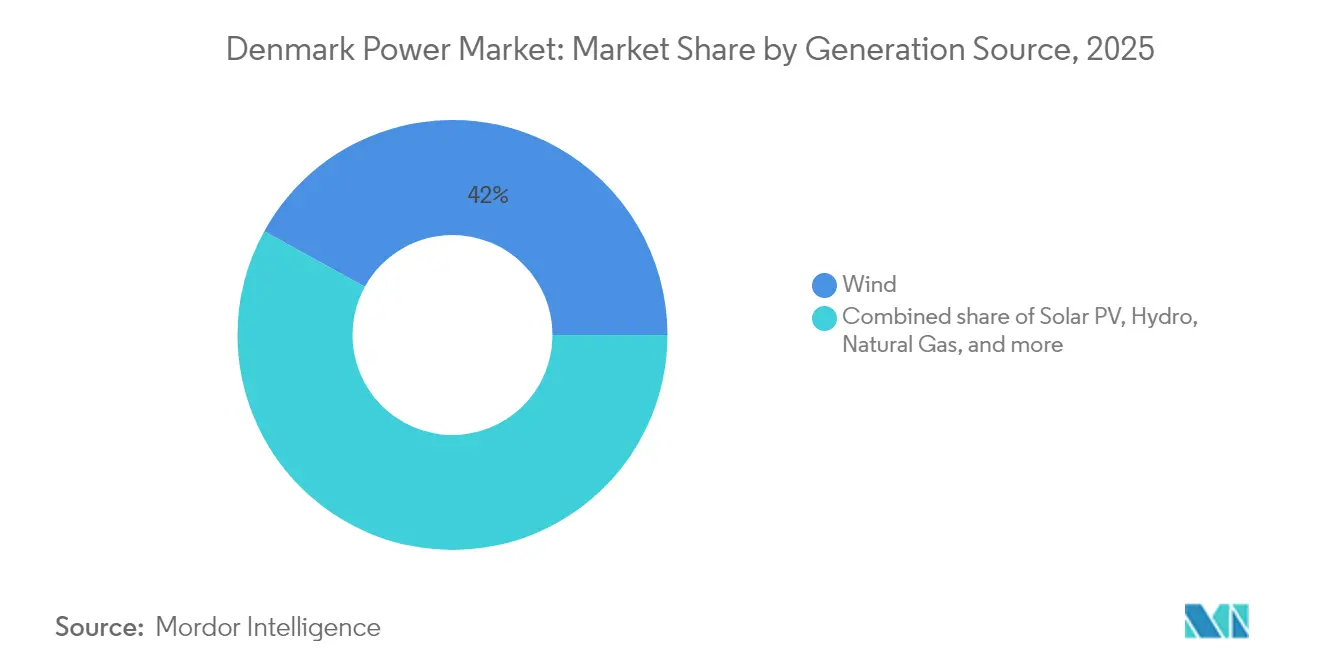
- By generation source, wind power led with 41.98% revenue share in 2025; solar PV is projected to expand at a 8.74% CAGR to 2031, securing the fastest-growing slot in the Denmark power market.
- By end user, the utilities segment held 59.35% of the Denmark power market share in 2025; the commercial and industrial segment records the highest projected CAGR at 8.12% through 2031.
Note: Market size and forecast figures in this report are generated using Mordor Intelligence’s proprietary estimation framework, updated with the latest available data and insights as of 2026.
Denmark Power Market Trends and Insights
Drivers Impact Analysis*
| Driver | ( ~ ) % Impact on CAGR Forecast | Geographic Relevance | Impact Timeline |
|---|---|---|---|
| Integration of renewable energy targets | +1.2% | North Sea regions | Medium term (2-4 years) |
| Rising corporate PPAs and green procurement | +0.8% | Hovedstaden, Midtjylland | Short term (≤ 2 years) |
| Accelerated offshore wind tender pipeline | +1.5% | North Sea coast, Bornholm Energy Island | Long term (≥ 4 years) |
| Electrification of district heating networks | +0.7% | Copenhagen metropolitan area | Medium term (2-4 years) |
| EU-mandated coal phase-out deadlines | +0.6% | Legacy thermal plant regions | Short term (≤ 2 years) |
| Surplus-power-to-e-fuels demand pull | +0.9% | Western Denmark | Long term (≥ 4 years) |
| Source: Mordor Intelligence | |||
Integration of Renewable Energy Targets
Sector coupling, storage, and 18 GW of planned offshore wind capacity make system-wide optimization the backbone of Denmark’s decarbonization model. Market Model 3.0 clarifies ownership rules for grid-supporting assets, unlocking private finance for batteries, hydrogen electrolyzers, and flexible demand. Surplus output during high-wind hours is increasingly steered into export lines, district-heating boilers, or Power-to-X plants, helping the Denmark power market reduce curtailment and stabilize prices.
Rising Corporate PPAs and Green Power Procurement
Denmark’s transparent certificate regime and stable contracts draw global brands into long-term PPAs. Better Energy’s 12 additional deals in 2024 and Bloomberg’s 15-year agreement with Ørsted exemplify a shift from compliance-driven buying toward strategic carbon-footprint control. [3]Better Energy, “Annual Report 2024,” betterenergy.com This pipeline secures predictable cash flows for new renewable capacity and strengthens the Denmark power market against wholesale price volatility.
Accelerated Offshore Wind Tender Pipeline
Tenders emphasizing innovation and hybrid energy-island integration differentiate Denmark from pure lowest-cost auctions. The 6 GW program ties capacity awards to Power-to-X readiness and local supply-chain content, encouraging novel cable, converter, and floating-foundation solutions. RWE’s Thor project, backed by a EUR 1.2 billion EIB loan, signals confidence that the Denmark power market can scale these concepts to commercial reality.
Electrification of District Heating Networks
HOFOR and Danfoss have begun data-centric pilot schemes where heat pumps modulate consumption to soak up excess renewable generation, tightening sector coupling. With half of Danish heat delivered via district systems, electrification adds a sizable, controllable load that supports grid balance while lowering urban emissions.
Restraints Impact Analysis*
| Restraint | ( ~ ) % Impact on CAGR Forecast | Geographic Relevance | Impact Timeline |
|---|---|---|---|
| Grid congestion in Western Denmark | -0.8% | Jutland peninsula | Short term (≤ 2 years) |
| Limited onshore siting and local opposition | -0.5% | Rural areas | Medium term (2-4 years) |
| Long lead-times for sub-sea HV cables | -1.1% | Offshore wind areas, interconnectors | Long term (≥ 4 years) |
| Scarcity of skilled wind-turbine technicians | -0.6% | Offshore regions | Medium term (2-4 years) |
| Source: Mordor Intelligence | |||
Grid Congestion in Western Denmark
Wind-rich Jutland often produces more power than its lines can carry eastward, triggering curtailment and undermining new-build economics. Energinet’s 172 km West Coast Connection will ease some pressure, yet completion stretches into the late 2020s, placing a near-term ceiling on renewable buildouts.[4]Energinet, “West Coast Connection Project Update,” energinet.dk
Long Lead-Times for Sub-Sea HV Cables
Global demand for XLPE and HVDC export cables has stretched delivery slots past four years. Denmark’s energy-island vision hinges on timely cable availability, so developers lock contracts early, tying up capital and complicating risk profiles.
*Our forecasts treat driver/restraint impacts as directional, not additive. The impact forecasts reflect baseline growth, mix effects, and variable interactions.
Segment Analysis
By Generation Source: Wind Dominance Drives Grid Innovation
Wind’s 41.98% share in 2025 underlines its position as the anchor of the Denmark power market. The upcoming North Sea energy-island hub and incremental offshore rounds push installed wind beyond 18 GW by 2030. Solar’s 8.74% CAGR balances daytime generation, especially where rooftop PV feeds urban substations. The Denmark power market size for wind is projected to widen further as hybrid layouts pair turbines, batteries, and electrolysers near Bornholm, damping variability and opening revenue from ancillary services.Biomass and biogas keep a near-steady output by leveraging agricultural residues and district-heating compatibility. Gas and oil assets drop into reserve mode, supplying inertia and black-start capability when the wind calms. With coal fully retired, the Denmark power industry prioritizes grid-forming inverters, synchronous condensers, and battery-based virtual inertia, ensuring stable frequency without fossil plants.


By Transmission & Distribution Infrastructure: Smart Grid Transformation
High-voltage transmission infrastructure is booming, reflecting Denmark's focus on grid backbone development to support renewable energy integration and regional interconnection. Smart metering infrastructure is rapidly growing, driven by regulatory mandates and consumer demand for energy management capabilities. Medium-voltage distribution networks require substantial upgrades to accommodate distributed generation and electric vehicle charging infrastructure, creating sustained investment opportunities. Low-voltage systems face increasing complexity from bidirectional power flows and prosumer integration, necessitating advanced control systems and monitoring equipment.
Transmission line investments prioritize offshore wind integration and cross-border interconnection capacity, with projects like the Viking Link enhancing Denmark's role as a regional energy hub Energinet. Substations and transformer upgrades focus on grid flexibility and renewable integration capabilities, incorporating advanced power electronics and control systems. The smart grid transformation encompasses infrastructure hardware and digital systems, creating opportunities for technology providers and system integrators. Grid digitalization enables new business models and services, from peer-to-peer energy trading to grid-scale optimization algorithms.
By End-User Consumption: Utilities Dominance Meets Commercial Electrification
Utilities handled about 59.35% of Denmark’s electricity use in 2025, mirroring an integrated system where transmission and distribution companies operate the grid and oversee wholesale trading. Their share grows as they modernize networks, add digital controls, and earn new income from grid-support services.
The spotlight, however, is shifting toward businesses. Electricity use in the commercial and industrial segments is rising at an 8.12% CAGR through 2031, a pace driven by firms swapping fossil-fuel equipment for electric alternatives and locking in long-term renewable power deals. Data centers sit at the heart of this surge: they create dense, round-the-clock loads that need tailor-made connections and guaranteed green supply. Households show a steadier demand line. Efficiency upgrades, smarter appliances, and widespread heat pump adoption keep residential consumption flat even as the population edges higher. Altogether, these shifts push Denmark’s grid toward a smarter, more flexible future where demand response, sector coupling, and rapid renewables growth work in tandem to deliver a low-carbon power system.
Geography Analysis
Denmark’s five NUTS-2 regions form an increasingly meshed network rather than isolated load pockets. Hovedstaden alone accounted for 38.10% of demand in 2025, underpinned by the Copenhagen metro’s advanced manufacturing and digital services sectors. Sjælland’s 7.43% CAGR signals a pivot as new 220 kV circuits tie Bornholm’s offshore hub into Zealand’s mainland grid, turning the island into a generation and hydrogen-export staging zone.Midtjylland and Nordjylland secure the lion’s share of onshore and near-shore turbines, yet they grapple with wind-linked congestion. Ongoing 132 kV reinforcements and synchronized curtailment platforms seek to unblock power flows to east-coast load centers, ensuring the Denmark power market can absorb incremental renewable builds without destabilization.Syddanmark blends biomass co-generation, port-side green-ammonia pilots, and heavy-industry consumption. Cross-border capacity with Germany brings price triangulation and arbitrage opportunities, while the Øresund link positions Hovedstaden as a balancing node between the Nordic and continental zones. Together, these geographic dynamics underscore how the Denmark power market is maturing from a domestic supply system into a regional trading and flexibility platform.
Regulatory Landscape
Denmark’s power market is primarily governed by the Electricity Supply Act (Elforsyningsloven). The Danish Energy Agency (ENS) sets sector policy and market rules, while Forsyningstilsynet (the Danish Utility Regulator) oversees competition, consumer protection, and regulated-network economics. From January 1, 2026, amendments strengthen retail-market consumer protection through tighter supplier requirements, including mandatory electronic identification and written acceptance for contracts, plus call recording for sales interactions, which raises compliance expectations for retail suppliers operating in the Danish detail market.
On system and market operations, Energinet continues to update market access and congestion-management mechanisms alongside network tariff reforms. It implemented flow-based capacity calculation for year-ahead capacity in October 2025 and is integrating it for month-ahead calculations during 2026, aligning cross-border capacity setting with the Nordic-continental trading environment. In parallel, the transition of network tariffs from energy-based toward capacity-based pricing changes incentives for peak-load management, while entry conditions such as the Datahub registration deposit (1 million DKK) create a solvency filter for new market participants.
Competitive Landscape
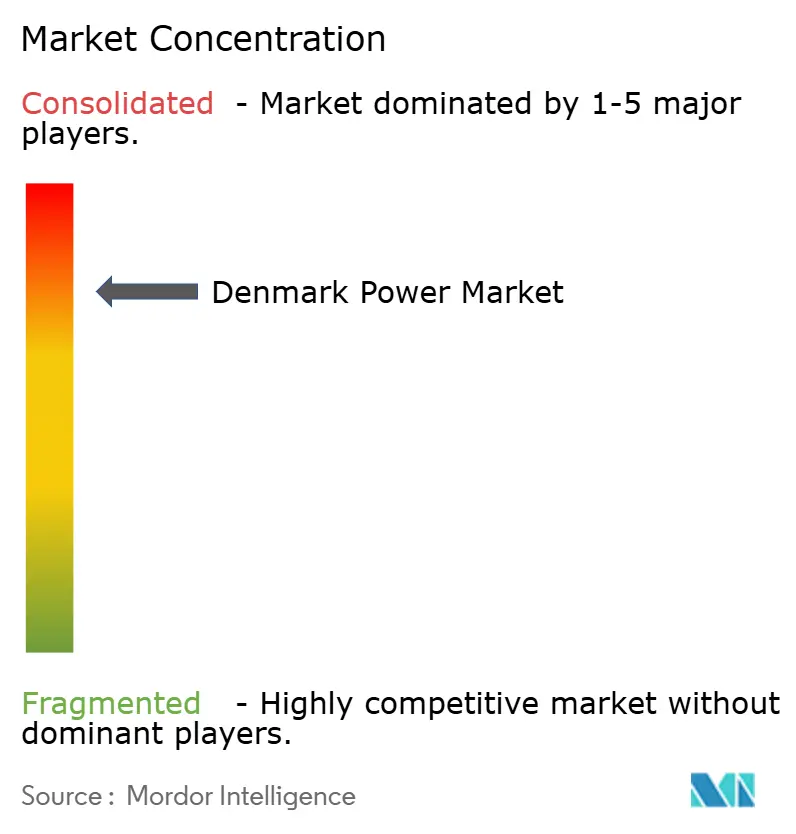
First-tier players hold sizable but not monopolistic positions, creating a concentrated arena where innovation counts. Ørsted eclipsed 10 GW of operating offshore wind in 2025, pairing assets with co-located batteries and entering selective project exits when risk profiles widened. Vestas supplied 17 GW of turbines in 2024 and is evolving service contracts into subscription-based performance packages. Vattenfall and RWE lean on integrated generation-to-retail models, seizing hybrid tender slots that reward storage and green-hydrogen attachments.
Mid-tier developers such as Better Energy and Eurowind diversify through solar-plus-storage farms and behind-the-meter PPA structures that anchor financing without merchant-price exposure. Grid-tech vendors—ABB, Siemens Grid Software, Hitachi Energy—embed virtual inertia and synthetic-grid services, selling value-added O&M that widens revenue per megawatt installed. The Denmark power industry also hosts niche specialists: Topsoe’s SOEC electrolyzers position it to capture Europe’s green-hydrogen wave, while NKT’s factory expansion enhances cable supply security for domestic and export projects.
Competition now turns on data leverage and lifecycle optimization. Predictive analytics cut turbine downtime, while algorithmic trading monetizes forecast accuracy across Nord Pool and GB hubs. Firms combining asset ownership, digital IP, and flexible-market access are set to secure disproportionate profit, keeping the Denmark power market technology-driven and globally relevant.
Denmark Power Industry Leaders
Ørsted A/S
Vattenfall A/S
Energinet (TSO)
European Energy A/S
Better Energy A/S
- *Disclaimer: Major Players sorted in no particular order

Market Opportunities and Future Outlook
Denmark’s offshore wind build-out and hybrid hub model creates demand across grid connection works, offshore electrical systems, and flexibility-enabling assets. The government-approved 3 GW offshore wind tender program (May 2025) and the legislative push in 2026 to finalize frameworks for offshore electricity production facilities with international grid connections support hybrid projects and energy-island architectures. Bornholm Energy Island, anchored on 3 GW of offshore wind with an option for an additional 800 MW and 525 kV HVDC links toward Denmark and Germany, creates multi-year demand for HVDC converters, export cables, onshore substations, and system services that support a wind-heavy system.
Grid access discipline and tariff reform are also shaping investable pathways for storage, demand response, and data-led optimization. Energinet completed 29 grid commissioning and infrastructure projects in 2025, and new, stricter grid connection requirements for industrial projects, battery parks, and data centers (announced May 2026, effective June 3, 2026) increase the value of mature, well-documented projects and technical solutions that reduce connection risk. Capacity-based network tariffs and flow-based capacity calculations strengthen the economics for peak-shaving and controllable load, supporting commercial routes for BESS, flexible district-heating electrification, and corporate procurement structures that bundle renewable supply with balancing capabilities.
Recent Industry Developments
- January 2026: Ørsted participated in signing the Joint Offshore Wind Investment Pact for the North Seas at the North Sea Summit 2026 in Hamburg. The pact formalizes cross-border coordination on offshore wind scale-up and risk-sharing, reinforcing Denmark’s role in the North Sea build-out pipeline and improving visibility for interconnector-ready project concepts.
- February 2025: Ørsted installed key components for the Kalundborg CO2 Hub at Asnæs and Avedøre power stations. The project links carbon capture with existing power and heat infrastructure, supporting decarbonization of CHP-linked systems while preserving district-heating value chains tied to the broader electricity market.
- August 2024: Ørsted shut down its last coal-fired power station, the Esbjerg Power Station. The action completes the company’s exit from coal in Denmark, increasing the system’s reliance on wind, solar, interconnectors, and flexibility resources for reliability and balancing.


Research Methodology Framework and Report Scope
Market Definition and Coverage
For this study, the Denmark power market is defined as the countrys electricity system measured mainly through installed generation capacity, with supporting views on how power is transmitted, distributed, and finally consumed.
Scope exclusions: The sizing does not treat upstream fuel extraction or downstream retail energy services as part of the electricity market total.
Segmentation Overview
- Generation (by Power Source)
- Wind (Onshore and Offshore)
- Solar PV
- Biomass and Biogas
- Hydro
- Coal
- Natural Gas and Oil
- Transmission and Distribution (Qualitative Analysis)
- End-User Consumption
- Utilities
- Commercial and Industrial
- Residential
Data Sources, Market Sizing, and Validation
Desk Research
Desk research was used to build the initial fact base and to align terminology across capacity, generation, and grid topics. The model was anchored on public energy statistics and system-level reporting, matching the way Denmark tracks capacity and grid performance in official publications.
Typical sources included official energy and grid publications such as the Danish Energy Agency, Energinet market and system reports, IEA electricity datasets, Eurostat energy balances, and IRENA renewable capacity series. These were supported by peer reviewed energy transition literature. Annual reports, investor presentations, and reputable press were also used to understand project pipelines, retirements, and policy timing. A paid subscription focused on company financials and patent tracking helped us sanity-check investment intensity and technology focus. This list is illustrative only, and many other public documents and datasets were also reviewed for data collection, cross-checking, and clarification.
Primary Interviews and Surveys
Fieldwork covers expert interviews and surveys with power producers, grid participants, project developers, traders, and electricity users active in Denmark. Respondents clarify expected capacity additions, commissioning delays, retirement assumptions, price direction, and the effect of interconnector and renewable project activity. Their input is used to address gaps in desk data and triangulate the final market model.
Distribution of primary research fieldwork respondents
| Company type | Respondent position |
|---|---|
| Top tier: 30% | CXOs: 20% |
| Mid tier: 45% | Functional/Unit leaders: 30% |
| Smaller Players: 25% | Managers: 50% |
Market-Sizing & Forecasting
The core sizing was built using a top-down reconstruction of Denmarks installed power capacity by technology, where official capacity series and announced project timelines are rolled forward year by year. To keep the total realistic, we then sanity-checked it with selective bottom-up approximations, such as sampling large project additions, retirements, and repowering events and testing implied build rates against known grid connection and auction activity.
Key inputs that shaped the model included installed capacity additions and retirements by fuel type, commissioning schedules for wind and solar, thermal unit closures, interconnector developments, and signals around electricity demand growth that are reflected in load and trade balance trends. Forecasting relied mainly on scenario analysis, where base case build-outs were adjusted using interview feedback on permitting speed, supply chain availability, and expected curtailment or grid bottlenecks. When project data was incomplete, gaps were handled by using conservative timing shifts and capacity factor informed plausibility checks, and then totals were rebalanced back to the most reliable official series.
Data Validation & Update Cycle
Validation was done through multiple cross-checks so the final totals stayed consistent with how the Denmark system behaves. We compared outputs to independent signals such as national load, production, and net import patterns, and then reviewed any sharp year-to-year jumps against known commissioning and retirement events.
Before sign-off, the model was reviewed in steps, including an internal analyst check for unit consistency and logic, followed by a variance review across sources and interview notes. If large discrepancies showed up, respondents were re-contacted to confirm assumptions like timing, capacity status, or technology classification. Reports are refreshed annually, and material events such as policy changes, major project delays, or sudden retirements can trigger interim revisions, followed by a final pre-delivery review to ensure the latest public data is reflected.
Mordor Intelligence's Denmark Power Market Size Compared With Other Published Estimates
Published estimates for the Denmark power market can look far apart because the word market is treated differently across studies, with some measuring installed capacity while others report revenue-like values tied to tariffs, trading, or retail activity. Differences also come from the year used as the base, whether imports are treated as supply, and how fast renewables are assumed to connect to the grid.
In our view, the biggest gap drivers are unit choice (GW versus USD), what is counted as part of the power system, and how project pipelines are filtered for delays, cancellations, and repowering. Some sources also mix generation, transmission, and retail value pools into one number, or apply aggressive build rates without checking them against permitting and grid constraints, which tends to lift the headline size.
Benchmark comparison
| Source | Market Size | Gaps in Research Methodology |
|---|---|---|
| Mordor Intelligence | USD 18.80 B (2025) | |
| Regional Consultancy A | USD 9.21 B (2025) | Uses a value-based definition in USD and may bundle trading, retail, and grid spending assumptions, which makes it not directly comparable to a capacity-led sizing view. |
| Industry Data Publisher B | USD 40.30 B (2025) | Uses electricity load in TWh as a headline indicator and can be misread as market size, which inflates comparisons versus installed capacity measures. |
The spread mostly reflects that one figure tracks physical capacity while the others use value or energy throughput proxies, so the numbers move for different reasons. By keeping the total anchored to installed capacity additions and retirements and then checking it against load and trade signals, the sizing stays traceable to repeatable steps, which is why the capacity-first treatment is applied by Mordor Intelligence.


Key Questions Answered in the Report
What is the current size of the Denmark power market?
The market reached 20.14 GW in 2026 and is projected to expand to 28.42 GW by 2031 at a 7.12% CAGR.
Which generation source dominates the Denmark power market?
Wind power leads with 41.98% share in 2025, supported by strong offshore expansion plans.
How fast is commercial and Industrial sector increasing their electricity demand?
Commercial and Industrial consumption is expected to grow at a 8.12% CAGR through 2031, driven by Copenhagen’s digital-infrastructure boom.
How important are offshore wind tenders to future capacity additions?
Government tenders covering at least 6 GW by 2031—plus energy-island projects—anchor most new capacity and attract sizable foreign investment.
Why are corporate power purchase agreements (PPAs) becoming central to market growth?
Long-term PPAs give industrial and digital-service firms price certainty and sustainability credits, helping finance new wind and solar farms.
What measures are in place to ease grid congestion in western Denmark?
Energinet’s 172 km West Coast Connection and other 400 kV upgrades aim to move surplus wind power eastward and slash curtailment risk.
Page last updated on:


 Your data is secure and never sold or shared.


