
Market Overview
| Study Period | 2020 - 2031 |
|---|---|
| Forecast Data Period | 2026 - 2031 |
| Base Year Market Size (2025) | USD 27.96 Billion |
| Market Size (2026) | USD 33.09 Billion |
| Market Size (2031) | USD 76.87 Billion |
| Growth Rate (2026 - 2031) | 18.38 % |
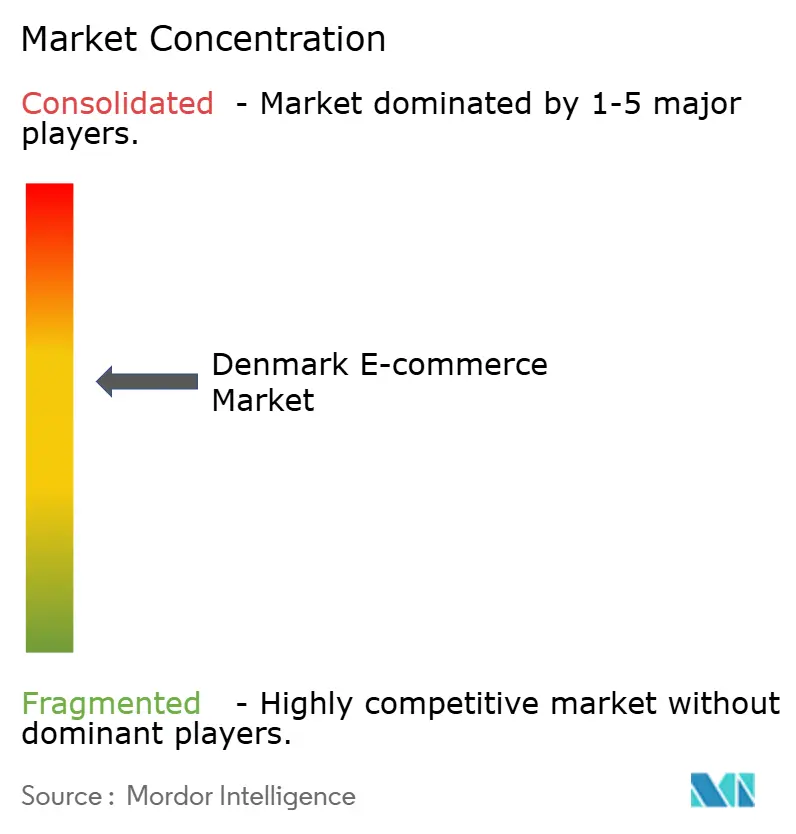
| Market Concentration | Medium |
Major Players *Disclaimer: Major Players sorted in no particular order Image © Mordor Intelligence. Reuse requires attribution under CC BY 4.0. | |
Denmark E-commerce Market Analysis by Mordor Intelligence
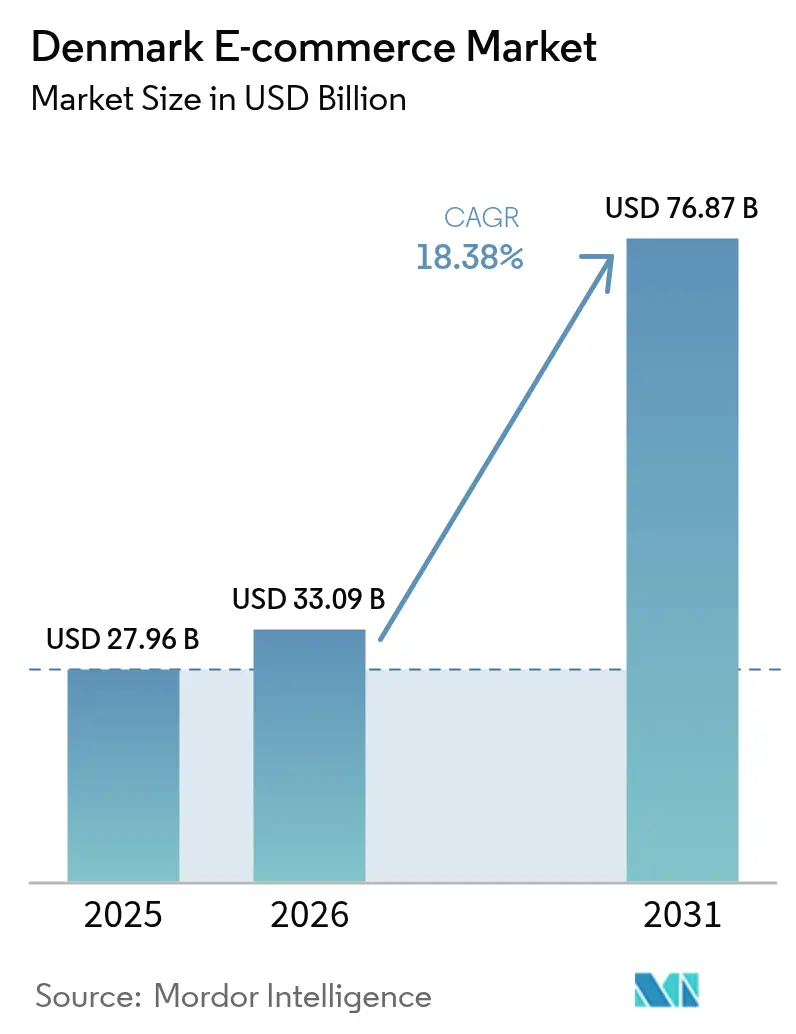
The Denmark e-commerce market size is expected to grow from USD 27.96 billion in 2025 to USD 33.09 billion in 2026 and is forecast to reach USD 76.87 billion by 2031 at 18.38% CAGR over 2026-2031. Accelerators include a 90% digital-payment penetration rate, 4.5 million MobilePay users, and the government’s USD 138 million Digital Growth Strategy that subsidises SME web-shop adoption.[1]Danmarks Nationalbank, “Payment Habits in Denmark,” nationalbanken.dk Foreign entrants such as Temu are intensifying price competition, yet domestic retailers respond with omnichannel investments that leverage Denmark’s dense parcel-locker network to promise nationwide same-day delivery. Regulatory tailwinds-most notably the Corporate Sustainability Reporting Directive (CSRD)—raise the strategic value of traceable online supply chains and favour digitally native operators. Stable macro-conditions, including 3.6% GDP growth and 2.0% inflation in 2025, further underpin consumer spending resilience.
Key Report Takeaways
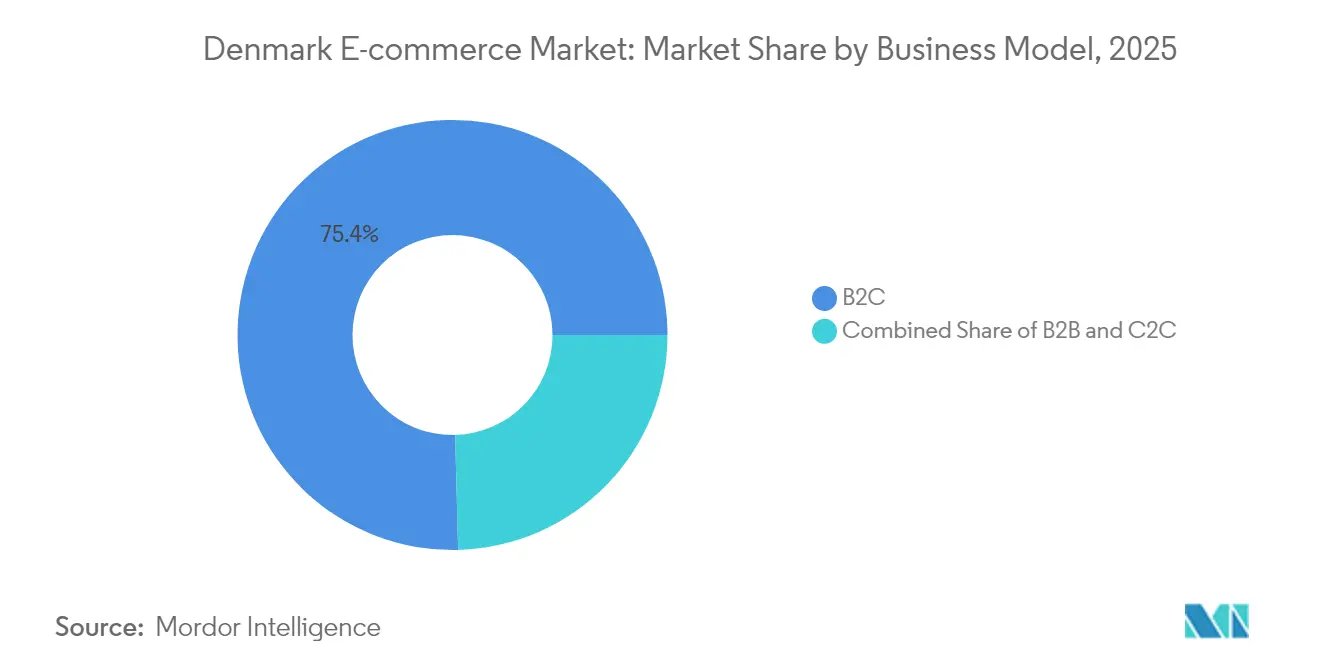
- By business model, B2C held 75.42% of the Denmark e-commerce market share in 2025; B2B is forecast to expand at a 21.20% CAGR through 2031.
- By device type, mobile commanded 59.02% of the Denmark e-commerce market size in 2025 and is set to grow at 22.07% CAGR to 2031.
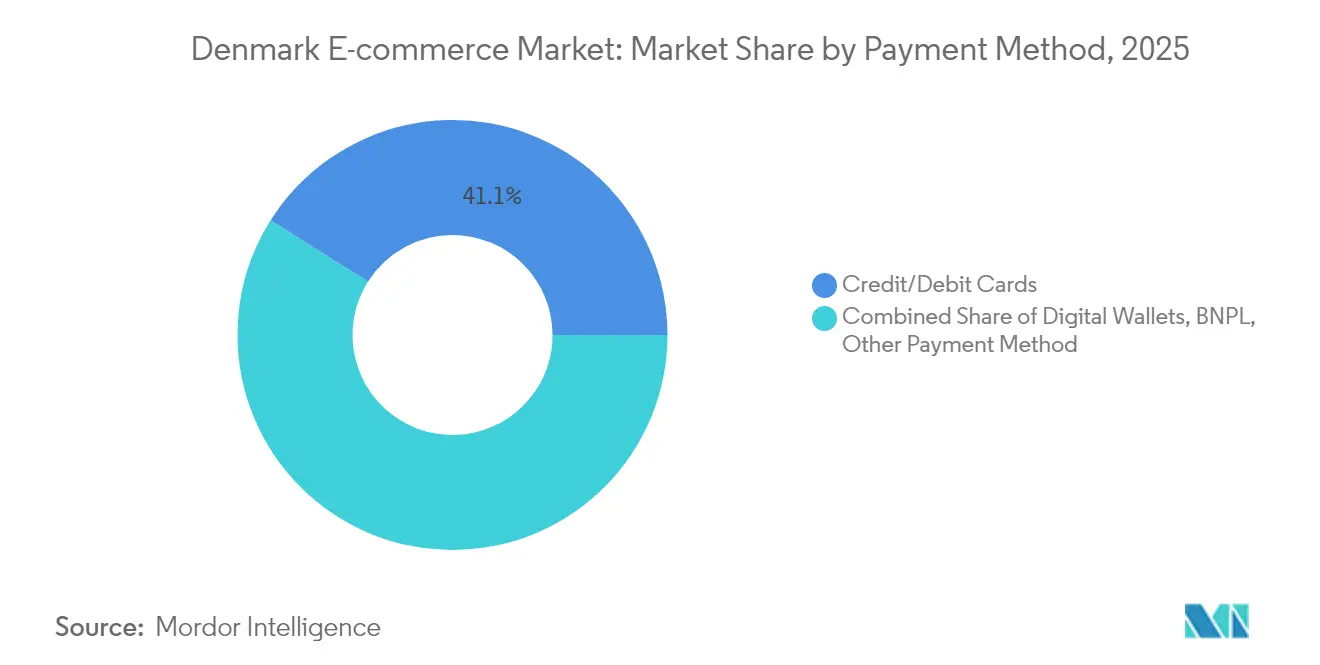
- By payment method, credit and debit cards retained a 41.05% share, while digital wallets are registering the fastest 23.46% CAGR.
- By B2C product category, fashion and apparel led with a 22.10% revenue share in 2025; food and beverages is projected to rise at a 24.12% CAGR through 2031.
Note: Market size and forecast figures in this report are generated using Mordor Intelligence’s proprietary estimation framework, updated with the latest available data and insights as of 2026.
Denmark E-commerce Market Trends and Insights
Drivers Impact Analysis*
| Driver | (~) % Impact on CAGR Forecast | Geographic Relevance | Impact Timeline |
|---|---|---|---|
| MobilePay-Led Digital-Wallet Ubiquity Accelerating Checkout Conversion Rates | +4.2% | National, with strongest penetration in urban centers | Short term (≤ 2 years) |
| Government 'Digital Growth Strategy 2023' Subsidising SME Web-shop Adoption | +3.8% | National, with priority focus on rural SMEs | Medium term (2-4 years) |
| Dense Parcel-Locker & Same-Day Logistics Network Enabling Less than 24 hr Delivery Promise | +3.1% | National, concentrated in Copenhagen, Aarhus, Odense metropolitan areas | Medium term (2-4 years) |
| CSRD Sustainability Mandate Driving Shift to Traceable Online Supply Chains | +2.7% | EU-wide, with Denmark as early adopter market | Long term (≥ 4 years) |
| Omnichannel Investments by Salling, Matas Converting Store Inventory to Online Fulfilment | +2.4% | National, with spillover effects to Nordic markets | Medium term (2-4 years) |
| Source: Mordor Intelligence | |||
MobilePay-led digital-wallet ubiquity accelerating checkout conversion rates
MobilePay covers 77% of Denmark’s population, delivers instant settlement, and lowers abandonment by 15-25% versus card-only checkouts. Retailers gain higher conversion without absorbing interchange fees, and B2B platforms benefit from the same API stack that automates invoice payments. The entrenched network effect raises consumer switching costs and presents an entry barrier for foreign marketplaces that lack domestic wallet parity. As wallet usage spreads to subscription and pay-by-link services, Danish merchants unlock recurring-revenue models and deeper customer data. Conversion gains translate into incremental GMV, pushing the Denmark e-commerce market toward scale advantages.
Government ‘Digital Growth Strategy 2023’ subsidising SME web-shop adoption
The state has earmarked USD 138 million through 2027 to train SMEs, co-fund platform builds, and embed cybersecurity tools.[2]U.S. Department of Commerce, “Denmark – Digital Economy,” trade.gov Six regional business houses give hands-on guidance, shortening the learning curve for rural firms previously deterred by compliance complexity. Subsidies offset onboarding costs to leading SaaS carts, broadening merchant diversity and category breadth. As rural merchants digitise, parcel volumes spread beyond major cities, raising utilisation of the locker network and supporting logistics price deflation. The programme also emphasises data analytics upskilling, enabling SMEs to refine assortment and pricing in real time.
Dense parcel-locker and same-day logistics network enabling < 24 h delivery promise
Parcel-locker penetration reaches 41%, the highest in the Nordics, and integrates with public-transport nodes for frictionless collection.[3]International Post Corporation, “Delivery Choice – Parcel Lockers,” ipc.be PostNord and retailers such as Salling Group optimise last-mile routes, cutting delivery costs and carbon footprints. Locker density allows national same-day SLAs at a fraction of courier-to-door economics. Fashion and consumer-electronics segments see uplift as immediacy influences basket conversion. Higher service levels form a defensible moat against cross-border entrants that cannot replicate infrastructure without heavy capex.
CSRD sustainability mandate driving shift to traceable online supply chains
From 2026, Danish companies must disclose cradle-to-gate impact metrics, compelling investment in digital ledgers and verifiable ESG tags. Platforms that automate emissions tracking gain a pricing premium and lower merchant churn. Sustainability-oriented consumers—59% of millennials are ready to pay more—reward compliant merchants, expanding green product GMV. CSRD also accelerates B2B adoption as corporates need auditable procurement trails, reinforcing the Denmark e-commerce market’s pivot to enterprise grade platforms.
Restraints Impact Analysis*
| Restraint | (~) % Impact on CAGR Forecast | Geographic Relevance | Impact Timeline |
|---|---|---|---|
| Foreign Platforms (Temu, Amazon) Intensifying Price-Based Competition | -3.4% | National, with spillover effects across Nordic markets | Medium term (2-4 years) |
| High Delivery-Cost Sensitivity Hinders the Market | -2.8% | National, with strongest impact in rural and suburban areas | Short term (≤ 2 years) |
| GDPR & Local-Data Residency Rules Inflating Compliance Costs for SME E-tailers | -2.1% | EU-wide, with Denmark facing stricter enforcement | Long term (≥ 4 years) |
| Ageing Cohort Lagging Digital Adoption Despite Overall 99% Internet Access | -1.7% | National, with higher concentration in rural areas | Long term (≥ 4 years) |
| Source: Mordor Intelligence | |||
High delivery-cost sensitivity hinders the market
More than 40% of Nordic consumers drop baskets when delivery charges exceed personal thresholds, a behaviour amplified outside metro areas. Although parcel-locker density alleviates costs, grocery and low-ticket items still struggle to absorb fees without eroding retailer margins. Inflation-driven budget vigilance persists despite headline price easing, pushing merchants toward free-shipping thresholds and membership models that compress gross margin. The Denmark e-commerce market faces a balancing act between service differentiation and price elasticity.
Foreign platforms (Temu, Amazon) intensifying price-based competition
Temu became Denmark’s third-largest webshop in 2024 by deploying aggressive discounting. Amazon’s Nordic logistics hub further tightens pricing benchmarks. While choice expands for consumers, domestic players confront margin compression. Danish incumbents emphasise speed, sustainability, and local customer care to defend share, but these differentiators require continuous investment. EU product-safety probes into Temu introduce regulatory uncertainty, yet price wars are expected to persist through the medium term.
*Our forecasts treat driver/restraint impacts as directional, not additive. The impact forecasts reflect baseline growth, mix effects, and variable interactions.
Segment Analysis
By Business Model: Digital procurement momentum reshapes corporate buying
B2C controlled 75.42% of 2025 GMV, yet B2B’s 21.20% CAGR indicates a structural pivot as Danish SMEs migrate indirect spend online. The Denmark e-commerce market size for B2B orders is projected to double between 2026 and 2031 as firms seek catalogue consolidation and CSRD-ready reporting. Domestic platforms leverage MobilePay Business to automate reconciliation, while Zalando’s ZEOS and Salling Group’s wholesale APIs unlock cross-border reach. Higher average order values and lower return rates lift unit economics. Local preference for Danish language interfaces and ESG compliance tilts advantage toward home-grown platforms, limiting the appeal of generic international marketplaces.
Sustainability legislation accelerates vendor audits, and B2B portals integrating emissions calculators become default procurement engines. Meanwhile, B2C leaders experiment with marketplace models to monetise excess traffic and open new revenue streams. C2C remains niche but synergises with circular-economy initiatives endorsed by regulators, adding to overall market diversification.


By Device Type: Mobile-first commerce drives engagement across age cohorts
With 59.02% 2025 share, smartphones are the primary storefront and are forecast to reach 69.5% by 2031 at a 22.07% CAGR. The Denmark e-commerce market share advantage stems from ubiquitous 5G coverage and user familiarity with MobilePay’s one-tap flow. Retailers invest in PWA architecture to accelerate page loads and lower bounce rates. Location-based flash sales boost in-store traffic for omnichannel chains and blur lines between online and offline experiences.
Desktop remains relevant for complex, high-ticket items such as furniture or B2B requisitions where large screen and multitab research aid decision making. Emerging devices-smart TVs, in-car infotainment, voice assistants-collectively stay below 5% share yet represent experimentation ground for frictionless reordering and shoppable media formats, extending the Denmark e-commerce market’s touchpoints.
By Payment Method: Wallet adoption challenges card incumbency
Credit and debit cards still command 41.05% transaction share, but digital wallets post a 23.46% CAGR that could swing majority status by 2031. Wallet superiority lies in instant settlement, built-in authentication, and loyalty integration. BNPL grows among Gen Z, though the Financial Supervisory Authority’s consultations temper unregulated expansion. For merchants, wallet fees are competitive with acquiring costs while delivering data advantages that fuel personalisation.
Card networks remain indispensable for cross-border sales and high-ticket B2B invoices; therefore hybrid checkout stacks stay the norm in the Denmark e-commerce industry. Banks respond with tokenised card-on-file solutions to match wallet UX, ensuring frictionless multi-currency capability for foreign shoppers and sustaining inbound tourism spend.
By B2C Product Category: Fashion leadership meets grocery disruption
Fashion and apparel delivered a 22.10% share of 2025 GMV, benefiting from liberal return policies and AI-powered size recommendation models. Zalando’s planned ABOUT YOU acquisition signals further consolidation and data synergy. At the same time, food and beverages is the breakout category with a 24.12% CAGR as locker-to-fridge solutions and insulated click-and-collect expand reach. The Denmark e-commerce market size for online groceries is projected to outpace overall retail growth, supported by household time-saving priorities.
Consumer electronics sustain mid-teens growth, leveraging showrooming and trade-in programs to refresh upgrade cycles. Beauty and personal care gains as omnichannel chains like Matas merge digital tutorials with in-store diagnostics. Furniture and home goods confront bulky-item logistics but ride on Denmark’s design heritage and conscious-consumer trends. Smaller niches-from DIY to toys-capture equilibrium growth anchored by seasonal campaigns and influencer collaborations.
Geography Analysis
Urban concentration remains pronounced, with the Greater Copenhagen area accounting for an estimated 44.62% of national GMV in 2025. Same-day promise reliability tops 98% in the capital region, creating a benchmark that spreads to Aarhus and Odense as locker density climbs. Rural adoption, however, records faster percentage growth, spurred by state-funded broadband and SME digitisation grants. The Denmark e-commerce market enjoys a compact landmass that keeps average delivery distances under 300 km, sustaining cost efficiency.
Cross-border flows are seamless thanks to EU consumer-rights alignment; German and Swedish shoppers frequently utilise Danish domains for design goods, making Denmark a Nordic fulfilment hub. Currency conversion from Danish Krone to EUR introduces minor friction that multicurrency wallets increasingly absorb. National internet penetration stands at 99% and underpins uniform consumer reach.
Trade-fragmentation risk remains the chief geographic headwind, as shipping disruptions raise input costs. Yet diversified sourcing across EU, UK, and Asian suppliers mitigates single-region dependency. Denmark’s early CSRD compliance positions its merchants to attract sustainability-minded consumers in neighbouring markets where disclosure rules lag, converting regulation into competitive advantage.
Regulatory Landscape
Denmark's e-commerce rulebook is anchored in EU-aligned consumer, platform, and data obligations, with the E-commerce Act (No. 227 of 2002) setting baseline requirements on information disclosure, commercial communication, and contract formation for online services. The EU Digital Services Act has applied since February 2024, increasing duties for intermediary services and online platforms operating in Denmark, while GDPR enforcement remains a material compliance factor for merchants running analytics, personalization, and cross-border data flows.
Consumer-protection requirements tightened further in 2026 through changes to the Consumer Contracts Act, which require a visible digital withdrawal function on online interfaces for consumer contracts from June 2026. On the trust and identity side, the Danish Agency for Digital Government supervises digital trust services. From April 2026, it also advanced hybrid signing options supporting both OCES and qualified signing, which raises the value of eIDAS-aligned signature and authentication capabilities for merchants, marketplaces, and B2B ordering portals that rely on digital approvals.
Value Chain Analysis
The Denmark e-commerce value chain begins with merchants and marketplaces sourcing inventory domestically and via cross-border suppliers, then converting demand through web and app storefronts, where payment acceptance (cards and wallets such as MobilePay) and risk controls shape checkout completion. Orders move into warehousing and fulfillment, including store-based picking for omnichannel players, and then to last-mile operators. Denmark's dense parcel-locker ecosystem and national delivery networks support fast delivery and lower failure rates at collection points, while returns handling is an especially sensitive downstream node for categories like fashion.
Enablers and governance increasingly influence competitiveness across the chain. Greater Copenhagen functions as a logistics hub for Nordic distribution, and the government's Digital Growth Strategy supporting SME web-shop adoption expands the merchant base that drives parcel and locker volumes. Sustainability reporting pressure under CSRD elevates traceability needs, adding requirements around packaging and environmental monitoring that affect supplier selection, product data management, and carrier choices.
Competitive Landscape
Denmark’s e-commerce arena is moderately fragmented. The top five players control roughly 45% of GMV, leaving room for specialised disruptors. Zalando dominates fashion, leveraging algorithmic personalisation and an expanding fulfilment-as-a-service product. Salling Group blends loyalty across bricks and clicks, pushing unified inventory visibility that delivers a 99.94% click-and-collect completion rate. Nemlig.com and Coop.dk defend grocery share through private-label pricing and cold-chain optimisation.
Temu and Amazon escalate price tension. Their pan-EU logistics give broad catalogue depth, but local service gaps persist-returns handling and Danish-language support remain weak points. Domestic players counter with sustainability credentials, leveraging shorter supply chains and CSRD-compliant reporting dashboards. Logistics tech start-ups integrate AI route-planning and autonomous locker restocking, signalling a tech-led competitive phase.
Partnership ecosystems flourish: Coop Danmark’s extended pact with Tata Consultancy Services migrates core ERP to SAP S/4HANA, unlocking real-time stock views that improve customer promises. Zalando’s ABOUT YOU acquisition expects EUR 100 million (USD 108 million) EBIT synergies via marketing pooling and shared last-mile assets. PostNord partners with locker manufacturers to double urban capacity by 2027, ensuring infrastructure keeps pace with rising parcel volumes.
Denmark E-commerce Industry Leaders
Apple Inc.
Harald Nyborg
Zalando SE
Elgiganten A/S
Bilka .dk (Salling Group)
- *Disclaimer: Major Players sorted in no particular order

Market Opportunities and Future Outlook
Compliance-driven digitization is creating practical whitespace for e-commerce platforms and service providers that embed invoicing, bookkeeping, and auditable transaction trails into checkout and post-purchase workflows. Denmark's Bookkeeping Act requirements, with full compliance milestones in January 2026 for many businesses and later timelines for certain in-house systems, plus expanding use of NemHandel and Peppol BIS-style e-invoicing rails, favor B2B storefronts and merchant tools that can automate invoice issuance, reconciliation, and standardized VAT coding alongside order management.
Platform governance and identity capabilities are also becoming differentiating product features. With the EU Digital Services Act active from February 2024 and the Danish Competition and Consumer Authority (KFST) serving as Denmark's Digital Services Coordinator, marketplaces that operationalize notice-and-action, seller vetting, and transparency tooling can differentiate on trust. In parallel, the 2026-2029 Joint Government Digital Strategy and the introduction of app-based digital identification and age verification tools (such as AltID) support opportunities in regulated categories and help reduce onboarding friction, particularly for mobile-first commerce and cross-border sellers that need consistent identity checks.
Recent Industry Developments
- July 2026: Salling Group launched a collaboration with Google to integrate its retail ecosystem (including Bilka) with Google Gemini AI for agentic commerce experiences. The initiative targets more personalized shopping journeys and automation across search, recommendations, and service flows. It also raises competitive pressure on other Danish omnichannel retailers to invest in AI-led discovery and conversion tooling.
- May 2025: Salling Group acquired Rimi Baltic and 33 Coop Denmark stores as part of scaling its retail footprint and sourcing leverage under its ASPIRE '28 plan. The added scale strengthens its omnichannel economics by increasing store-based fulfillment options and widening the loyalty base that can be activated online. The move also intensifies consolidation dynamics among large-format retail operators serving Danish e-commerce demand.
- February 2024: The EU Digital Services Act began applying across member states, setting new operational obligations for online platforms and intermediary services used by Danish consumers. This elevated requirements around content governance, transparency, and seller accountability, increasing compliance workloads for marketplaces and larger webshops. The shift supports demand for platform tooling that automates notices, reporting, and trust-and-safety workflows.


Research Methodology Framework and Report Scope
Market Definition and Coverage
For this study, the Denmark e-commerce market is defined as the value of purchases placed through internet-enabled channels by buyers in Denmark, covering orders completed on websites or apps across retail and service-led online baskets.
Scope exclusions: We exclude purely digital subscriptions and downloads, online classified listings, and business-to-government procurement portals.
Segmentation Overview
- By Business Model
- B2C
- B2B
- C2C
- By Device Type
- Smartphone / Mobile
- Desktop and Laptop
- Other Device Types
- By Payment Method
- Credit / Debit Cards
- Digital Wallets
- BNPL
- Other Payment Method
- By B2C Product Category
- Beauty and Personal Care
- Consumer Electronics
- Fashion and Apparel
- Food and Beverages
- Furniture and Home
- Toys, DIY and Media
- Other Product Categories
Data Sources, Market Sizing, and Validation
Desk Research
Desk research was used to pin down the demand pool and the most stable input series before we built the model. We relied on public references such as Statistics Denmark releases, Eurostat household consumption and digital economy tables, the Danish Business Authority updates, OECD digital economy indicators, and EU policy notes that affect cross-border shopping and consumer rights.
We also reviewed company filings and investor presentations for major local retailers and logistics operators, along with reputable press and association webpages describing payment habits, delivery preferences, and category shifts. Where a public series was missing or delayed, we complemented it with paid database subscriptions focused on company financials and intelligence, news and financials, and import-export shipment-level signals for selected product flows. These desk inputs were then used as guardrails, and this list is illustrative since many other sources were also consulted for data collection, validation, and clarification.
Primary Interviews and Surveys
Field interviews and surveys in Denmark cover CXOs, functional/unit leaders, and managers from larger, mid-sized, and smaller online retail businesses. Respondents help test resident spending, subscriptions, cross-border purchases, channel mix, average order values, and seasonal peaks, while clarifying gaps in secondary data. Analysts re-contact experts when a material assumption cannot be reconciled.
Distribution of primary research fieldwork respondents
| Company type | Respondent position |
|---|---|
| Top tier: 30% | CXOs: 15% |
| Mid tier: 45% | Functional/Unit leaders: 30% |
| Smaller Players: 25% | Managers: 55% |
Market-Sizing & Forecasting
The market was sized using a top-down and bottom-up mix, where national online spending capacity and participation rates were reconstructed and then cross-checked with selective roll-ups. On the top-down side, we linked the demand pool to indicators such as online shopper penetration, average annual online spend per shopper, device mix (mobile versus desktop), digital-wallet and card usage shares, and cross-border purchase intensity, which were converted into consistent USD values using a clear currency timing.
To keep the totals realistic, bottom-up approximations were used as sense checks, including sampled merchant GMV ranges, category-level basket size patterns, and channel checks with logistics and payment participants. If a company or category signal was partial, gaps were handled through proxy ratios (for example, applying observed checkout conversion and delivery share splits) before the final total was adjusted. Forecasts were built using scenario analysis supported by expert inputs on inflation, discounting behavior, delivery speed expectations, and category migration toward online, and the final trajectory was reviewed for logical continuity year to year.
Data Validation & Update Cycle
Outputs were validated through multiple checks so that unusual jumps were caught early. We compared model totals against independent signals such as online shopper counts, household spend patterns, and payment mix shifts, then investigated variances until the driver was clearly explained.
Before sign-off, assumptions are reviewed in steps, and experts are re-contacted when results fall outside expected ranges for Denmark. The report is refreshed annually, and interim updates are made when material events change growth inputs, such as regulation updates, major retail launches, or payment adoption shifts. Right before delivery, a final analyst pass is completed so clients receive the latest updated view.
Mordor Intelligence's Denmark Ecommerce Market Size Measured Against Other Published Estimates
Published market sizes for Denmark e-commerce often vary because the scope is not consistent across sources, and the same term can cover very different baskets. Differences usually come from whether figures include B2B alongside B2C, how cross-border orders are treated, and whether the value is reported as GMV, retail sales, or narrower online retail revenue.
The main gap comes from mixing retail e-commerce with broader digital commerce and then counting adjacent digital-only items, where Mordor Intelligence treats the market as transaction value for online orders while excluding digital-only subscriptions, online classifieds, and B2G procurement portals, which keeps the totals aligned to a repeatable demand pool.
Benchmark comparison
| Source | Market Size | Gaps in Research Methodology |
|---|---|---|
| Mordor Intelligence | USD 27.96 B (2025) | |
| Government Trade Brief A | USD 24.00 B (2024) | Uses a different base year and may reflect a narrower retail-focused value, with less clarity on whether cross-border GMV and non-retail services are included, which can pull the total down versus broader GMV-style accounting. |
| Industry Databook B | USD 142.50 B (2028) | Appears to use an expanded definition that can aggregate multiple verticals and value layers, and it may mix gross opportunity with transaction value, which can inflate totals compared with a Denmark buyer-spend model tied to observed participation and basket sizes. |
The spread in the table is mainly explained by what gets counted and how the value is measured, not by a simple arithmetic difference. When scope is anchored to online order value and checked against shopper penetration, spend per shopper, and payment and device splits, the result stays traceable and easier to recreate across years.


Key Questions Answered in the Report
What is the current value of the Denmark e-commerce market?
The market is valued at USD 33.09 billion in 2026, with a forecast CAGR of 18.38% through 2031.
Which business model is growing fastest in Danish e-commerce?
B2B transactions are advancing at a 21.20% CAGR, outpacing B2C albeit from a smaller base.
How important is MobilePay to online retail in Denmark?
MobilePay covers 77% of residents and cuts checkout abandonment 15-25%, making it a critical conversion driver.
What product category leads online sales?
Fashion and apparel holds a 22.10% revenue share, driven by rich return policies and AI size tools.
How is sustainability regulation affecting Danish e-commerce?
CSRD requires full supply-chain impact reporting by 2026, favouring platforms that offer integrated ESG tracking.
Are foreign marketplaces threatening local players?
Temu and Amazon intensify price competition, but domestic retailers leverage faster delivery and sustainability credentials to defend share.
Page last updated on:


 Your data is secure and never sold or shared.


