
Market Overview
| Study Period | 2020 - 2031 |
|---|---|
| Market Size (2026) | USD 3.87 Billion |
| Market Size (2031) | USD 6.54 Billion |
| Growth Rate (2026 - 2031) | 11.08% CAGR |
| Fastest Growing Market | Asia Pacific |
| Largest Market | North America |
| Market Concentration | Medium |
Major Players *Disclaimer: Major Players sorted in no particular order Image © Mordor Intelligence. Reuse requires attribution under CC BY 4.0. | |
Data Wrangling Market Analysis by Mordor Intelligence
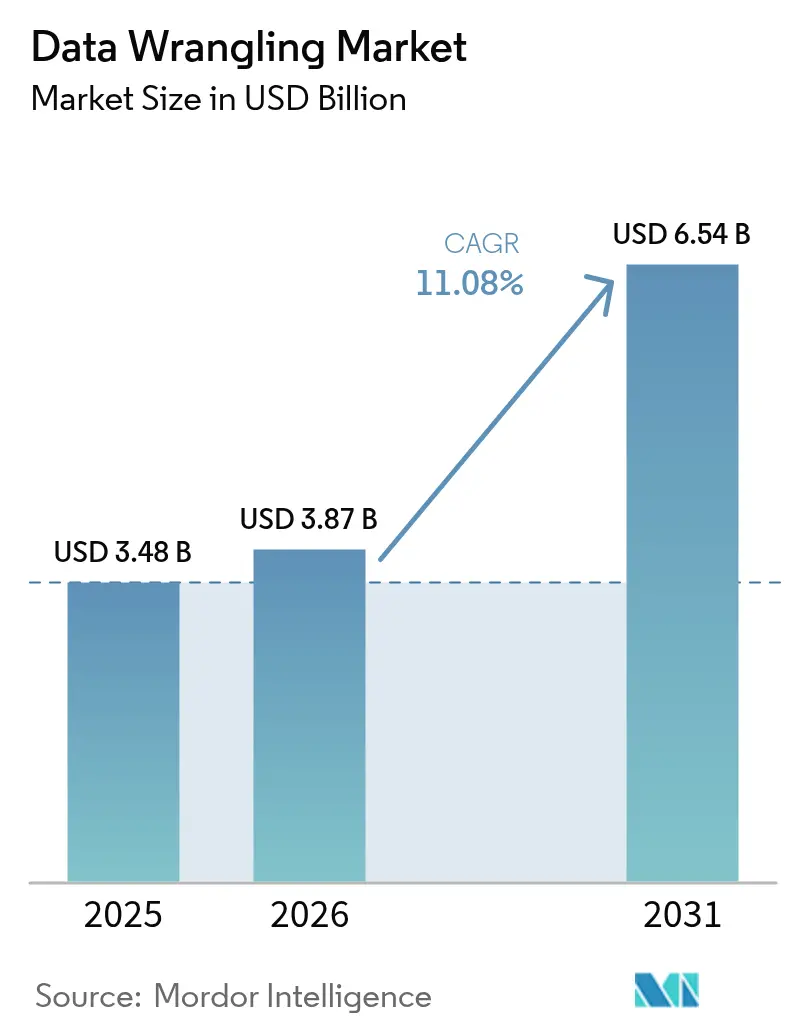
The data wrangling market size is expected to grow from USD 3.48 billion in 2025 to USD 3.87 billion in 2026 and is forecast to reach USD 6.54 billion by 2031 at 11.08% CAGR over 2026-2031. Over the forecast period, the accelerating growth of enterprise data, mounting demand for real-time analytics, and the pivot from traditional ETL suites to AI-enabled preparation platforms will remain the principal growth engines. Vendors are embedding generative AI, low-code transformation flows, and lakehouse connectors to shorten time-to-insight and support self-service across finance, marketing, and operations teams. Competitive intensity is rising as hyperscale cloud providers integrate native wrangling features, forcing pure-play data preparation firms to differentiate through domain-specific automation and multimodal support. Emerging regulations that mandate strong governance frameworks and lineage reporting further reinforce adoption momentum, even as escalating compute costs push enterprises toward hybrid deployment models.
Key Report Takeaways
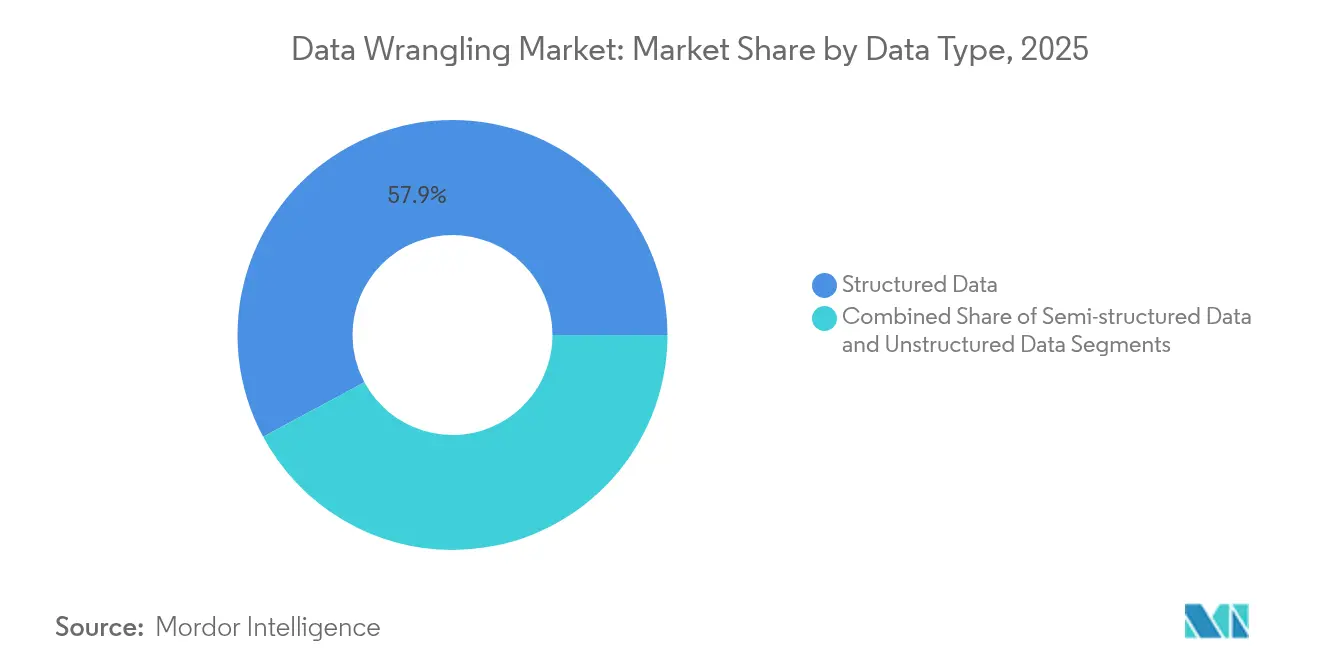
- By data type, structured formats retained 57.85% of data wrangling market share in 2025, while unstructured formats are forecast to expand at a 12.32% CAGR through 2031.
- By component, software captured 68.85% revenue in 2025; services represent the fastest-growing component at a 12.45% CAGR to 2031.
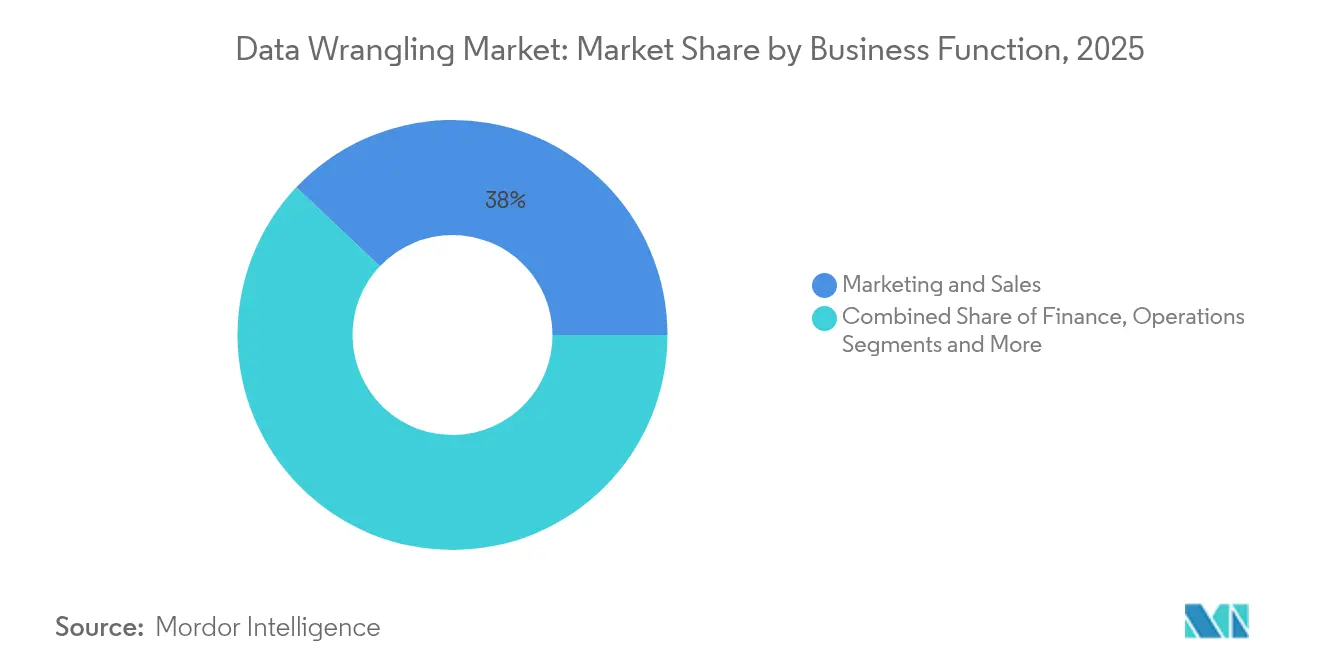
- By business function, marketing and sales led with 37.95% share of the data wrangling market in 2025, whereas finance is projected to grow at 11.98% CAGR.
- By end-user industry, IT and telecommunication held 27.35% share of the data wrangling market in 2025, and BFSI is advancing at an 11.42% CAGR.
- By geography, North America commanded 37.10% revenue share in 2025, while Asia-Pacific is set to register an 11.75% CAGR to 2031.
Note: Market size and forecast figures in this report are generated using Mordor Intelligence’s proprietary estimation framework, updated with the latest available data and insights as of 2026.
Global Data Wrangling Market Trends and Insights
Drivers Impact Analysis*
| Driver | (~) % Impact on CAGR Forecast | Geographic Relevance | Impact Timeline |
|---|---|---|---|
| Rising global data volumes | +2.8% | Global | Long term (≥ 4 years) |
| Advances in AI-driven automation | +2.1% | North America, EU, APAC | Medium term (2-4 years) |
| Growing self-service analytics demand | +1.9% | Global | Short term (≤ 2 years) |
| Stricter quality and governance mandates | +1.7% | EU, North America | Medium term (2-4 years) |
| Lakehouse migration momentum | +1.4% | APAC, Middle East and Africa | Medium term (2-4 years) |
| Rise of no-code LLM copilots | +1.2% | North America, EU | Short term (≤ 2 years) |
| Source: Mordor Intelligence | |||
Growing Volumes of Data Generated Across Industries
McKinsey estimates that global data-center outlays will reach USD 6.7 trillion by 2030, of which USD 5.2 trillion relates directly to AI workloads. Edge devices, 5G rollouts, and digitization of manufacturing lines are fueling data creation that outpaces legacy ETL capacity. Asia-Pacific exemplifies this trajectory with 12,206 MW of operational data-center power and 14,338 MW under development in 2024. Enterprises therefore pivot to platforms capable of processing diverse, high-frequency feeds in local jurisdictions that impose sovereignty guardrails.
Advancement in AI and Big-Data Technologies Enabling Automation
Vendors such as Alteryx have embedded generative assistants that recommend transformation steps and generate summaries in natural language. Gartner’s 2025 taxonomy of agentic analytics points to autonomous pipelines that self-correct for schema drift and optimize compute allocation. Databricks accelerated this trend by acquiring Lilac AI, adding LLM-based data-quality scoring to its lakehouse stack. While AI raises productivity, organizations temper adoption with hybrid deployment strategies that mitigate compute cost spikes.
Rising Demand for Self-Service Data Preparation Among Business Users
Retail case studies show that 54% of firms captured at least 10% profit gains from data analytics initiatives, yet still encounter fragmented silos that hinder self-service. Citizen data-scientist programs and embedded wrangling modules in BI suites equip finance and merchandising teams with point-and-click interfaces. Gartner forecasts over half of Chief Data and Analytics Officers will invest in data-literacy programs by 2027, highlighting that soft-skill enablement matters as much as tool selection.
Stricter Data-Quality and Governance Regulations
BCBS 239 and GDPR elevate the need for lineage, traceability, and audit-grade transformations. The European Central Bank’s latest RDARR reviews flagged persistent gaps in risk data aggregation, spurring banks to adopt enterprise-grade platforms that automate rule enforcement. Healthcare providers deploy de-identification routines to comply with HIPAA while preserving granular clinical attributes for research use.
Restraints Impact Analysis*
| Restraint | (~) % Impact on CAGR Forecast | Geographic Relevance | Impact Timeline |
|---|---|---|---|
| Low SME awareness of data-wrangling tools | -1.8% | Emerging markets | Medium term (2-4 years) |
| Security-driven data-access restrictions | -1.2% | EU, APAC | Long term (≥ 4 years) |
| Shortage of cloud data-engineering talent | -1.1% | North America, EU | Medium term (2-4 years) |
| Escalating cloud compute expenses | -0.9% | Global | Short term (≤ 2 years) |
| Source: Mordor Intelligence | |||
Limited Awareness of Data-Wrangling Tools Among SMEs
MSMEs account for 98.9% of all businesses in Central and West Asia, yet scarce digital skills and budget constraints leave many reliant on spreadsheets[1]Asian Development Bank, “Asia SME Monitor 2022,” adb.org . Policy bodies advocate training subsidies and cloud vouchers to broaden adoption, while vendors pursue freemium tiers and local reseller partnerships to penetrate this price-sensitive segment.
Escalating Cloud-Compute Costs for Gen-AI-Enhanced Wrangling Workloads
IBM reported an 89% jump in compute outlays between 2023 and 2025, prompting 70% of executives to delay AI projects. Enterprises now benchmark total-cost-of-ownership across hyperscalers, adopt parameter-efficient models, and cache intermediate results to curb spend. These tactics temper but do not erase demand for AI-rich preparation pipelines, sustaining the long-term trajectory of the data wrangling market.
*Our forecasts treat driver/restraint impacts as directional, not additive. The impact forecasts reflect baseline growth, mix effects, and variable interactions.
Segment Analysis
By Data Type: Unstructured Volumes Open New Frontiers
Structured data contributed USD 2.01 billion to the data wrangling market size in 2025, equal to 57.85% revenue. Relational tables remain pivotal for transactional integrity and core reporting. Even so, modern pipelines must fuse logs, clickstreams, and sensor feeds into warehouse and lakehouse environments. SQL-centric visual builders that auto-generate lineage maps help enterprises maintain governance as row counts surge.
The unstructured segment is projected to add USD 1.19 billion in incremental revenue between 2026 and 2031 at a 12.32% CAGR, the highest pace among data types. LLM-powered classification and computer vision capabilities unlock insights within contracts, engineering drawings, and video frames. Providers differentiate by offering integrated vector indexing, multimodal metadata extraction, and privacy-aware redaction modules that comply with cross-border regulations.


By Component: Services Expand as Projects Grow Complex
Software tools held 68.85% of the data wrangling market in 2025, translating to USD 2.4 billion in license and subscription fees. Cloud-native suites weave preparation, cataloging, and governance into one workspace. Vendors cement stickiness by bundling prep functionality inside analytics or ML workloads, turning data wrangling into a workflow rather than a standalone task.
Services revenue, forecast to grow 12.45% annually, reflects demand for architecture design, migration, and managed operations. Deloitte’s collaboration with Databricks on Data as a Service for Banking underscores the lift that expert partners provide during modernization initiatives. As lakehouses and distributed fabrics mature, many firms outsource pipeline monitoring to specialists who deliver 24 × 7 support under outcome-based contracts.
By Business Function: Finance Accelerates Technology Spend
Marketing and sales captured 37.95% of data wrangling market share in 2025, equivalent to USD 1.32 billion, driven by omnichannel activation and personalization demands. Platform roadmaps add reverse-ETL connectors that push clean attributes back to campaign engines, enabling near real-time segmentation and A/B testing.
Finance workloads will rise at 11.98% CAGR to 2031 as regulators tighten reporting expectations and CFOs pursue continuous accounting. Rules-driven reconciliation templates, anomaly detection, and instant aggregation functions reduce month-end cycles from days to hours. Audit-ready lineage and immutable data-quality metrics position vendors for sustained growth within treasury, risk, and controllership teams.
By End-User Industry: BFSI Leads Compliance-Driven Uptake
IT and telecommunication contributed USD 0.95 billion to the data wrangling market in 2025. These firms run massive infrastructure footprints and act as early adopters of data governance frameworks. Their experience informs best practices later adopted by other verticals.
BFSI deployments will outpace all other sectors, growing 11.42% annually to 2031. Basel-aligned calculations such as liquidity and credit value adjustments require granular, high-frequency feeds that legacy ETL cannot accommodate. Banks turn to wrangling engines that parse nested XML trade files, enrich them with reference data, and surface lineage for supervisors. Insurance carriers use similar pipelines for solvency analytics, catastrophe modeling, and ESG disclosures.
Geography Analysis
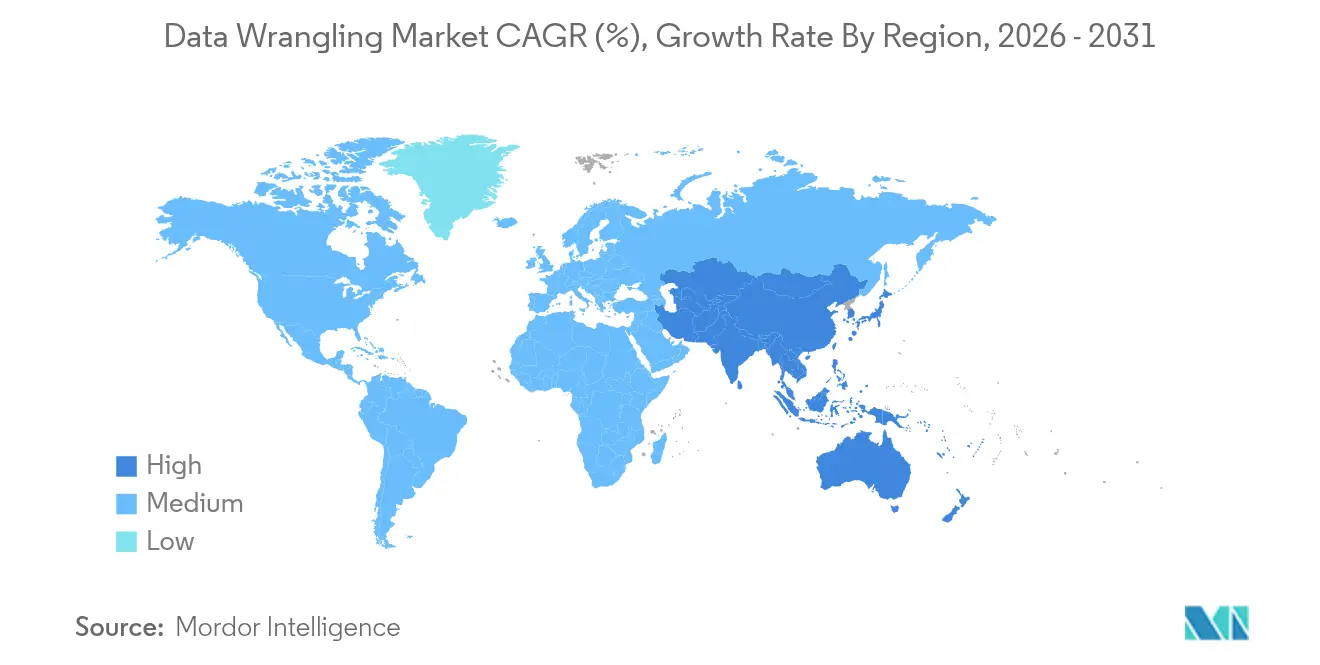
North America held 37.10% of global revenue in 2025, reflecting deep cloud penetration, established hyperscale data-center networks, and sustained venture funding for AI-first platforms. United States enterprises drive the bulk of spend, illustrated by Microsoft’s USD 42.4 billion cloud revenue in Q1 2025 and Fabric’s 80% customer surge. Canada aligns with skills and regulatory frameworks, whereas Mexico’s manufacturing clusters embrace local lakehouse deployments to comply with data-residency laws. Cost pressures are pushing many firms toward workload-aware tiering that keeps frequently accessed datasets on fast object storage and archives cold data on-premises.
Asia-Pacific is forecast to log an 11.75% CAGR, making it the fastest-growing theater for the data wrangling market. Regional enterprises benefit from the 12,206 MW operational data-center footprint, an expanding 5G user base, and sovereign cloud offerings in China, India, and Indonesia. Local providers collaborate with global platforms to offer in-territory edges that satisfy latency and regulation constraints. Strong e-commerce and fintech ecosystems in Singapore and Hong Kong demand real-time customer 360 solutions, intensifying the call for scalable preparation engines.
Europe holds a mature but regulation-heavy environment where GDPR and operational risk mandates dictate procurement criteria. German automotive manufacturers deploy digital twins that blend plant telemetry with enterprise resource planning data. United Kingdom banks advance lineage automation to satisfy Prudential Regulation Authority expectations. Meanwhile, South America, and Middle East, and Africa remain nascent but promising. Brazil’s open banking initiative stimulates API traffic that must be standardized, and Saudi Arabia’s cloud-first directives increase demand for localized data fabrics that balance cultural and legal considerations.

Regulatory Landscape
Data wrangling adoption is increasingly shaped by governance and interoperability requirements that elevate lineage, traceability, and standardized schemas across regulated workflows. In the European Union, GDPR and sector governance obligations continue to raise expectations for audit-grade processing, reinforced by the European Data Protection Board issuing Recommendations 1/2026 on Processor Binding Corporate Rules (BCR-P) under Article 47 in January 2026. The EU Data Governance Act (Regulation 2022/868) further formalizes the role of data intermediaries and controlled data sharing, tightening the compliance bar for marketplaces and catalog-driven exchange patterns that depend on consistent preparation and metadata management.
In 2026, regulators also expanded data governance beyond traditional privacy-only framing. A U.S. interagency final rule under the Financial Data Transparency Act of 2022 was published in June 2026 and becomes effective October 1, 2026, establishing standardized data requirements for covered financial regulatory reports and pushing financial institutions toward more consistent data definitions and transformation controls. Kenya’s ICT Authority released a Draft Final National Data Governance Policy in May 2026 that brings data intermediaries, brokers, and marketplace operators under explicit oversight. Pakistan’s National Data Governance Policy (DNP-D.001) in June 2026 created a National Data Governance Council chaired by the Pakistan Digital Authority to coordinate cross-sector frameworks, which increases the need for governed, well-documented data preparation pipelines.
Value Chain Analysis
The value chain starts with data generation and capture across enterprise applications, IoT/edge endpoints, logs, and third-party feeds, then ingestion via connectors and streaming/batch integration into cloud data platforms, warehouses, and lakehouses. Wrangling value is created in transformation, validation, enrichment, and metadata and lineage capture, increasingly packaged as low-code workflows and agent-assisted steps that sit inside broader analytics and AI stacks. Downstream, prepared data is consumed by BI, ML/LLM applications, and domain systems, including marketing activation via reverse-ETL and regulated reporting in BFSI, while governance functions such as cataloging, access controls, and audit evidence tie the lifecycle together.
Key ecosystem participants include hyperscalers and data platforms that bundle preparation with storage and compute, specialist wrangling vendors and data quality tools, and service partners delivering migration, operating model design, and managed operations. Current bottlenecks center on siloed architectures, inconsistent metric definitions, and the operational burden of maintaining real-time, event-driven pipelines across hybrid estates, which increases demand for semantic governance and reusable transformation logic. Telecom-led initiatives show the shift toward unified control layers and agentic operations: Tech Mahindra and Microsoft (March 2026) launched an ontology-driven agentic AI platform built on Microsoft Fabric and Azure AI Foundry to accelerate data mesh and operations, while Nokia, AWS, and Databricks (June 2026) announced a multi-vendor integration to create a unified data control layer for autonomous networks, reflecting tighter coupling between data preparation, governance, and operational AI at scale.
Competitive Landscape
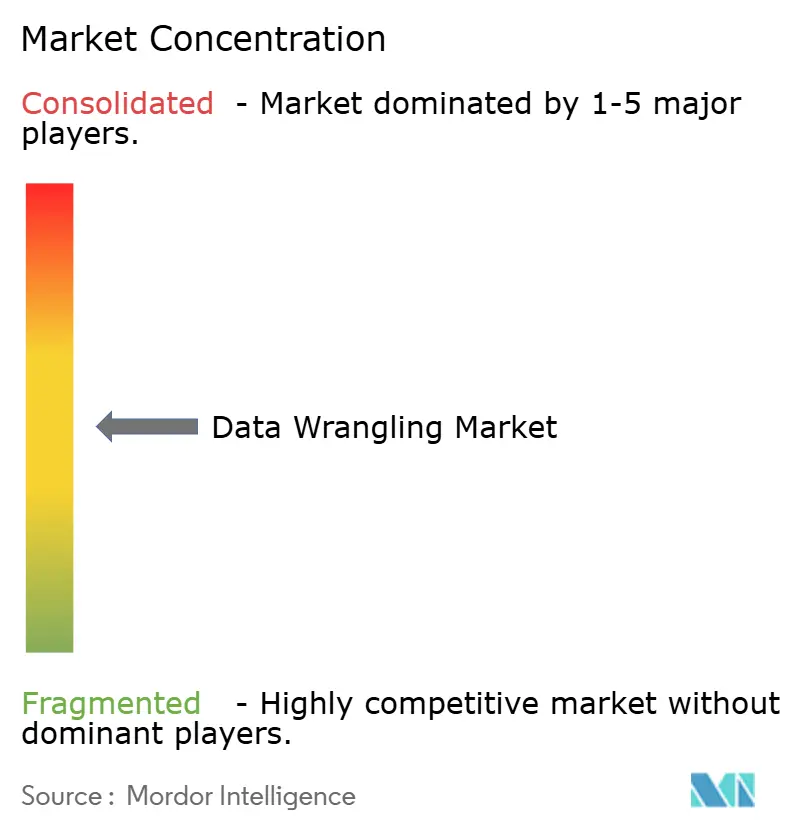
The data wrangling market features a mix of broad-based cloud suites and specialist vendors, leading to a moderate concentration of power. Microsoft, IBM, and Oracle bundle preparation with adjacent analytics and governance modules, capitalizing on existing enterprise agreements and global channel networks. Alteryx and Informatica compete through intuitive UIs and out-of-the-box connectors aimed at line-of-business analysts. Databricks and Snowflake position their lakehouse and cloud data platform ecosystems as the backbone for AI-native transformation flows, with Databricks reaching USD 3.7 billion in annualized revenue by July 2025 and 50% growth year over year.
Strategic deals underscore the race to embed AI and governance. ServiceNow acquired Data.world in May 2025 to integrate cataloging and workflow orchestration[3]ServiceNow Press Release, “ServiceNow completes acquisition of data.world,” servicenow.com. Databricks followed with Lilac AI to strengthen LLM-centric data-quality scoring. Partnerships also proliferate; Databricks joined forces with BladeBridge in April 2025 to streamline warehouse-to-lakehouse migrations. Vendor roadmaps now feature vector stores, fine-tuned language models, and cost-aware orchestration that automatically chooses between Spark, Photon, or SQL engines.
Price competition is rising as hyperscalers lower storage and compute tariffs for long-running analytics clusters, squeezing margins for standalone vendors. Nevertheless, differentiation around verticalized templates, data contracts, and instream quality checks keeps the field vibrant. The next arena of competition will likely center on autonomous agents that not only prepare but also continuously monitor and adapt pipelines based on business-rule changes.
Data Wrangling Industry Leaders
Alteryx, Inc.
Oracle Corporation
Teradata Corporation
SAS Institute Inc.
Altair Engineering Inc.
- *Disclaimer: Major Players sorted in no particular order

Market Opportunities and Future Outlook
A major whitespace is operational reliability and cost control for AI-ready pipelines. Organizations report frequent disruption from data pipeline issues, even as integration consumes a dedicated share of data budgets. The Enterprise Data Infrastructure Benchmark Report 2026 from Fivetran highlighted that enterprises allocate 14% of their data budget to integration and that 97% report disruptions to AI or analytics due to pipeline issues. That combination creates room for products and services that harden preparation workflows (testing, observability, lineage, and automated remediation) and reduce expensive rework. It also supports higher adoption of managed services and outcome-based engagements, particularly as enterprises pursue hybrid deployment approaches to balance governance constraints with escalating compute costs.
Another opportunity area is agentic and self-service data preparation that operates across cloud ecosystems and supports real-time modes, rather than only batch transformations. In 2026, platform roadmaps moved further in this direction: Databricks expanded Lakeflow Connect to 100+ native connectors and introduced Real-Time Mode for Spark Declarative Pipelines (June 2026), while Qlik announced general availability of Agentic Data Engineering (June 2026) and Microsoft Research released Data Formulator 0.7 (May 2026) to combine data connectivity with agent-guided exploration. With data engineering recognized broadly as a strategic capability (Dresner Advisory Services reported 82% of organizations view it as important in its 2026 study), vendors that package governed, low-code transformations with domain templates and cross-platform connectors have a clear runway in functions such as finance and regulated reporting, and in regions where sovereign and public-sector frameworks are formalizing data governance requirements.
Recent Industry Developments
- May 2026: Alteryx introduced agentic automation capabilities, including Agent Studio and the Alteryx One MCP Server, positioning business logic and governed workflows closer to generative and agent-driven execution. The update supports self-service preparation use cases where repeatable transformations and auditability are required as teams scale AI initiatives across functions.
- May 2025: ServiceNow completed its acquisition of data.world, adding catalog and governance capabilities to its Workflow Data Fabric portfolio. Integrating cataloging, governance, and workflow orchestration supports broader adoption of standardized data definitions and lineage-aware preparation across enterprise processes.
- July 2024: Teradata and DataRobot announced a partnership to accelerate trusted AI innovation by combining platform capabilities for data and AI execution. The collaboration highlights enterprise demand for governed data foundations that reduce friction from raw-to-ready preparation as AI models move into production.


Research Methodology Framework and Report Scope
Market Definition and Coverage
The data wrangling market is defined as revenue earned from software tools and related services used to collect, clean, transform, and structure raw data so it can be analyzed or used in reporting, dashboards, and analytics work.
Scope exclusions: We exclude general database hosting, pure data storage, and broad IT outsourcing that is not directly tied to data wrangling tasks.
Segmentation Overview
- By Data Type
- Structured Data
- Semi-structured Data
- Unstructured Data
- By Component
- Software
- Self-service data-preparation platforms
- Embedded prep modules in BI/AI suites
- Services
- Managed Services
- Professional / Consulting Services
- Software
- By Business Function
- Finance
- Marketing and Sales
- Operations
- Human Resources
- Legal and Compliance
- By End-user Industry
- IT and Telecommunication
- BFSI
- Retail and E-commerce
- Healthcare
- Government and Public Sector
- Other End-user Industries
- By Geography
- North America
- United States
- Canada
- Mexico
- Europe
- Germany
- United Kingdom
- France
- Italy
- Spain
- Rest of Europe
- Asia-Pacific
- China
- Japan
- India
- South Korea
- Australia
- Rest of Asia-Pacific
- South America
- Brazil
- Argentina
- Rest of South America
- Middle East and Africa
- Middle East
- Saudi Arabia
- United Arab Emirates
- Turkey
- Rest of Middle East
- Africa
- South Africa
- Egypt
- Nigeria
- Rest of Africa
- Middle East
- North America
Data Sources, Market Sizing, and Validation
Desk Research
Desk research was used to lock the market boundary, set the starting assumptions, and gather independent signals that can be checked in public data. For this market, we relied on reputable sources such as the US Bureau of Economic Analysis and US Census Bureau for macro spending context, the World Bank and OECD for digital adoption indicators by country, and the US Bureau of Labor Statistics for employment and wage trends that connect to data and analytics roles.
We also reviewed SEC filings (10-Ks), annual reports, and investor presentations to understand how data management and analytics related revenue is described, along with product documentation and pricing pages published on company websites. Trade association publications and peer-reviewed journals were used selectively to validate patterns such as data volume growth, cloud adoption, and the spread of self-service analytics. Where it helped, we used paid subscriptions for company financials and intelligence, patent databases, and news and financials to confirm timelines and revenue exposure. These desk sources are illustrative, and other public references were also used for data collection, validation, and clarification.
Primary Interviews and Surveys
Primary work focused on validating how data wrangling budgets are set, what gets classified as a tool versus a service engagement, and how pricing is evolving across cloud and on-premises deployments. We spoke with a mix of software providers, service partners, and enterprise users across major regions to check assumptions on adoption, renewal behavior, and average contract sizing before finalizing the model.
Distribution of primary research fieldwork respondents
| Company type | Respondent position | Region |
|---|---|---|
| Top tier: 34% | CXOs: 17% | APAC: 50% |
| Mid tier: 44% | Functional/Unit leaders: 27% | EMEA: 31% |
| Smaller Players: 22% | Managers: 56% | Americas: 19% |
Market-Sizing & Forecasting
Sizing started with a top-down build where broader analytics and data management spend pools were reconstructed by region, then narrowed using data wrangling adoption indicators and typical usage intensity within analytics projects. After the demand pool was shaped, totals were corroborated with selective bottom-up checks, such as mapping sampled vendor disclosures to the wrangling use case, channel checks with implementation partners, and simple price per user or workload ranges multiplied by plausible deployment volumes.
Inputs used in the model included enterprise cloud migration pace for analytics stacks, the share of analytics work that requires structured and semi-structured data preparation, typical subscription and services pricing progression, renewal behavior, and sector level digitization patterns across industries such as BFSI, retail, healthcare, government, and IT. When revenue splits were not reported cleanly, gaps were handled using conservative allocation rules that were reviewed in interviews and then stress-tested through sensitivity checks.
For forecasting, scenario analysis was used, supported by a light regression view on macro IT spend growth and cloud adoption trends, then refined using expert expectations around penetration, services attachment, and contract expansion rates. The final outputs were kept traceable to a small set of drivers so the logic stays repeatable when inputs are refreshed.
Data Validation & Update Cycle
Validation was done in layers so major outliers were caught early. Model outputs were compared with independent signals such as enterprise analytics budget direction, cloud data platform expansion activity, and observed pricing behavior from interviews, and then any large variances were reviewed by another analyst before sign-off.
If a major pricing change, licensing shift, or a broad macro shock is flagged, we re-contact a small set of participants to confirm whether assumptions still hold. Reports are refreshed annually, and interim updates are completed for material events. Before delivery, an analyst performs a fresh pass so clients receive an up-to-date view based on the latest available inputs.
Mordor Intelligence's Data Wrangling Market Size Versus Other Published Estimates
It is normal to see different market size numbers for data wrangling because publishers draw the market boundary in different places and then apply different pricing and adoption assumptions. Differences also come from the chosen base year, how cloud subscriptions are annualized, and whether services are counted as a direct part of the market.
Enterprise analytics budget direction and renewal behavior checks from interviews are key evidence that keeps Mordor Intelligence's data wrangling number aligned to tool and related service spending for cleaning, transforming, and structuring data, rather than folding in adjacent data integration and general database management revenue.
Benchmark comparison
| Source | Market Size | Gaps in Research Methodology |
|---|---|---|
| Mordor Intelligence | USD 3.87 B (2026) | |
| Global Research Publisher A | USD 4.18 B (2025) | Uses a different base year and appears to normalize 2025 using faster near-term adoption and annualization for cloud subscriptions, which can lift the current market value even if the long-term curve is similar. |
| Industry Research Publisher B | USD 3.90 B (2025) | Broader scope statements indicate adjacent data preparation activities by business function may be included, and the reported current value can shift if services attachment is applied uniformly across all deployments. |
The spread in figures mostly comes from scope edges and how subscription and services revenue is counted and normalized by year. Our method stays easy to audit because the variables are explicit, the checks are repeatable, and the final totals are reconciled back to practical adoption and pricing signals.


Key Questions Answered in the Report
What is the current size of the data wrangling market?
The data wrangling market reached USD 3.87 billion in 2026 and is projected to grow to USD 6.54 billion by 2031 at an 11.08% CAGR.
Which region leads the data wrangling market?
North America led with 37.10% revenue share in 2025, supported by deep cloud adoption and a mature analytics ecosystem.
Which component is expanding fastest?
Services are the fastest-growing component, registering a 12.45% CAGR as enterprises seek expert support for complex transformation projects.
Why is the BFSI sector investing heavily in data wrangling?
Stricter regulations such as BCBS 239 require robust risk data aggregation and real-time reporting, driving rapid adoption in banking and insurance.
How are rising compute costs affecting adoption?
Escalating cloud expenses are pushing organizations toward hybrid deployments and parameter-efficient models, yet the long-term growth trajectory remains intact.
What competitive moves are shaping the market?
Recent acquisitions such as ServiceNow–data.world and Databricks–Lilac AI highlight a shift toward integrated governance and AI-powered quality analytics.
Page last updated on:






