
Data Quality Tools Market Size and Share
Market Overview
| Study Period | 2020 - 2031 |
|---|---|
| Market Size (2026) | USD 3.27 Billion |
| Market Size (2031) | USD 7.39 Billion |
| Growth Rate (2026 - 2031) | 17.70 % |
| Fastest Growing Market | Asia Pacific |
| Largest Market | North America |
| Market Concentration | Medium |
Major Players *Disclaimer: Major Players sorted in no particular order Image © Mordor Intelligence. Reuse requires attribution under CC BY 4.0. | |
Data Quality Tools Market Analysis by Mordor Intelligence
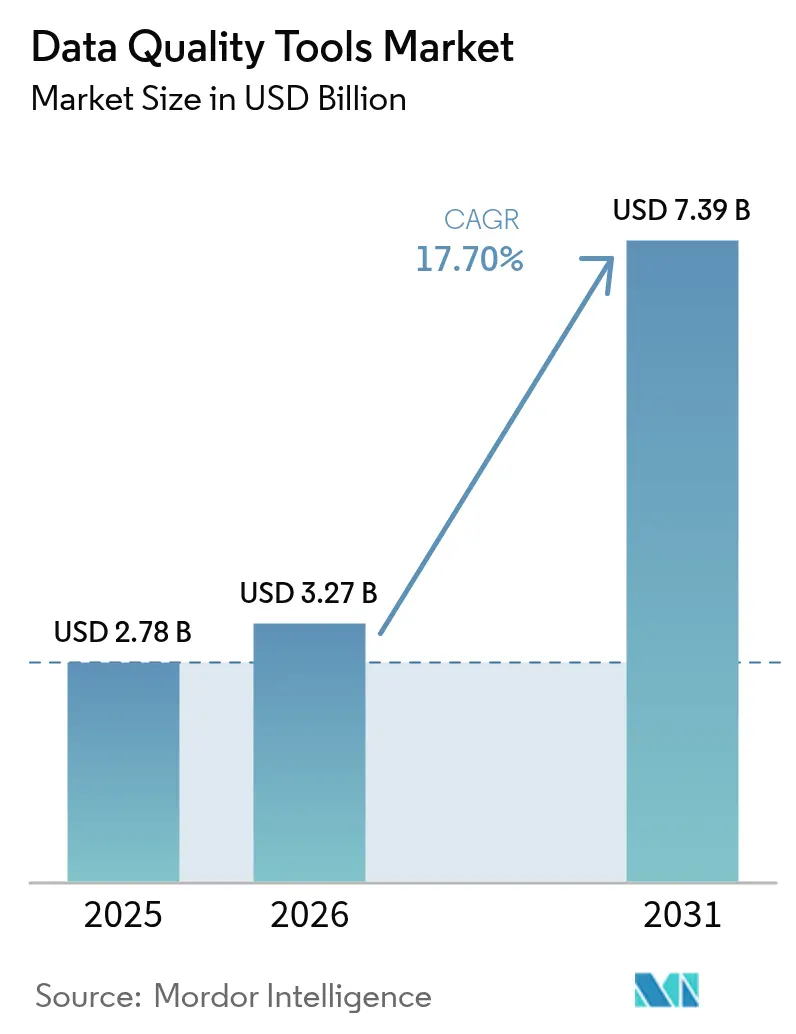
The data quality tools market size is expected to grow from USD 2.78 billion in 2025 to USD 3.27 billion in 2026 and is forecast to reach USD 7.39 billion by 2031 at 17.7% CAGR over 2026-2031. Escalating regulatory scrutiny, rapid cloud adoption, and the surge in real-time analytics have positioned high-quality data as a non-negotiable asset. Enterprises are pairing data quality initiatives with AI deployments because model accuracy depends on clean, reliable data. Demand is strongest for cloud-ready platforms that integrate with data lakes and low-code workflows, helping firms offset shortages of specialist talent. Vendor focus has shifted toward automated anomaly detection, predictive cleansing, and domain-specific rules that accelerate implementation in sectors such as BFSI, retail, and healthcare.
Key Report Takeaways
- By deployment type, cloud solutions held 63.45% of the data quality tools market share in 2025 and are expanding at a 19.8% CAGR through 2031.
- By organization size, large enterprises commanded 57.30% share of the data quality tools market size in 2025, while SMEs are growing at 18.9% CAGR to 2031.
- By component, software led with 69.20% revenue share in 2025; services are advancing faster at an 18.2% CAGR through 2031.
- By data domain, customer data captured 39.40% of the data quality tools market share in 2025; product data is projected to grow at 20.9% CAGR.
- By tool type, monitoring and alerting solutions are forecast to post the highest 22.0% CAGR, outpacing data profiling’s 24.60% share baseline.
- By end-user vertical, BFSI accounted for 22.70% share in 2025; retail and e-commerce is the fastest-growing segment at 23.1% CAGR.
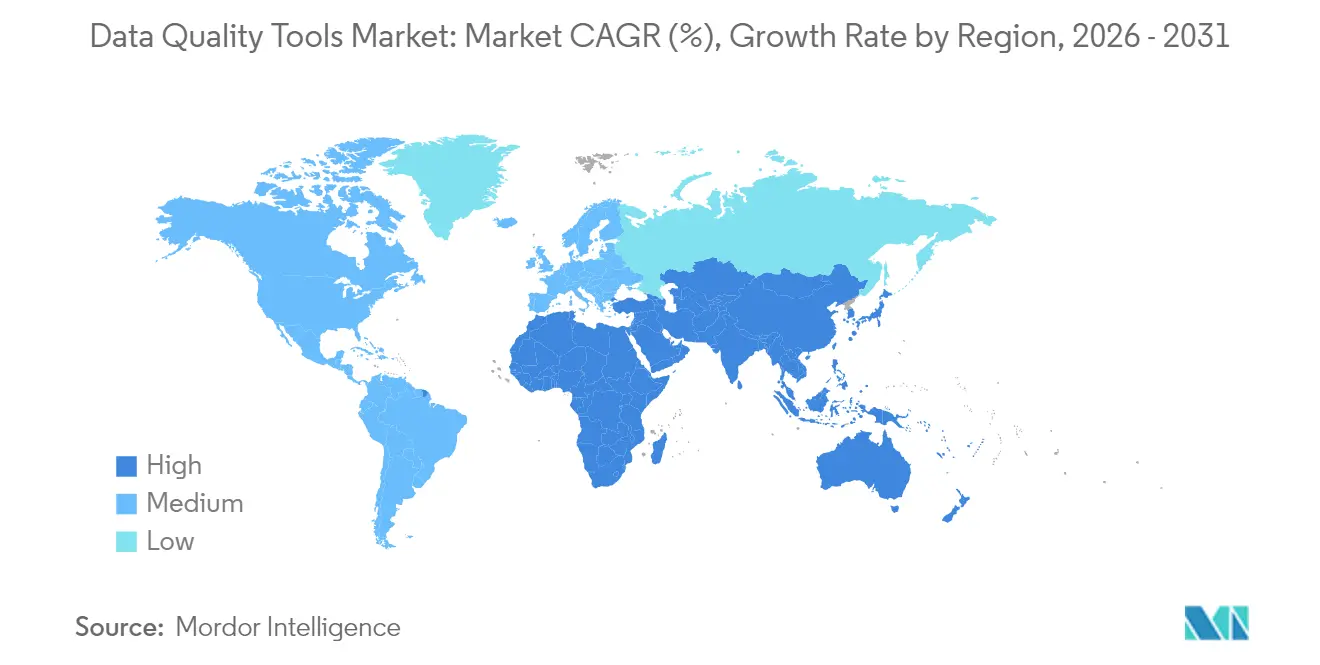
- By geography, North America dominated the market with a 35.70% share in 2025, while Asia-Pacific is emerging as the fastest-growing region with a projected CAGR of 21.7% from 2026 to 2031.
Note: Market size and forecast figures in this report are generated using Mordor Intelligence’s proprietary estimation framework, updated with the latest available data and insights as of 2026.
Market Trends and Insights
Drivers Impact Analysis of Data Quality Tools Market*
| Driver | (~) % Impact on CAGR Forecast | Geographic Relevance | Impact Timeline |
|---|---|---|---|
| Accelerated Migration of Core Banking Platforms to Cloud Driving High-Volume Data Remediation Projects in North America | 4.5% | North America, with spillover to Europe | Medium term (2-4 years) |
| Intensifying ESG-Reporting Mandates in Europe Necessitating Enterprise-Wide Data Quality Controls | 3.2% | Europe, North America, expanding to APAC | Long term (≥ 4 years) |
| AI-Driven Customer 360 Initiatives Boosting Spend on Data Profiling and Matching Tools Across APAC Retail | 2.8% | APAC, North America, Europe | Medium term (2-4 years) |
| Real-Time Fraud-Detection Pipelines in BFSI Catalysing Demand for Streaming Data Quality Engines | 2.1% | Global, with concentration in North America and Europe | Short term (≤ 2 years) |
| Vendor-Native Automation Plug-Ins Reducing Total Cost-of-Ownership for SaaS Workloads | 1.8% | Global, with early adoption in North America | Short term (≤ 2 years) |
| Healthcare Interoperability Rules (US and EU) Accelerating FHIR-Compatible Data Cleansing Solutions | 1.4% | North America, Europe | Medium term (2-4 years) |
| Source: Mordor Intelligence | |||
Accelerated Migration of Core Banking Platforms to Cloud Driving High-Volume Data Remediation Projects
Financial institutions moving legacy cores to cloud environments are prioritizing automated data remediation to keep lending and payments processes online. Mortgage approval checks that once took 4-6 hours under manual validation now run in near real time after tool deployment, improving customer experience and reducing operational risk. Cloud-native data quality engines tighten feedback loops between data ingestion, profiling and AI-driven analytics, creating a cycle in which better data increases cloud ROI, which in turn reinforces quality budgets.
Intensifying ESG-Reporting Mandates Necessitating Enterprise-Wide Data Quality Controls
SEC climate disclosures, California SB-253/SB-261, and the EU CSRD begin in January 2025 and collectively affect thousands of firms. Compliance programmes now earmark dedicated budgets for lineage, validation, and audit-readiness functionality. Boards link poor ESG data to reputational risk, pushing sustainability officers to adopt solutions that track Scope 3 emissions and verify supplier declarations [1].
AI-Driven Customer 360 Initiatives Boosting Spend on Data Profiling & Matching Tools
Retailers in APAC are consolidating clickstream, loyalty, and inventory feeds to power hyper-personalised offers. AI-enabled entity resolution lifts customer-record match rates by up to 30% against rule-based baselines, ensuring recommendation engines receive accurate profiles [2]. Continuous profiling reduces time-to-campaign and underpins omnichannel growth strategies.
Real-Time Fraud-Detection Pipelines in BFSI Catalysing Demand for Streaming Data Quality Engines
Streaming validation curbs false positives that inflate investigation costs. Banks report 30% fewer erroneous alerts after integrating sub-second cleansing with transaction scoring models. Adoption is sharpest where instant-payment schemes expose institutions to higher fraud velocity, forcing a pivot from batch to event-level quality assurance.
Restraints Impact Analysis of Data Quality Tools Market*
| Restraint | (~) % Impact on CAGR Forecast | Geographic Relevance | Impact Timeline |
|---|---|---|---|
| Persistent Technical Debt in Legacy On-Prem Data Warehouses Delaying Modern Tool Adoption | -1.9% | Global, with higher impact in North America and Europe | Medium term (2-4 years) |
| Shortage of Data Engineering Talent Limiting Effective Tool Utilisation in SMEs | -1.2% | Global, with acute impact in emerging markets | Short term (≤ 2 years) |
| Fragmented Regional Data-Residency Statutes Complicating Global Roll-Outs | -0.8% | Global, with particular complexity in Europe and APAC | Long term (≥ 4 years) |
| High Switching Costs from Embedded ETL Rule-Sets within Tier-1 ERP Suites | -0.6% | Global, with concentration in enterprise segments | Medium term (2-4 years) |
| Source: Mordor Intelligence | |||
Persistent Technical Debt in Legacy On-Prem Data Warehouses Delaying Modern Tool Adoption
Many organisations divert budgets to maintain ageing ETL jobs and proprietary databases, spending USD 3 million yearly on upkeep. Integration gaps between old schemas and modern APIs slow rollouts, leading firms in finance and healthcare to phase upgrades over multi-year roadmaps before unlocking full cloud-native quality capabilities.
Shortage of Data Engineering Talent Limiting Effective Tool Utilisation in SMEs
Job postings for data engineers have quadrupled in five years, pushing mid-level salaries to USD 125,128–157,222 and crowding SMEs out of the recruitment market. Vendors respond with low-code rule builders and guided workflows. Although these features lower entry barriers, many smaller firms still lack the data literacy to scale adoption quickly.
*Our forecasts treat driver/restraint impacts as directional, not additive. The impact forecasts reflect baseline growth, mix effects, and variable interactions.
Data Quality Tools Market Segment Analysis
By Deployment Type:
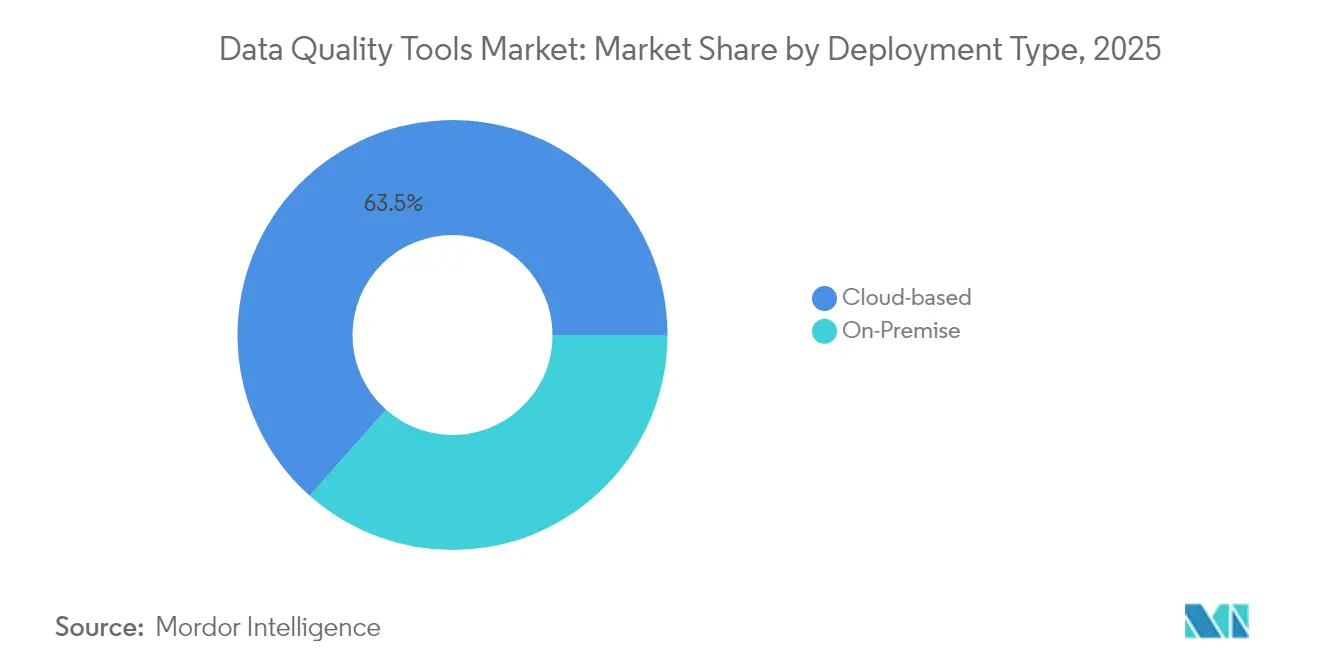
Cloud Solutions Accelerate Quality InitiativesCloud deployments generated 63.45% of data quality tools market revenue in 2025, equal to roughly USD 1.76 billion in the 2025 baseline year. Exceptional 19.8% CAGR indicates that scalability, elastic pricing, and proximity to cloud data stores outweigh security concerns for most buyers. The data quality tools market size for cloud services is set to expand rapidly as API-driven connectors simplify ingestion from SaaS sources and streaming platforms.
On-premise installations remain critical for sectors handling sensitive patient, payment, or defence data. Accounting for 36.55% of revenue in 2025, this cohort is enhancing hybrid capabilities that bridge regulated workloads with public cloud analytics. Healthcare providers illustrate the balance, retaining clinical records on site while cleansing lab feeds in HIPAA-compliant clouds.

By Size of Organization:
SMEs Embrace Accessible Quality SolutionsLarge enterprises produced 57.30% of total revenue in 2025, thanks to complex data estates spanning dozens of domains and regulatory mandates. Many run enterprise governance programmes that integrate data profiling, monitoring, and remediation into common control planes. The data quality tools market size among large enterprises is stable yet incremental.
SMEs deliver the strongest momentum with 18.9% CAGR to 2031. Pay-as-you-go pricing, consumption credits, and modular packaging lower entry costs. Case studies from UK manufacturers show that improved data quality increased product innovation velocity and enhanced competitive positioning, fostering broader adoption beyond early tech adopters.
By Component:
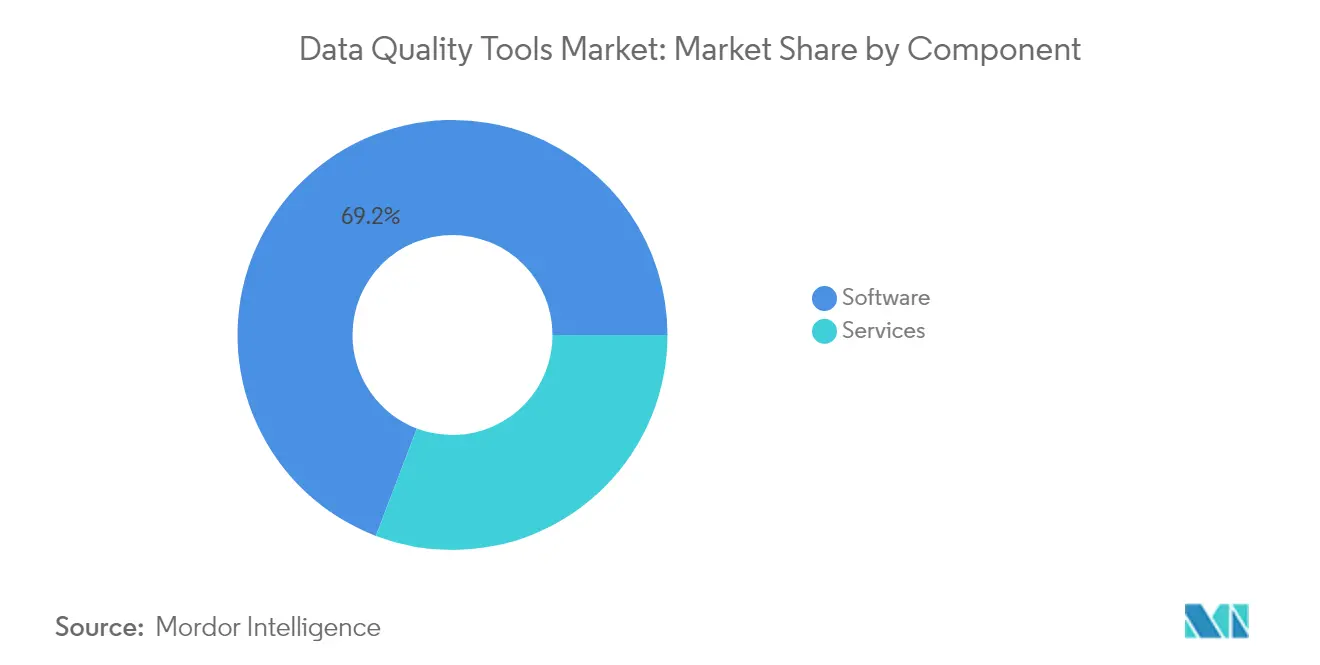
Services Growth Outpaces Software SegmentSoftware licences remained the backbone at 69.20% revenue share in 2025, translating to USD 1.92 billion in 2025. Vendors continue to embed machine learning within rules engines to surface outliers and recommend fixes automatically. Advancements in pattern recognition and predictive scoring let teams move from reactive to proactive remediation.
Services contributed 30.80% of sales but are rising at an 18.2% CAGR, outstripping software. Managed offerings cover initial assessments, rule optimisation, and continuous observability. Organisations lacking full-time data reliability teams contract experts to maintain SLAs, ensuring sustained quality without diverting scarce internal talent.
By Data Domain:
Product Data Emerges as Growth LeaderCustomer records held the largest 39.40% share in 2025, equal to USD 1.09 billion in 2025, as omni-channel engagement strategies rely on accurate identities, preferences, and consent flags. High-fidelity customer data underpins AI models for churn prediction and cross-sell recommendations.
Product information is the growth standout at 20.9% CAGR. The data quality tools market size for product data is fueled by SKU expansion, marketplace syndication, and richer attribute requirements for search filters and voice commerce. Clean product data lifts conversion rates and lowers return costs, incentivising retailers and manufacturers to prioritise quality initiatives.
By Tool Type:
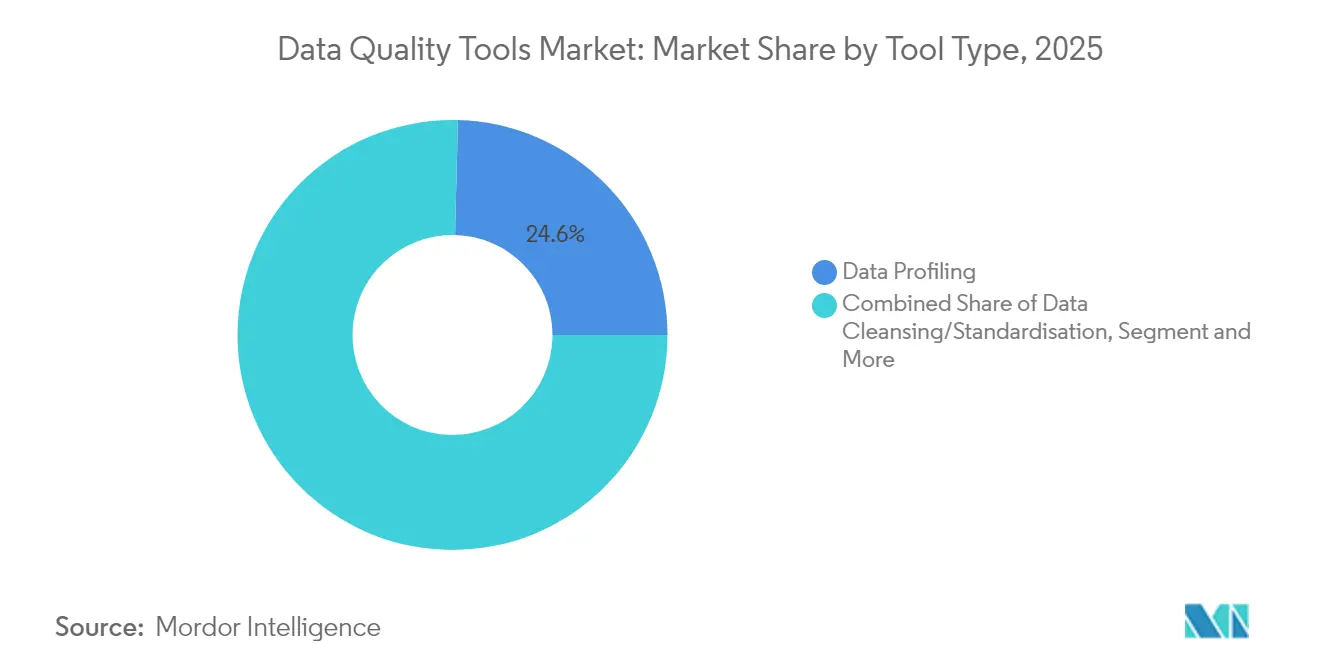
Monitoring Tools Lead Market GrowthData profiling accounted for 24.60% of revenue in 2025, or USD 0.68 billion in 2025. Profilers discover patterns, nulls, and anomalies, establishing baselines for subsequent cleansing. Enhanced visualisations now translate technical metrics into business-friendly dashboards.
Monitoring and alerting platforms are expanding fastest at 22.0% CAGR. Continuous rules check streaming pipelines, issuing instant alerts when drift surpasses thresholds. The data quality tools market size dedicated to monitoring benefits from AI models that predict rule violations and suggest preventive measures before downstream reports are affected.
By End-User Vertical:
Retail & E-commerce Drive AdoptionBFSI remained the top buyer with a 22.70% share in 2025, worth USD 0.63 billion in 2025. Regulatory filings, risk calculations, and fraud detection all demand precise, lineage-verified data. Banks integrate quality engines with core systems to satisfy BCBS 239 traceability requirements while supporting real-time analytics.
Retail and e-commerce sector purchases rise at 23.1% CAGR. Unified product catalogues, inventory feeds, and clickstream logs power personalised merchandising and supply-chain automation. Data quality directly influences customer satisfaction, pushing merchants to embed quality checks within every storefront update.
Geography Analysis
North America Data Quality Tools Market
North America generated 35.70% of global revenue in 2025, or close to USD 0.99 billion in 2025, underpinned by heavy cloud migration in financial services and advanced adoption of AI-enabled analytics. The introduction of SEC climate reporting rules strengthens the compliance rationale for enterprise-wide data controls. Vendors headquartered in the region accelerate innovation cycles, providing early exposure to new features.
APAC Data Quality Tools Market
Asia-Pacific is the fastest mover with a projected 21.7% CAGR from 2026 to 2031. Investments in 5G, e-commerce, and fintech generate vast data volumes that require quality assurances. China, India, and Japan emphasise data integrity as a pillar of digital public infrastructure, while APAC retailers deploy profiling engines to enhance Customer 360 rollouts and personalise offers.
Europe Data Quality Tools Market
Europe’s growth is steady, driven by stringent privacy and sustainability mandates. The CSRD drives demand for solutions that ensure auditable ESG disclosures. Organisations weigh cloud benefits against data sovereignty, adopting regional nodes or sovereign clouds to comply with localisation rules. Increasingly, European boards recognise clean data as foundational to digital competitiveness.
Regulatory Landscape
The regulatory environment for data quality tools is tightening as privacy, ESG disclosure, and AI governance requirements increasingly rely on demonstrable data accuracy, traceability, and bias controls. In the United States, SEC climate disclosure requirements and California SB-253/SB-261 have been driving audit-ready data practices since January 2025. In addition, California Privacy Protection Agency (CPPA) CCPA regulations effective 1 January 2026 reinforce consumer data accuracy and correction obligations, which raises the role of data profiling, monitoring, and remediation in production pipelines.
AI governance is also translating data governance into a technical requirement. The EU Artificial Intelligence Act (Regulation EU 2024/1689) Article 10 requires data governance and management practices for high-risk AI systems, pushing providers and adopters to document dataset suitability and mitigate bias in training and validation data. Standards and guidance further anchor procurement and controls, including ISO/IEC 27701:2025 for privacy information management and ISO/IEC 5259 (2024) for measuring and reporting data quality in analytics and ML. NIST updated its Information Quality Standards on 8 July 2026 and published additional AI evaluation guidance in February 2026, reinforcing formalized, testable quality criteria for data used in regulated reporting and AI systems.
Competitive Landscape
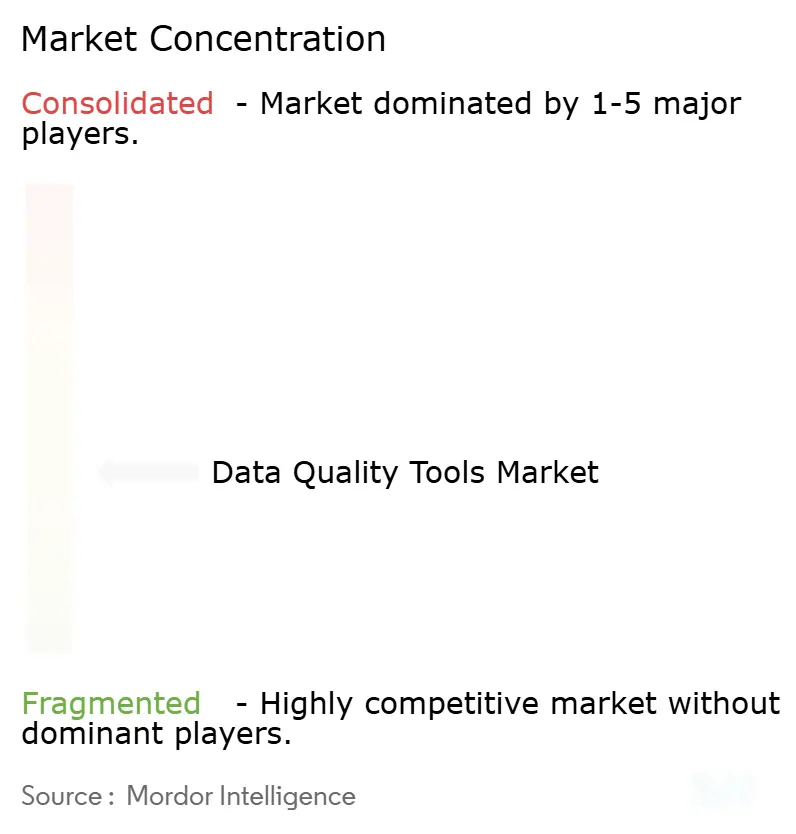
Market concentration is moderate. Established vendors such as Informatica, SAP, IBM, and Microsoft compete with specialist providers including Collibra, Ataccama, and Precisely. Differentiation centres on AI automation depth, cloud-native architecture, and out-of-the-box industry rule packs. Partnerships with hyperscalers extend reach and reduce integration friction, while acquisitions target gap fillers such as data observability and policy enforcement engines.
Emerging players leverage large-language-model-based rule generation, proactive drift detection, and synthetic test-data creation. Patent filings surged in 2024, exemplified by Egnyte’s portfolio covering unified access control and subject-access request optimisation. White-space opportunities exist around unstructured content quality, IoT streaming validation, and distributed data fabric enforcement.
First-mover vendors embed quality checks within broader data platform stacks, bundling governance, lineage, and observability. Buyers increasingly favour integrated suites over point tools, valuing reduced vendor management overhead and consistent rule propagation across data domains.
Data Quality Tools Industry Leaders
-
IBM Corporation
-
Oracle Corporation
-
SAP SE
-
Informatica Inc.
-
Talend Inc.
- *Disclaimer: Major Players sorted in no particular order
Data Quality Tools Market Companies Covered in this Report
- Informatica Inc.
- IBM Corporation
- SAP SE
- Oracle Corporation
- SAS Institute Inc.
- Precisely (Syncsort)
- Talend Inc.
- Experian PLC
- Ataccama Corp.
- Microsoft Corp.
- Collibra NV
- TIBCO Software Inc.
- Alteryx Inc.
- Dun and Bradstreet Holdings Inc.
- Moody’s Analytics/Bureau van Dijk
- Information Builders (ibi/TIBCO)
- Data Ladder LLC
- Melissa Data Corp.
- Innovative Systems Inc.
- ASG Technologies
Market Opportunities and Future Outlook
A near-term whitespace is emerging at the intersection of AI governance and operational data quality, where teams need pipeline-level validation, bias controls, and traceable evidence that model inputs are fit for purpose. The EU AI Act Article 10 data governance requirements, along with the start of enforcement from 2 August 2026, creates a buying trigger for toolchains that connect profiling, monitoring, lineage, and rule execution directly to model risk controls, particularly in BFSI and other high-risk AI use cases. Vendor positioning is already moving in this direction, including Ataccama highlighting EU AI Act-aligned validation capabilities for financial institutions.
Another opportunity area is unified quality across hybrid and multi-cloud estates. Organizations want fewer point integrations and more reusable rule packs across domains (customer, product, risk and compliance) and across deployment modes. Cloud-based deployments accounted for 63.45% of market revenue in 2025, and buyers increasingly pair quality with broader data platforms and governance stacks to reduce switching costs from embedded ETL rule sets inside tier-1 suites. Growth is also supported by domain-specific compliance packaging beyond North America and Europe, illustrated by vendors publishing quality tooling aligned to regional control frameworks such as SAMA CSF, alongside rising demand for observability-style monitoring and alerting as real-time fraud detection pipelines and streaming analytics extend quality requirements from batch data stores to continuous data flows.
Recent Industry Developments in Data Quality Tools Market
- May 2026: SAP announced that SAP Master Data Governance is now a core component of SAP Business Data Cloud and outlined SAP BDC Connect for Amazon Athena with general availability planned for H2 2026. The move tightens integration between governance, master data, and analytics layers, reinforcing suite-based buying for data quality and compliance controls in hybrid data estates.
- March 2026: SAP agreed to acquire Reltio, adding a specialist master data management platform to strengthen AI-ready data foundations. Combining MDM and governance capabilities supports enterprise programs focused on Customer 360, risk and compliance domains, and consistent data quality rules across systems.
- September 2024: Oracle introduced an intelligent data lake and generative AI-powered analytics capabilities for the Oracle Data Intelligence Platform. Bringing GenAI into the analytics and data platform stack increases the emphasis on continuous monitoring, profiling, and remediation to keep AI-driven insights aligned with reliable enterprise data.
Data Quality Tools Market Report Scope and Research Methodology
Market Definition and Coverage
For this study, the market covers software and cloud subscriptions that help organizations profile, cleanse, match, enrich, and monitor data so it stays accurate and usable across business systems and analytics.
Scope exclusions: Services-only engagements, one-time advisory work, and generic ETL or ELT pipelines that do not function as dedicated data quality tools are excluded.
Segments Covered in This Report
- By Deployment Type
- Cloud-based
- On-Premise
- By Size of the Organization
- Small and Medium Enterprises
- Large Enterprises
- By Component
- Software
- Services
- By Data Domain
- Customer Data
- Product Data
- Financial Data
- Supplier and Vendor Data
- Risk and Compliance Data
- By Tool Type
- Data Profiling
- Data Cleansing / Standardisation
- Data Matching and De-Duplication
- Monitoring and Alerting
- Master Data Management-Centric Tools
- By End-User Vertical
- BFSI
- Government and Public Sector
- IT and Telecom
- Retail and E-commerce
- Healthcare and Life Sciences
- Other Industries (Manufacturing, Utilities, Media)
- By Geography
- North America
- United States
- Canada
- Mexico
- South America
- Brazil
- Argentina
- Chile
- Peru
- Rest of South America
- Europe
- Germany
- United Kingdom
- France
- Italy
- Spain
- Rest of Europe
- Asia-Pacific
- China
- Japan
- South Korea
- India
- Australia
- New Zealand
- Rest of Asia-Pacific
- Middle East and Africa
- United Arab Emirates
- Saudi Arabia
- Turkey
- South Africa
- Rest of Middle East and Africa
- North America
Data Sources, Market Sizing, and Validation
Desk Research
Desk work started by mapping demand context for data quality tooling and the triggers that push adoption, such as compliance requirements, cloud migration programs, and ongoing analytics initiatives. For broad IT spending direction, we referred to public sources including the US Census Bureau and Bureau of Economic Analysis. For data-handling and security related practices, NIST publications were used as a reference point. To sanity check regional digitization trends, OECD digital economy datasets were reviewed.
Regulatory and policy signals were also checked using sources such as the European Commission and US Federal Register updates, since privacy and reporting rules can increase pressure to improve data quality and reduce reporting risk.
On the supplier side, we reviewed company annual reports, earnings call transcripts, and investor presentations to understand how vendors describe revenue streams linked to data quality capabilities. Reputed press coverage, product documentation, and association websites (including data management communities and standards groups) were used to confirm the feature boundaries we apply, including profiling, cleansing, matching, and monitoring. In parallel, we used a paid subscription for company financials and intelligence to speed up cross-checks on reported revenue splits and regional exposure. These desk research sources are illustrative, and we also used other public documents to collect supporting data points, validate assumptions, and clarify items where published descriptions were unclear.
Primary Interviews and Surveys
Primary discussions were completed with tool providers, cloud and systems integration partners, and enterprise users who manage data governance and analytics roadmaps. We used these calls to confirm how buyers classify a data quality tool versus adjacent software, and to test pricing patterns, renewal behavior, and typical deployment mixes across major regions.
Distribution of primary research fieldwork respondents
| Company type | Respondent position | Region |
|---|---|---|
| Top tier: 29% | CXOs: 14% | APAC: 44% |
| Mid tier: 53% | Functional/Unit leaders: 28% | EMEA: 36% |
| Smaller Players: 18% | Managers: 58% | Americas: 20% |
Market-Sizing & Forecasting
Sizing was built using both top-down and bottom-up logic. First, enterprise software and data management spending indicators were translated into an addressable pool for data quality. Then we checked that pool against supplier side reality checks.
The top-down approach used adoption and penetration assumptions tied to cloud data platform rollouts, governance and compliance intensity, and the growing use of analytics in operations, which guided the demand pool by region. We corroborated these totals with selective bottom-up approximations, using sampled vendor revenue disclosures where available, partner channel checks, and typical annual subscription pricing ranges multiplied by estimated active customer footprints.
In the model, we tracked practical inputs including cloud versus on-prem deployment mix, average contract duration and renewal rates, pricing tiers by organization size, and how often tool bundles are sold as part of larger data platforms. When revenue for a bundled module was not separately visible, we treated it as a gap and kept it out unless primary conversations supported a defensible allocation method. For forecasting, we ran scenario analysis around three drivers that moved together in interviews, namely regulatory pressure, cloud migration speed, and analytics program maturity. Growth paths were reviewed against recent spending direction before finalizing the trajectory.
Data Validation & Update Cycle
Outputs were validated by comparing implied spend per adopting organization with interview-based benchmarks and with broader IT and software spending direction by region. We flagged outliers when growth rates or regional splits moved away from known signals, then revisited assumptions before the final review pass. Variance checks were also run across pricing, adoption, and renewal inputs to reduce the risk that a single aggressive parameter drove the overall result.
The model and narrative go through multiple analyst reviews, and we trigger a re-contact when a new regulation, a major product shift, or a sudden macro change makes prior assumptions less reliable. The report is refreshed annually, and interim updates are made for material events. Before delivery, we complete a last pass so clients receive the most current view available at that time.
Mordor Intelligence's Data Quality Tools Market Estimate Compared With Other Published Estimates
Published market values for data quality tools can vary even when they appear to describe the same category, since scope, base year, and what gets counted as tool revenue are not consistent across sources. Differences also come from how firms treat bundled platforms, whether services are added to the totals, and how quickly assumptions are refreshed when cloud pricing and adoption trends change.
Services like consulting and managed offerings sit outside Mordor Intelligence's scope for this market, which is one reason some published totals that include implementation work do not align with the software and subscription focused sizing used here.
Benchmark comparison
| Source | Market Size | Gaps in Research Methodology |
|---|---|---|
| Mordor Intelligence | USD 2.78 B (2025) | |
| Industry Publisher A | USD 3.31 B (2025) | Includes services revenue (such as consulting, system integration, and training) alongside software, which expands the counted spend beyond tools and subscriptions. |
| Industry Publisher B | USD 2.82 B (2025) | Uses a slightly broader functional definition that can fold in adjacent governance or observability capabilities, and applies different pricing and adoption assumptions for cloud deployments. |
The spread is mainly explained by what is counted around the tool license or subscription, and how bundled capabilities are treated when revenue is not clearly separated. By keeping the model tied to tool-specific functions and cross-checking pricing and adoption with interviews, the estimate remains traceable to defined inputs and can be repeated when assumptions are updated.
Key Questions Answered in the Report
What is the current value of the data quality tools market?
The data quality tools market is valued at USD 3.27 billion in 2026.
How fast is the market expected to grow?
It is projected to register a 17.7% CAGR, reaching USD 7.39 billion by 2031.
Which deployment model is growing the quickest?
Cloud-based solutions are expanding at a 19.8% CAGR and already represent 63.45% of revenue.
Why are data quality tools critical for ESG reporting?
Regulations such as the SEC climate rule and EU CSRD require auditable, high-fidelity data, pushing firms to adopt lineage and validation capabilities.
Which industry vertical is adopting data quality tools the fastest?
Retail and e-commerce lead growth with a 23.1% CAGR due to omnichannel product data requirements and personalised customer experiences.
How does talent scarcity affect tool adoption in SMEs?
Limited access to data engineers raises implementation barriers, prompting vendors to offer low-code, guided interfaces to reduce skills dependency.