
Data Monetization Market Size and Share
Market Overview
| Study Period | 2020 - 2031 |
|---|---|
| Market Size (2026) | USD 5.67 Billion |
| Market Size (2031) | USD 12.66 Billion |
| Growth Rate (2026 - 2031) | 17.41% CAGR |
| Fastest Growing Market | Asia Pacific |
| Largest Market | North America |
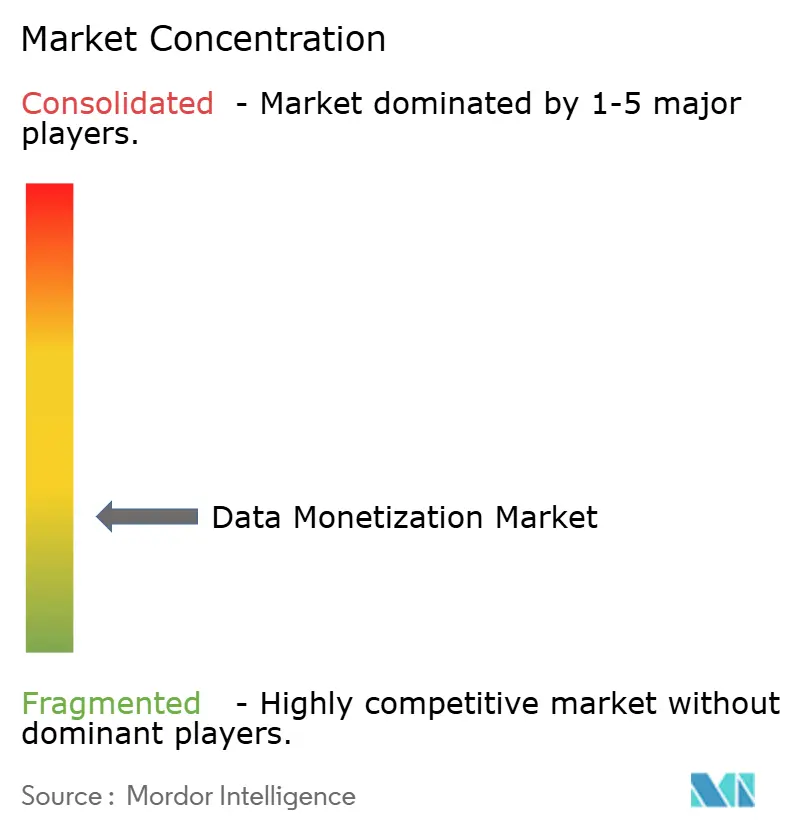
| Market Concentration | Low |
Major Players *Disclaimer: Major Players sorted in no particular order Image © Mordor Intelligence. Reuse requires attribution under CC BY 4.0. | |
Data Monetization Market Analysis by Mordor Intelligence
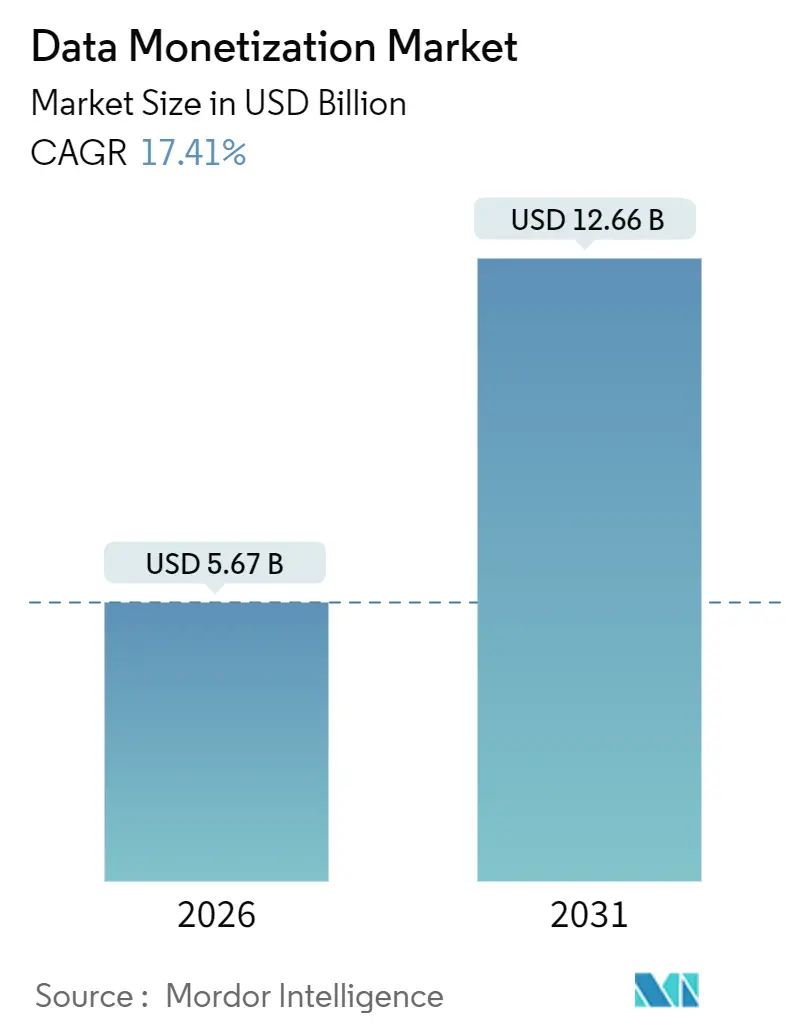
The data monetization market size is USD 5.67 billion in 2026 and is projected to reach USD 12.66 billion in 2031, advancing at a 17.41% CAGR. Demand is accelerating because enterprises now view data as a tradeable asset, and tokenization plus synthetic-data techniques have lowered historic privacy barriers. Regulatory open-data mandates in the European Union and India, combined with self-service cloud marketplaces, are shortening sales cycles and pulling new buyers into the ecosystem. Competitive intensity sits in a mid-range band, with no vendor holding double-digit share, yet hyperscalers remain gatekeepers through bundled marketplace capabilities and control of cloud-egress pricing. Risks stem from fragmented privacy laws and continuing cloud-egress fees that depress cross-platform trading economics. Asia Pacific is the fastest-growing region, while North America still generates the largest absolute revenue.
Key Report Takeaways
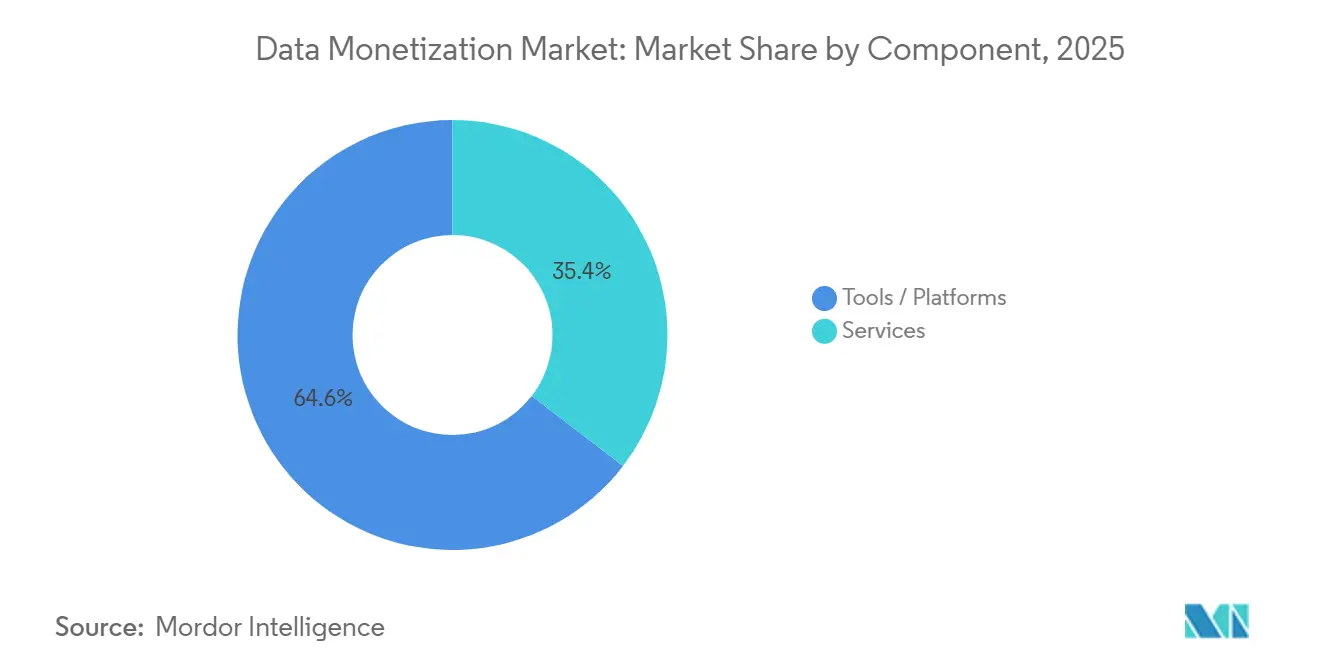
- By component, software and tools accounted for 64.58% of the data monetization market share in 2025, while services are forecast to expand at a 19.02% CAGR through 2031.
- By deployment mode, on-premises installations retained 59.76% share in 2025, yet cloud deployment is expected to advance at a 19.66% CAGR to 2031.
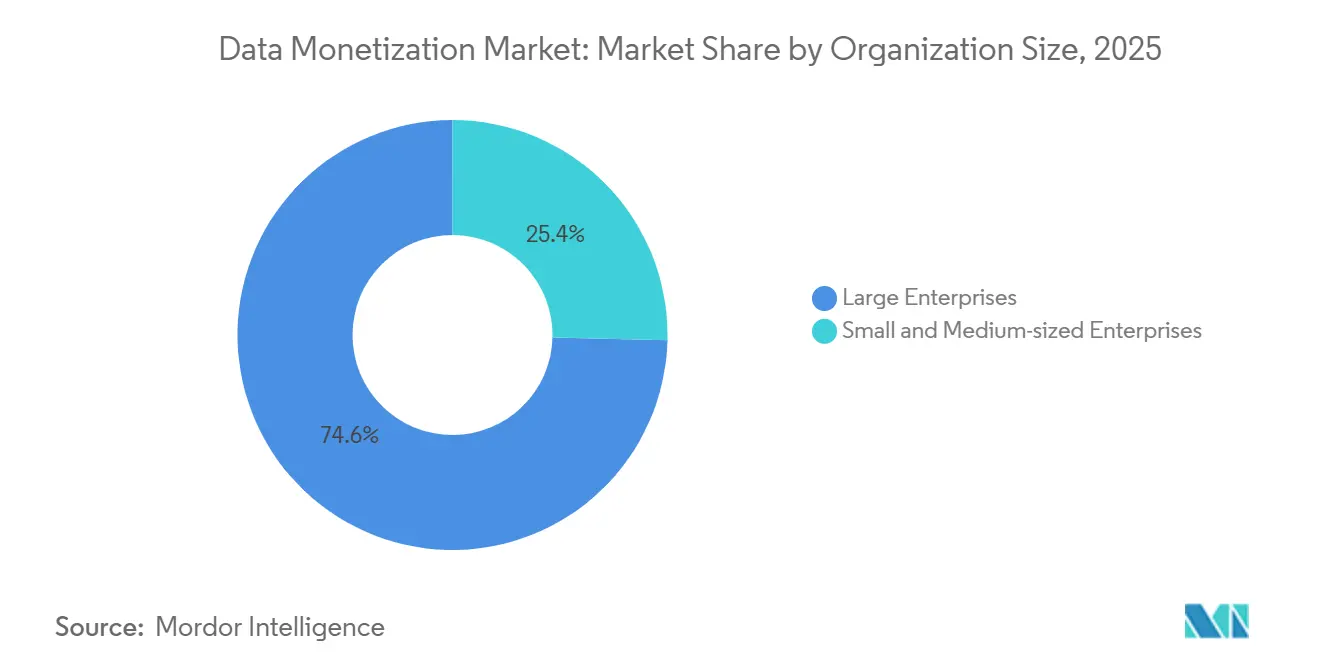
- By organization size, large enterprises contributed 74.62% share in 2025 whereas small and medium-sized enterprises are projected to grow at a 20.64% CAGR through 2031.
- By end-user industry, IT and telecommunications led with 29.22% of 2025 revenue, while retail and e-commerce is anticipated to register a 17.88% CAGR to 2031.
- By geography, North America dominated with 45.26% share in 2025, and Asia Pacific is set to post an 18.24% CAGR through 2031.
Note: Market size and forecast figures in this report are generated using Mordor Intelligence’s proprietary estimation framework, updated with the latest available data and insights as of January 2026.
Global Data Monetization Market Trends and Insights
Drivers Impact Analysis*
| Driver | (~)% Impact on CAGR Forecast | Geographic Relevance | Impact Timeline |
|---|---|---|---|
| Rapid Adoption of Advanced Analytics and Visualization | +3.2% | Global, with concentration in North America and Western Europe | Medium term (2-4 years) |
| Increasing Volume and Variety of Enterprise Data | +4.1% | Global, accelerated in APAC manufacturing and telecom hubs | Long term (≥ 4 years) |
| Regulatory Mandates Driving Open-Data Ecosystems | +2.8% | Europe (EU Data Act), North America (state-level initiatives), APAC (India, China) | Short term (≤ 2 years) |
| Enterprise Adoption of Data Marketplaces Enabling B2B Data Trading | +3.5% | North America and Europe early movers, APAC following | Medium term (2-4 years) |
| Generative AI-Enabled Creation of Privacy-Safe Synthetic Data | +2.6% | Global, with healthcare and finance leading in North America and Europe | Medium term (2-4 years) |
| Tokenization of Data Assets Via Blockchain for New Revenue Streams | +1.3% | Pilot-stage in North America and Middle East, limited near-term scale | Long term (≥ 4 years) |
| Source: Mordor Intelligence | |||


Rapid Adoption of Advanced Analytics and Visualization
Self-service business-intelligence platforms are collapsing the time from raw data ingestion to monetizable insight, enabling product managers and sales teams to package analytics as standalone offerings without relying on centralized IT. SAP Analytics Cloud and Microsoft Power BI now support embedded analytics that let software vendors white-label dashboards inside their applications, converting telemetry into recurring revenue streams. MicroStrategy's HyperIntelligence overlays contextual metrics on top of enterprise workflows, reducing the friction of switching between operational systems and analytics consoles.
Increasing Volume and Variety of Enterprise Data
IoT sensor deployments, edge-computing arrays, and application-programming-interface ecosystems are generating petabyte-scale datasets that exceed the absorptive capacity of internal analytics teams, pushing enterprises to externalize surplus data through marketplaces or direct licensing. Manufacturing plants now instrument assembly lines with vision systems and vibration sensors that produce real-time quality metrics, which equipment vendors monetize by offering predictive-maintenance subscriptions to peer factories. Telecom operators capture anonymized mobility patterns from cell-tower handoffs, selling aggregated flows to urban planners and retail-site selectors.
Regulatory Mandates Driving Open-Data Ecosystems
The EU Data Act, effective September 2025, compels manufacturers of connected products to provide data access to users and authorized third parties, effectively legislating interoperability and lowering the switching costs that previously locked datasets inside proprietary ecosystems, according to the European Commission. India's Digital Personal Data Protection Act of 2023 introduced consent managers that let individuals grant and revoke data-sharing permissions in real time, creating a compliance-friendly channel for enterprises to acquire consumer data for monetization.
Enterprise Adoption of Data Marketplaces Enabling B2B Data Trading
Snowflake's Data Marketplace, which hosts over 2,000 live datasets as of early 2025, allows providers to list curated tables that buyers can query without egress fees, eliminating the friction of file transfers and format conversions, according to Snowflake. AWS Data Exchange similarly enables sellers to publish APIs and S3 snapshots, with automated billing tied to consumption metrics. These platforms are shifting data transactions from bespoke contracts negotiated over months to self-service purchases completed in minutes, a velocity change that mirrors the SaaS revolution of the prior decade.
Restraints Impact Analysis*
| Restraint | (~)% Impact on CAGR Forecast | Geographic Relevance | Impact Timeline |
|---|---|---|---|
| Interoperability Hurdles with Legacy Architectures | -2.1% | Global, acute in North America and Europe with aging enterprise IT | Medium term (2-4 years) |
| Data Quality Inconsistencies Hindering Monetization Potential | -1.8% | Global, pronounced in manufacturing and healthcare sectors | Short term (≤ 2 years) |
| Fragmented and Evolving Data-Privacy Regulations | -1.5% | Global, with divergence between EU, US state-level, and APAC frameworks | Long term (≥ 4 years) |
| Escalating Cloud-Egress Fees Undermining Data-Sharing ROI | -1.2% | Global, concentrated among multi-cloud enterprises | Short term (≤ 2 years) |
| Source: Mordor Intelligence | |||
Interoperability Hurdles with Legacy Architectures
Enterprises operate a median of 14 distinct data repositories, including relational databases, data lakes, SaaS application silos, and on-premises warehouses, each with proprietary schemas and access protocols that resist federation. Integrating these sources into a unified monetization layer requires extract-transform-load pipelines, API gateways, and semantic harmonization, investments that can exceed USD 5 million for a Fortune 500 firm and take 18 months to operationalize. The strategic risk is that by the time integration completes, the datasets may have lost market relevance or regulatory permissions may have expired.
Data Quality Inconsistencies Hindering Monetization Potential
IBM's 2024 study quantified that poor data quality costs the average organization USD 12.9 million annually through rework, compliance penalties, and lost revenue opportunities, according to IBM. Inconsistent timestamps, duplicate records, and missing values degrade the utility of datasets, forcing buyers to invest in cleansing before they can extract insights. The monetization consequence is that sellers must either pre-clean data absorbing costs that compress margins or discount prices to reflect quality risk, which depresses market valuations.
*Our forecasts treat driver/restraint impacts as directional, not additive. The impact forecasts reflect baseline growth, mix effects, and variable interactions.
Segment Analysis
By Component: Services Capture Growth Momentum
Services are forecast to outpace tools, climbing at 19.02% from 2026 to 2031 even though tools commanded 64.58% of 2025 revenue. This variation shows that enterprises buy expertise to translate raw datasets into saleable products. Professional integrators design governance frameworks and negotiate marketplace onboarding, which compresses launch timelines. Within the tooling stack, data-integration platforms dominate because they harmonize disparate schemas, yet analytics front-ends are accelerating as no-code interfaces lower adoption barriers.
Managed services appeal to mid-sized firms that lack in-house data engineers, allowing them to offer subscription-based data products without capital expenditure. The data monetization market size contribution from services is set to rise as confidential computing reduces residency concerns. Partnerships between cloud providers and global systems integrators further expand service catalogs. Microsoft reported that 40% of Azure Synapse revenue flowed through managed-service channels in 2025.[1]Microsoft, “Azure Synapse Analytics Partner Ecosystem Report,” MICROSOFT.COM

By Deployment Mode: Cloud Adoption Accelerates
On-premises still held 59.76% share in 2025, largely within finance and healthcare. Confidential-computing enclaves now encrypt data in use, which satisfies auditors and unlocks cloud migration. Cloud installations are projected to advance at 19.66% CAGR, narrowing the historical gap. Hybrid fabrics combine on-premises warehouses with cloud lakes, creating a single logical layer from which sellers expose tables without relocation.
The EU Data Act obliges providers to support data portability, which eases fears of lock-in and boosts cross-border trading.[2]European Commission, “Data Act,” EUROPA.EU BigQuery Omni and Snowflake cross-cloud replication neutralize egress fees inside the same region, yet replication costs remain a consideration. Vendors that abstract location while preserving governance, such as data-mesh platforms, enjoy rising demand. Overall, the deployment mix is shifting toward flexible fabrics that support monetization at scale.
By Organization Size: SMEs Scale Quickly
Large enterprises supplied 74.62% of the organization-size segmentation in 2025, reflecting the metric’s isolation from other cuts. SMEs, however, will expand at 20.64% CAGR through 2031, driven by freemium analytics tiers and consumption-based cloud pricing. Marketplaces handle payment processing and compliance, so a regional logistics firm can list geospatial datasets beside Fortune 500 offerings. SMEs focus on high-fidelity niches such as hyperlocal weather or specialty retail baskets that fetch premium prices due to scarcity.
Deloitte found that SME data products carry 30% higher margins than those from large firms. Discoverability remains a hurdle; keyword-rich catalog entries and automated quality scores help smaller sellers gain visibility. Platform providers that offer marketing toolkits for SMEs therefore capture additional gross merchandise value. The segment’s velocity evidences democratization within the data monetization market.
By End-User Industry: Retail Media Networks Surge
IT and telecommunications held 29.22% revenue share in 2025 by monetizing anonymized mobility data for urban-planning buyers. Retail and e-commerce is poised for the fastest growth at 17.88% CAGR to 2031 as retail media networks convert first-party shopper data into advertising inventory. Closed-loop attribution gives retailers a clear edge over traditional advertising channels. Healthcare institutions rely on synthetic electronic health records that mirror clinical patterns without exposing identifiers, opening new licensing paths for drug-discovery partners.
Manufacturing, logistics, and energy trail in maturity but produce vast telemetry, so these verticals represent future white-space. Financial institutions monetize credit-bureau feeds and transaction analytics, though cross-border transfers remain tightly regulated. Government agencies publish open data that private resellers enrich with analytics. Each vertical shows distinct privacy and interoperability constraints that shape the monetization strategy.
Geography Analysis
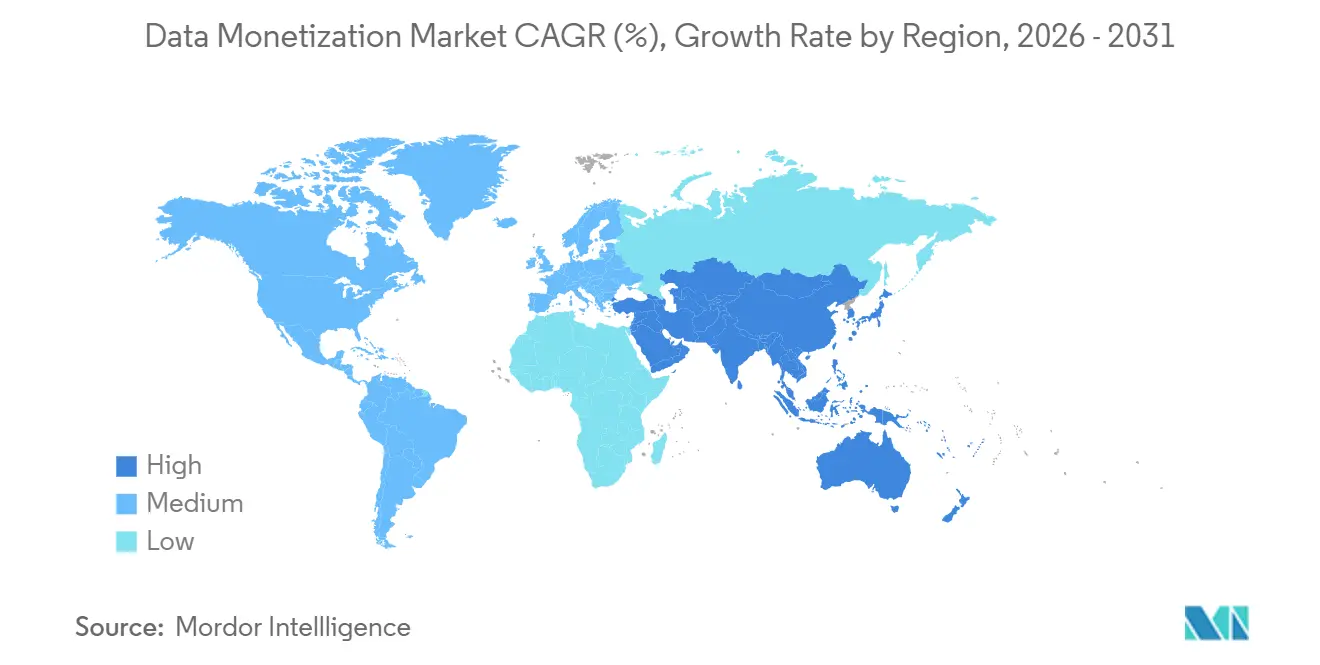
North America delivered 45.26% of 2025 revenue, reflecting mature analytics stacks, dense buyer ecosystems, and the early rollout of enterprise data marketplaces. State-level privacy statutes such as the California Consumer Privacy Act introduce compliance complexity, yet they also encourage investment in governance tools that streamline sharing and thus stimulate monetization. The region’s hyperscalers provide bundled marketplace rails, driving favorable network effects for sellers that already store data on the same platforms. Urban planners, hedge funds, and advertising agencies collectively underpin robust demand, making liquidity high relative to other regions.
Asia Pacific is the fastest-growing territory with an 18.24% CAGR through 2031, supported by India’s Digital Personal Data Protection Act and China’s Personal Information Protection Law, both of which clarify consent protocols for commercial data use. Regulatory certainty has lowered legal risk and encouraged multinationals to base data-exchange hubs in Singapore and Tokyo. Manufacturing telemetry from smart factories in Japan and South Korea comprises a fresh supply pool, while Southeast Asian e-commerce and fintech players create rising demand. Governments across the region are funding data-center capacity, which reduces latency and keeps residency in-country.
Europe exhibits steadier growth because GDPR remains stringent, yet the EU Data Act now obliges connected-device manufacturers to provide user-level data access, expanding B2B trading potential. Industrial IoT datasets, especially automotive and machinery telemetry, stand to benefit from mandated interoperability. However, localization rules can delay cross-border deals, urging vendors to adopt federated learning that leaves data in place. Latin America, the Middle East, and Africa represent nascent markets where digital infrastructure is improving but buyer ecosystems are still forming. Smart-city projects and mobile-money systems present future opportunities once legal frameworks stabilize. Collectively, geographic diversification helps to smooth cyclical variances in individual economies.

Regulatory Landscape
Policy is shifting from voluntary sharing to mandated access and interoperability, which is shaping how connected-product, cloud, and public-sector datasets can be commercialized. In the European Union, the EU Data Act entered into application on September 12, 2025, establishing rules for fair access to and use of data, including B2B data-sharing obligations and a framework for reasonable compensation tied to dissemination rather than data-collection costs. This sits alongside EU data-space and governance initiatives and is reinforced by national implementing activity, including Germany bringing into force its Daten-Governance-Gesetz (DGG) in May 2026.
In the United States, federal open-data requirements under the Evidence Act and the OPEN Government Data Act continue to push agencies to maintain public data inventories and use persistent identifiers, supporting downstream reuse and commercialization of value-added datasets. In March 2026, Senators Ted Budd and Andy Kim introduced the Artificial Intelligence Ready Data Act, signaling an additional policy vector focused on making government datasets AI-ready through standards work (notably referencing NIST and OSTP guidance), even as enactment status and timelines remain subject to the legislative process. Across APAC, initiatives such as Japan Cabinet approval of a bill in April 2026 to amend the Digital Procedure Act toward a certification-based government-to-business data-sharing framework further underline a global move toward structured, compliance-oriented data exchange.
Value Chain Analysis
The value chain starts with data generation and ownership (connected devices, enterprise applications, telecom networks, and public-sector sources), then moves through collection and instrumentation, consent and rights management, and curation steps such as cleansing, labeling, metadata management, and lineage. Monetizable packaging typically takes the form of datasets, APIs, dashboards/insights, or derived products such as synthetic data. Distribution and commercial execution increasingly run through cloud marketplaces and data exchanges, for example Snowflake Data Marketplace and AWS Data Exchange referenced in the report context, while systems integrators and managed service providers accelerate onboarding, governance setup, and commercialization.
Downstream, buyers operationalize data through analytics and AI stacks, embedding outcomes into business workflows (risk, marketing, supply chain, and product optimization), while governance specialists provide auditability for privacy and contractual controls. The key friction points remain interoperability and portability across repositories and clouds, along with economic drag from cloud-egress fees in multi-cloud trading. Regulation is also becoming a direct value-chain determinant: the EU Data Act (applicable since September 2025) and related national initiatives, including Germany's DGG entering into force in May 2026 and Japan moving toward certified government-to-business data sharing in April 2026, push participants toward standardized access interfaces, clearer data-rights allocation, and more formal operating models for third-party access.
Competitive Landscape
The field remains moderately fragmented, with no participant exceeding a 10% revenue share. Hyperscalers such as AWS, Microsoft Azure, and Google Cloud bundle data-exchange services into their infrastructure portfolios, thus anchoring sellers that already rely on their storage and compute offerings. Snowflake differentiates by eliminating intra-cloud egress fees and offering cross-cloud replication, which addresses the USD 100 billion egress friction identified by Cloudflare. Governance specialists like Collibra and Informatica focus on metadata lineage, supplying the audit trails required for GDPR and CCPA compliance. Niche exchanges, including Dawex and Narrative, curate vertical catalogs, for example, industrial IoT or advertising identifiers.
White-space resides in industries with heavy telemetry but limited data-trading norms, especially manufacturing, logistics, and energy. Vendors are piloting federated learning so sellers can earn royalties on model outcomes without relinquishing raw files, sidestepping privacy and egress hurdles. Tokenization remains experimental yet strategically significant; blockchain rails could automate royalty distribution once regulatory clarity emerges.[3]World Economic Forum, “Tokenization of Real-World Assets,” WEFORUM.ORG Consolidation is underway as governance and quality-scoring providers merge to create end-to-end platforms. Collibra’s 2025 acquisition of Alation’s metadata unit exemplifies the move toward integrated control planes. Overall competition is shifting from single-function tools toward ecosystem plays that span ingestion, quality, compliance, and marketplace exposure.
Data Monetization Industry Leaders
Accenture plc
Adastra Corporation
Amazon Web Services Inc.
Cisco Systems Inc.
Collibra NV
- *Disclaimer: Major Players sorted in no particular order

Market Opportunities and Future Outlook
A major whitespace sits in converting mandated or low-margin raw access into higher-value products that withstand privacy and portability scrutiny. The EU Data Act, applicable from September 12, 2025, requires connected-product makers to provide users access to certain usage data, and it also introduces design-by-default expectations for data sharing for products placed on the EU market by September 12, 2026. That compliance pressure creates room for platforms and services that help firms package enriched datasets, predictive insights, and governed APIs (rather than simply releasing raw telemetry), along with governance tooling that operationalizes consent, compensation logic, and audit trails across multiple counterparties.
Cross-industry commercialization is also widening beyond classic data marketplace listings into sector-specific ecosystems anchored on first-party identity and workflow automation. In July 2026, ten European media groups and partners launched the European Media Marketplace, using deterministic first-party data and an AI-enabled planning layer, highlighting a path where publishers, telecom operators, retailers, and adtech coordinate to monetize data without relying solely on third-party identifiers. In parallel, publisher-facing compensation and provenance mechanisms are emerging, illustrated by July 2026 activity around ledger-style tracking aligned with IAB Tech Lab work on AI content usage frameworks. Telecom is another active corridor, with operators and partners emphasizing standardized network APIs (such as location, identity, and QoS signals) as programmable, repeatable assets for financial services, logistics, and media use cases, expanding the addressable set of monetizable products beyond static datasets.
Recent Industry Developments
- June 2026: Accenture Ventures made a strategic investment in AlphaSense and partnered to embed market intelligence into agentic workflows for enterprises. The move ties external and internal data sources more tightly to decision automation, supporting monetizable insight products delivered inside day-to-day business processes.
- July 2025: Adastra announced the availability of three agentic AI offerings in the new AWS Marketplace AI Agents and Tools category. Listing agentic capabilities in a hyperscaler marketplace streamlines procurement and deployment for buyers building data products, while giving services-led providers a faster route to global distribution.
- December 2024: Adastra became a launch partner for Amazon SageMaker Unified Studio with unified analytics solutions. Early alignment with an integrated build-and-deploy environment strengthens implementation positioning for enterprises operationalizing governed data and AI pipelines, a core prerequisite for repeatable data monetization.


Research Methodology Framework and Report Scope
Market Definition and Coverage
This market tracks the revenue earned when organizations turn data assets into paid products or outcomes, such as packaged datasets, APIs, insight subscriptions, and revenue-sharing data services. It includes enabling software, tools, and related implementation support used to commercialize data.
Scope exclusions: We exclude standalone consumer data brokerage that mainly resells raw personally identifiable information (PII).
Segmentation Overview
- By Component
- Tools / Platforms
- Data Integration and Management Tools
- Analytics and Visualization Tools
- Services
- Professional Services
- Managed Services
- Tools / Platforms
- By Deployment Mode
- On-Premises
- Cloud
- Hybrid
- By Organization Size
- Small and Medium-Sized Enterprises
- Large Enterprises
- By End-User Industry
- Banking, Financial Services, and Insurance (BFSI)
- Telecom and IT
- Manufacturing
- Healthcare and Life Sciences
- Retail and E-Commerce
- Transportation and Logistics
- Energy and Utilities
- Government and Public Sector
- Other End-User Industries
- By Geography
- North America
- United States
- Canada
- Mexico
- South America
- Brazil
- Argentina
- Rest of South America
- Europe
- Germany
- United Kingdom
- France
- Italy
- Spain
- Russia
- Rest of Europe
- Asia Pacific
- China
- Japan
- India
- South Korea
- Australia and New Zealand
- Southeast Asia
- Rest of Asia Pacific
- Middle East
- Saudi Arabia
- United Arab Emirates
- Turkey
- Rest of Middle East
- Africa
- South Africa
- Nigeria
- Rest of Africa
- North America
Data Sources, Market Sizing, and Validation
Desk Research
Desk work starts with defining monetization in a measurable way, then tying it to observable spend and adoption signals across industries. We relied on public technology and digital economy indicators, alongside disclosure-led clues on data product revenue and marketplace activity.
Illustrative sources included government and official statistics such as the US Bureau of Economic Analysis, US Census Bureau, Eurostat, OECD digital economy publications, and communications and data protection regulators (to understand policy and enforcement direction). We also reviewed peer-reviewed journals on data governance and privacy, plus company filings, investor decks, and reputable press to understand how data products are packaged (APIs, datasets, and subscription analytics). Select paid databases were used only for company financials and patent mapping, so assumptions on product scope and commercialization maturity stayed grounded. These examples are not exhaustive, and many other sources were referenced for data collection, validation, and clarification.
Primary Interviews and Surveys
Primary work centered on checking what portion of analytics, data marketplace, and governance spending links to external revenue creation, versus work that stays internal optimization. We spoke with a mix of solution leaders, product owners, and revenue and strategy roles across Americas, EMEA, and APAC, so regional maturity differences and pricing logic could be normalized before finalizing the model.
Distribution of primary research fieldwork respondents
| Company type | Respondent position | Region |
|---|---|---|
| Top tier: 32% | CXOs: 12% | APAC: 45% |
| Mid tier: 54% | Functional/Unit leaders: 35% | EMEA: 33% |
| Smaller Players: 14% | Managers: 53% | Americas: 22% |
Market-Sizing & Forecasting
The core sizing logic uses a top-down build that reconstructs the addressable demand pool from enterprise data and analytics spending, then applies monetization conversion rates validated through interviews. Because monetization revenue is not the same as general analytics spend, the model filters out internal-only use cases and counts revenue only when data is packaged, priced, and sold (directly or through revenue-share routes).
To keep totals grounded, selective bottom-up checks were used, such as sampled price-per-API call and subscription price points, plus roll-ups from a tracked set of vendors that publicly discuss data products and marketplaces. Key inputs in the model included enterprise cloud adoption levels, maturity of data governance programs, growth in API-led distribution, adoption of data marketplaces and exchanges, and regulatory pressure that changes what data can be commercialized and how it is anonymized. Where disclosures were limited, gaps were handled using conservative ranges and then tightened through channel checks from primary respondents.
Forecasts were developed using scenario analysis, since regulation, data sharing rules, and cloud economics can shift adoption patterns quickly. Assumptions on pricing progression and conversion rates were adjusted based on expert consensus and applied consistently across regions and major end-use demand pools.
Data Validation & Update Cycle
Outputs are cross-checked against independent signals, including enterprise software spending direction, the pace of data marketplace launches, and publicly discussed data product revenue traction. When a number looks off, the drivers are reopened, the inputs are re-checked, and a second analyst review is completed before sign-off.
The model is also compared against regional adoption narratives from fieldwork, and any large variance triggers a re-contact loop with select respondents to confirm whether the issue is scope, pricing, or timing. Reports are refreshed annually, and interim updates are made when there are material events, such as major regulatory changes, shifts in cloud pricing, or notable marketplace policy updates. Before delivery, an analyst performs a final pass so the view reflects the latest available information.
Mordor Intelligence's Data Monetization Market Size Measured Against Other Published Estimates
Published market numbers for data monetization often vary because each publisher draws the boundary differently between internal analytics value and externally realized revenue. Differences also show up when one study counts only platforms and another adds services, and when the base year and currency timing are not aligned.
API subscription price points, enterprise cloud and data governance adoption signals, and interview-confirmed conversion rates are the checks that keep Mordor Intelligence tied to revenue that is actually earned from data products. As a result, some broader estimates that mix in adjacent analytics spending come out higher.
Benchmark comparison
| Source | Market Size | Gaps in Research Methodology |
|---|---|---|
| Mordor Intelligence | USD 5.67 B (2026) | |
| Industry Research House A | USD 2.90 B (2024) | Uses an earlier base year and appears to capture a narrower commercialization layer, which can undercount later-stage marketplace scaling and the services revenue that follows deployment. |
| Industry Research House B | USD 4.20 B (2025) | Focuses on data monetization services, so the platform and tool revenues can be treated unevenly, and regional weighting can shift totals when North America share assumptions are applied broadly. |
Across the three figures, the spread is largely explained by what is counted as monetization revenue and how the base year is positioned relative to rapid adoption cycles. By keeping inclusion rules explicit and tying the totals to observable pricing and adoption indicators, the estimate stays traceable to repeatable steps and practical validation checks that can be revisited each refresh cycle.


Key Questions Answered in the Report
How big is the data monetization market in 2026?
The data monetization market size is USD 5.67 billion in 2026.
What is the forecast CAGR for data monetization through 2031?
The market is projected to grow at a 17.41% CAGR from 2026 to 2031.
Which region shows the fastest growth for data monetization?
Asia Pacific leads with an expected 18.24% CAGR to 2031.
Which component of data monetization is expanding most quickly?
Services, including consulting and managed analytics, are forecast to rise at 19.02% CAGR.
What vertical will add revenue fastest?
Retail and e-commerce will climb at a 17.88% CAGR as retail media networks monetize first-party shopper data.
How do cloud-egress fees affect data monetization?
Egress charges create cost friction that favors intra-cloud transactions and shape vendor strategies around cross-cloud replication.
Page last updated on:






