
Data Integration Market Size and Share
Market Overview
| Study Period | 2020 - 2031 |
|---|---|
| Market Size (2026) | USD 14.33 Billion |
| Market Size (2031) | USD 22.17 Billion |
| Growth Rate (2026 - 2031) | 9.12 % |
| Fastest Growing Market | Asia Pacific |
| Largest Market | North America |
| Market Concentration | Medium |
Major Players *Disclaimer: Major Players sorted in no particular order Image © Mordor Intelligence. Reuse requires attribution under CC BY 4.0. | |
Data Integration Market Analysis by Mordor Intelligence
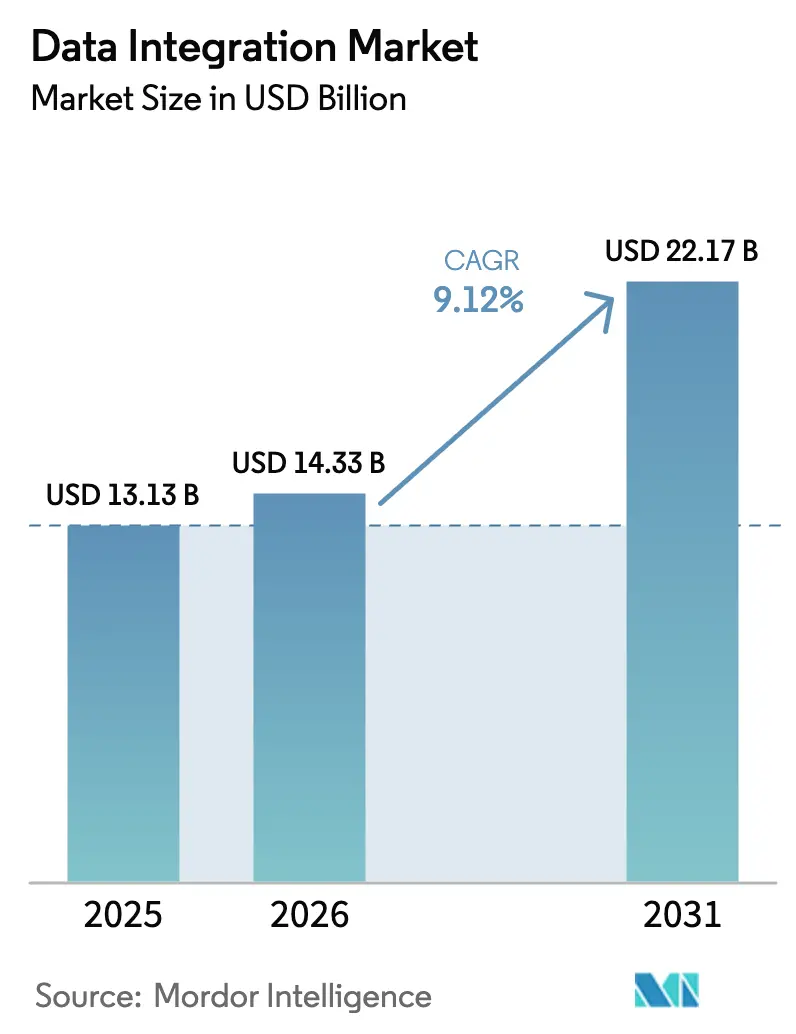
The data integration market size is expected to grow from USD 13.13 billion in 2025 to USD 14.33 billion in 2026 and is forecast to reach USD 22.17 billion by 2031 at 9.12% CAGR over 2026-2031. Momentum came from enterprises replacing batch‐oriented workflows with real-time pipelines to operationalize artificial intelligence, meet transparency rules, and unify sprawling data estates. Cloud-first modernization remained the dominant deployment pattern, yet hybrid architectures gained importance as firms balanced sovereignty rules with elastic scale. Generative-AI initiatives increased demand for governed semantic layers that cut model hallucination rates, while a steady stream of mergers bundled ingestion, transformation, activation, and governance into single platforms. At the same time, skills shortages and rising egress fees tempered adoption speed, compelling many organizations to outsource integration operations.
Key Report Takeaways
- By deployment, cloud models led with 58.74% revenue share in 2025; hybrid-cloud deployments are projected to expand at a 16.62% CAGR to 2031.
- By enterprise size, large enterprises held 55.62% of the data integration market share in 2025, whereas small enterprises are poised to grow at a 15.36% CAGR through 2031.
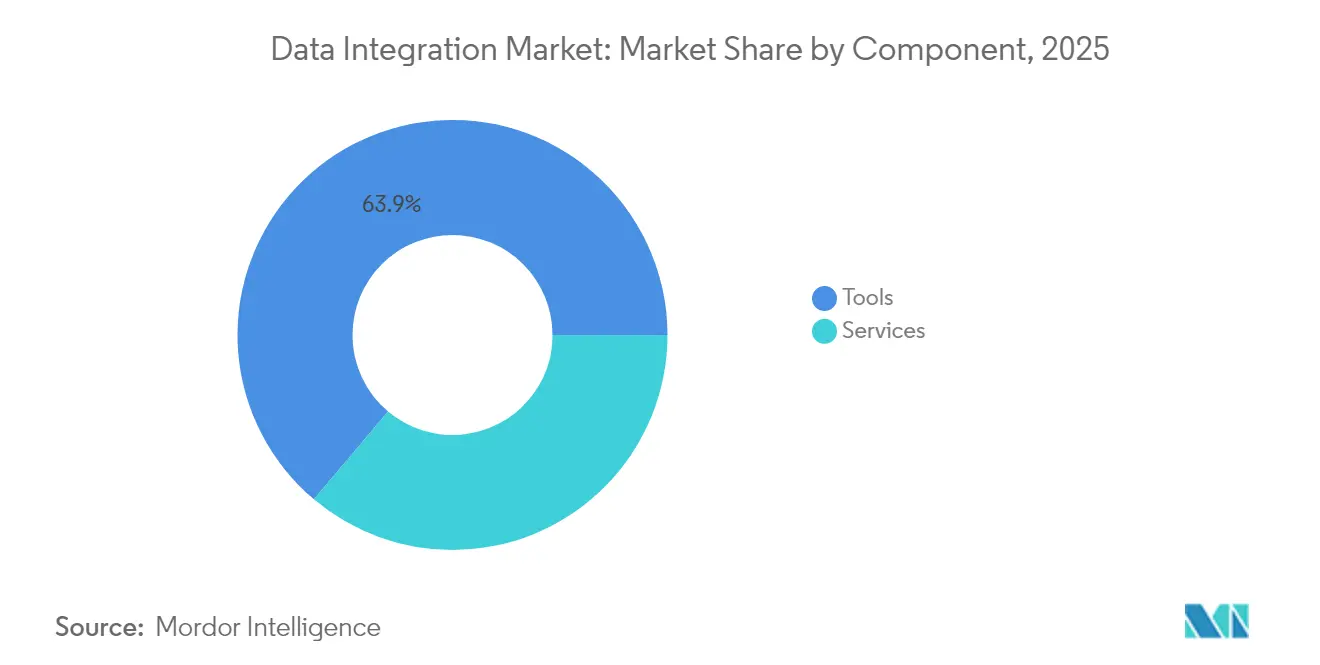
- By component, tools captured 63.85% of the data integration market size in 2025; services are on track to rise at a 14.08% CAGR between 2026-2031.
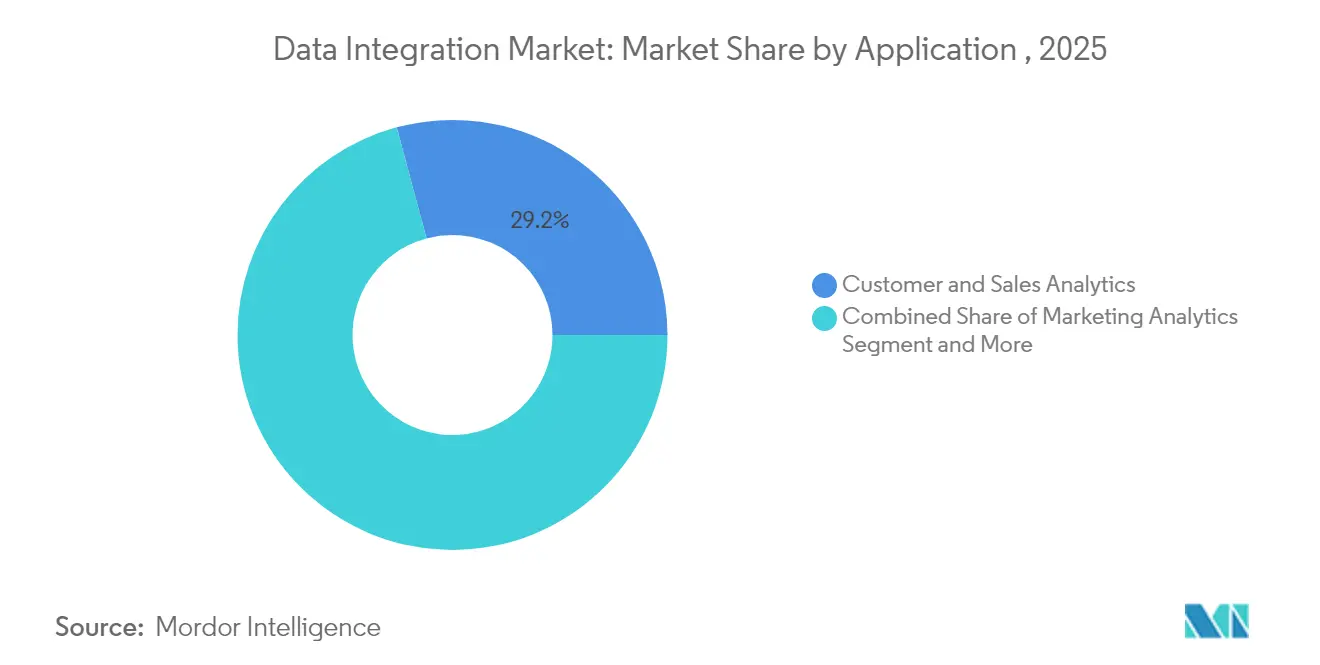
- By application, customer and sales analytics accounted for 29.18% of 2025 revenue, while operations and supply-chain optimization is the fastest-growing segment at 15.74% CAGR.
- By end-user vertical, the Banking, Financial Services, and Insurance sector commanded 24.12% revenue in 2025; healthcare and life sciences is projected to climb at a 18.91% CAGR through 2031.
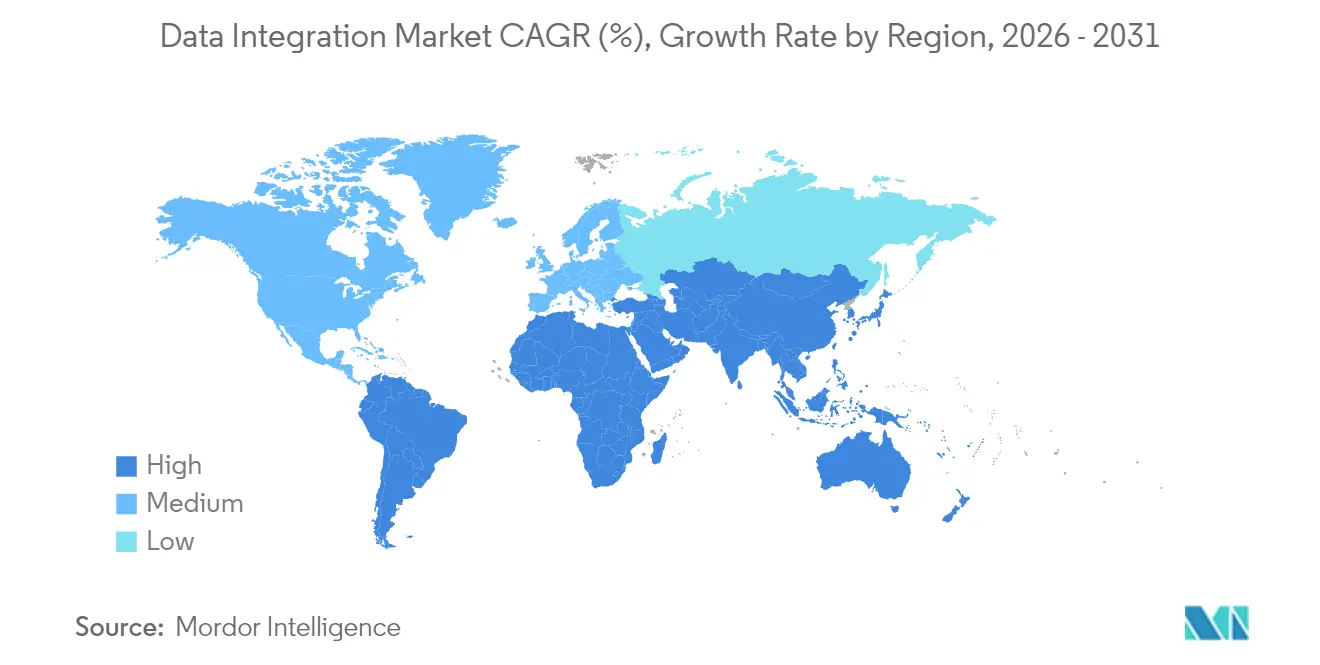
- By geography, North America accounted for 38.35% of 2025 revenue, while Asia-Pacific is the fastest-growing region at 17.78% CAGR.
Note: Market size and forecast figures in this report are generated using Mordor Intelligence’s proprietary estimation framework, updated with the latest available data and insights as of 2026.
Market Trends and Insights
Drivers Impact Analysis of Data Integration Market*
| Driver | (~) % Impact on CAGR Forecast | Geographic Relevance | Impact Timeline |
|---|---|---|---|
| Cloud-first modernisation of enterprise stacks | +2.8% | Global, led by North America and Europe | Medium term (2-4 years) |
| Shift from batch ETL to real-time streaming and CDC | +2.1% | Global, strongest in APAC manufacturing hubs | Short term (≤ 2 years) |
| Self-service, low-code data pipelines for citizen developers | +1.4% | North America and Europe, expanding to APAC | Medium term (2-4 years) |
| Regulatory push for data lineage and auditability | +1.9% | Europe and North America, spreading globally | Short term (≤ 2 years) |
| Emergence of generative-AI-ready semantic layers | +1.8% | Global tech-forward enterprises | Long term (≥ 4 years) |
| Edge and in-sensor analytics | +1.2% | APAC manufacturing, North America IoT | Long term (≥ 4 years) |
| Source: Mordor Intelligence | |||
Cloud-first modernisation of enterprise stacks
By 2025, most Fortune 100 firms had shifted integration workloads into subscription cloud services, cutting infrastructure costs and simplifying upgrades. [1] Cloud R&D investments exceeding USD 1 billion spurred zero-ETL patterns that read schemas on demand, freeing teams from rigid pre-defined transformations. Case studies such as HCLTech’s engagement with Unilever showed 30% infrastructure savings after embracing cloud-native integration. Vendors converged on lakehouse designs that unite warehouses and data lakes, with Iceberg and Delta formats enabling open file storage across platforms. Managed lake services further accelerated adoption by automating table maintenance and format conversion for more than 500 sources. [2]
Shift from batch ETL to real-time streaming and CDC
Streaming reverse ETL tools launched in 2024 synchronised data warehouse tables to operational systems within seconds, supporting live customer engagement. Financial institutions integrated CDC pipelines that cut fraud detection windows from hours to seconds. Manufacturing firms applied IoT streams to predict machine failure, reducing unplanned downtime by 40%. [3]Zero-ETL concepts emerged, moving raw data directly between stores while applying transformations at query time, slashing latency and operating cost. Cloud platforms simplified orchestration via declarative streaming services such as Dynamic Tables and Delta Live Tables.
Regulatory push for data lineage and auditability
The Digital Operational Resilience Act, effective January 2025, required roughly 22,000 EU financial entities to maintain real-time lineage and incident reporting or risk penalties up to 2% of turnover. In the United States, the 21st Century Cures Act banned information blocking and mandated Fast Healthcare Interoperability Resources APIs for patient data access. Hospitals faced reductions in Medicare incentives when failing to comply, prompting accelerated investments in governed integration layers. Vendors responded with automated data catalogs that map lineage end-to-end and embed audit trails into pipeline metadata. As overlapping rules proliferated, enterprises adopted semantic layers to centralize definitions and streamline compliance reporting.
Emergence of generative-AI-ready semantic data layers
Semantic layers evolved into AI alignment engines that anchored large-language-model outputs on governed tables, cutting hallucination rates by two-thirds. Model-driven definitions in LookML allowed deterministic KPI calculations to be reused across dashboards and chat interfaces. Progress Software embedded generative AI to auto-build ontologies and surface relationships hidden in unstructured data. Context Layer innovations processed trillions of rows while adapting queries to user intent, expanding the scope of conversational analytics. Together, these advances made semantic governance a prerequisite for scalable enterprise AI.
Restraints Impact Analysis of Data Integration Market*
| Restraint | (~) % Impact on CAGR Forecast | Geographic Relevance | Impact Timeline |
|---|---|---|---|
| Talent shortage in advanced integration architectures | −1.8% | Global, acute in North America and Europe | Short term (≤ 2 years) |
| Escalating cloud egress and data-movement costs | −1.2% | Global, highest in multi-cloud setups | Medium term (2-4 years) |
| Data-sovereignty restrictions splintering pipelines | −1.5% | APAC, Europe, emerging elsewhere | Long term (≥ 4 years) |
| Vendor lock-in risk from proprietary iPaaS | −0.9% | Global enterprises | Medium term (2-4 years) |
| Source: Mordor Intelligence | |||
Talent shortage in advanced integration architectures
In 2025, 76% of enterprises reported severe shortages in AI and data engineering talent, delaying deployments and inflating consulting spend. Security, networking, and data skills each showed gaps exceeding 35%, forcing CIOs to fund upskilling programs and managed services partnerships. Surveys projected the talent deficit could drain USD 5.5 trillion from global output by 2026. European manufacturers highlighted automation and green-tech skills as especially scarce, leading to project backlogs across mid-sized plants. These constraints slowed the rollout of real-time streaming, semantic layers, and edge pipelines despite clear ROI potential.
Data-sovereignty restrictions splintering multi-region pipelines
China’s Personal Information Protection Law compelled critical infrastructure operators to store data locally and clear cross-border transfers through security reviews, driving regionalized integration architectures. Across Asia-Pacific, privacy regulations grew 25%, with Thailand, Indonesia, and Sri Lanka issuing comprehensive statutes MorrisonFoerster. Europe’s GDPR continued to influence global policy, requiring privacy-by-design controls and tight legal bases for transfers. Enterprises responded by standing up localized processing nodes and adopting hybrid storage models to balance sovereignty with analytics scale. Multi-cloud egress fees added cost pressure as data was shuttled among compliant zones, reinforcing the need for intelligent workload placement.
*Our forecasts treat driver/restraint impacts as directional, not additive. The impact forecasts reflect baseline growth, mix effects, and variable interactions.
Data Integration Market Segment Analysis
By Component:
Services Scale Faster Than ToolsServices revenue expanded at a 14.08% CAGR through 2031 as organizations sought expert guidance on cloud migrations, streaming architectures, and compliance frameworks. The tools category still held 63.85% of the data integration market in 2025, reflecting entrenched ETL, CDC, and virtualisation platforms. Professional services surged around semantic layer rollouts and generative-AI integration, where tailored governance and ethical design were vital. Managed services gained popularity for 24/7 monitoring and automated optimisation of multi-cloud pipelines.
Within tools, ETL/ELT suites remained staple investments for batch workloads, while CDC engines gained momentum for instant analytics. Streaming platforms became critical in IoT scenarios, and data virtualisation rose alongside mesh architectures that decouple access from storage. Data quality and master data management tools found renewed relevance as AI models demanded trusted inputs. The widening skills gap further amplified demand for service providers who can orchestrate these diverse products into cohesive solutions.

By Deployment:
Hybrid-Cloud AscendsHybrid configurations recorded a 16.62% CAGR, reflecting the trade-off between sovereignty and flexibility that dominates data strategy decisions. Public cloud retained the largest overall share because hyperscalers offered elastic scale and a rich ecosystem of native services. Private clouds persisted in highly regulated environments such as finance and healthcare, where control over hardware and network configurations remained essential.
On-premise estates shrank but did not disappear, supporting legacy mainframes and latency-sensitive workloads. Edge nodes emerged as micro-integration points, processing sensor data locally before forwarding summaries to central stores. The data integration market size for hybrid-cloud deployments is forecast to expand steadily as more firms adopt mesh patterns that federate domain teams while sustaining centralized governance. Adoption accelerated as platforms introduced single control planes spanning warehouses, lakes, and edge clusters.
By Enterprise Size:
Democratization Takes HoldSmall enterprises posted a 15.36% CAGR as low-code interfaces and pay-as-you-go pricing removed historical entry barriers. Citizen developers built pipelines without deep scripting skills, enabling real-time insights previously limited to large corporates. Medium enterprises leveraged the same tools to scale analytics programs and compete on customer experience.
Large enterprises, while holding 55.62% revenue in 2025, shifted focus to optimizing complex estates rather than rapid expansion. They adopted AI-driven observability to reduce pipeline downtime and implemented strict data contracts across thousands of sources. The data integration industry saw micro-enterprises begin trials using hosted ingestion services bundled with SaaS applications, signalling future volume growth at the long tail of the market.
By Application:
Supply-Chain Optimisation SurgesOperations and supply-chain optimisation achieved the highest growth rate at 15.74% CAGR as manufacturers and retailers required end-to-end visibility. IoT sensors streamed machine metrics, enabling predictive maintenance and inventory balancing in near real time. Customer and sales analytics remained dominant at 29.18% share because personalised engagement and revenue acceleration stayed top priorities.
Marketing analytics advanced on the back of cross-channel attribution models, while finance teams integrated real-time feeds to satisfy stringent reporting deadlines. HR functions adopted people analytics to address turnover and DEI goals, and R&D groups unified datasets to shorten product cycles. The data integration market size for operations-focused workloads is expected to widen as autonomous supply chains mature, linking factory, logistics, and storefront data in continuous loops.
By End-User Vertical:
Healthcare AcceleratesHealthcare and life sciences outpaced all sectors with a 18.91% CAGR, driven by Fast Healthcare Interoperability Resources mandates that forced real-time patient record exchange. Providers integrated disparate electronic health record systems, labs, and wearable feeds to deliver coordinated care and meet information-blocking rules.
Banking, Financial Services, and Insurance retained a 24.12% share because anti-fraud, regulatory reporting, and customer personalisation demanded mature pipelines. Manufacturing advanced through Industry 4.0 programs, while retail invested in omnichannel platforms that blend online and point-of-sale data. Government, energy, and media all stepped up adoption to modernise services, monitor critical infrastructure, and personalise content, respectively.
Geography Analysis
North America Data Integration Market
North America held 38.35% of global revenue in 2025 thanks to early cloud adoption, robust venture funding, and a dense ecosystem of system integrators. Federal infrastructure programs, including a USD 65 billion grid modernisation package, drove additional demand for real-time energy data integration. Canada mirrored these patterns, investing in healthcare and financial services modernization while navigating cross-border compliance.
APAC Data Integration Market
Asia-Pacific delivered the fastest growth at an 17.78% CAGR, fuelled by hyperscale data-center rollouts and large public-sector digitalisation projects. China earmarked USD 442 billion for smart-grid upgrades that require streaming data platforms, while India allocated INR 3.03 trillion (USD 0.012 trillion) to infrastructure that embeds analytics at its core. Japan’s USD 155 billion in digital infrastructure budgets further expanded the addressable base for the data integration market. Local data-localisation laws, however, encouraged hybrid architectures that process data in-country before selective aggregation.
Europe Data Integration Market
Europe showed solid momentum despite privacy rules. The European Commission planned EUR 584 billion (USD 669.87 billion) in smart-grid investments by 2030, spurring integration projects that combine renewable generation data with consumer demand response. DORA compliance spending escalated within banking, while GDPR-aligned edge solutions let enterprises analyse data locally. Overall, the data integration market size for the region is projected to climb steadily as sovereign clouds and open standards mitigate regulatory headwinds.
Regulatory Landscape
Data integration buyers are increasingly tying platform selection to interoperability and auditability requirements across financial services and healthcare. In the EU, the Digital Operational Resilience Act (DORA) has been in effect since January 2025, reinforcing expectations for traceable data flows and incident reporting and increasing demand for governed lineage, monitoring, and resilient pipeline operations in regulated institutions.
In the United States, regulators and standards bodies added new interoperability pressure points in 2026. The U.S. Securities and Exchange Commission (SEC) established joint data standards under the Financial Data Transparency Act of 2022, with an effective date of October 1, 2026, to harmonize regulatory data across multiple financial regulators. In healthcare, ASTP/ONC published the 2026 Interoperability Standards Advisory (ISA) Reference Edition and released a Draft USCDI Version 7 in January 2026 for public feedback, reinforcing ongoing FHIR-based exchange and data standardization needs that depend on robust integration, governance, and metadata management.
Value Chain Analysis
The value chain covers (1) data producers (enterprise apps, IoT, and operational systems), (2) ingestion and connectivity (connectors, CDC/streaming, API management), (3) transformation and orchestration (ETL/ELT, workflow engines, data quality), (4) governance layers (catalog, lineage, policy, MDM, semantic layers), and (5) consumption and activation (BI, AI/ML, reverse ETL, operational apps). Hyperscalers and data-platform providers are increasingly concentrating influence across multiple stages by bundling integration capabilities into marketplaces and platform-native experiences, shifting procurement toward subscriptions and usage-based patterns while making interoperability more important to reduce lock-in.
Recent ecosystem moves point to tighter embedding of integration software into major cloud and ERP stacks. Informatica expanded its collaboration with Microsoft around Microsoft Fabric, including support for Fabric Open Mirroring and Azure-based points of delivery (including Switzerland), reinforcing local processing and governance patterns linked to sovereignty needs. IBM also broadened the integration-centered ecosystem through partnerships, including collaboration with Oracle on modernizing hybrid cloud and AI environments, and with SAP for SAP Cloud ERP Private deployments on IBM Power Virtual Server. These developments reflect a value-chain shift where consultancies and platform partners deliver end-to-end modernization programs alongside tooling.
Competitive Landscape
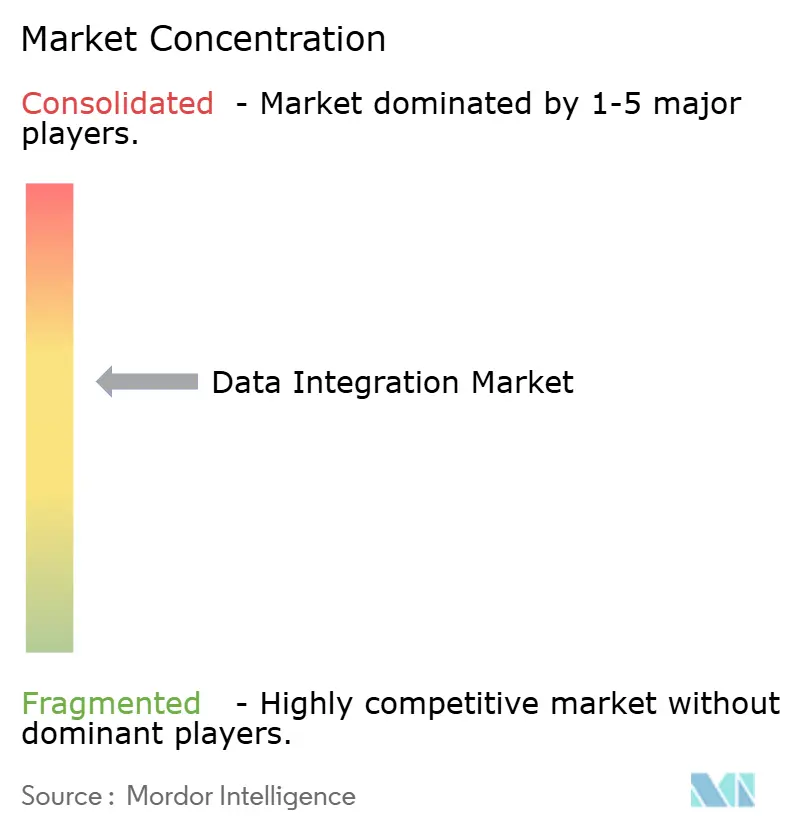
The market stayed moderately fragmented. Informatica led with a 14.1% share, leveraging its Intelligent Data Management Cloud to serve more than 80% of Fortune 100 firms. Consolidation accelerated; Fivetran bought Census to merge ingestion and activation, and Snowflake added Crunchy Data for PostgreSQL support, signalling vendor quests for end-to-end stacks.
Technology convergence blurred boundaries between warehouse, lake, and mesh solutions. Cloud data stores adopted vectorized engines and open table formats, while integration specialists embedded generative AI to automate mapping and error resolution. Niche entrants carved positions in reverse ETL, edge analytics, and semantic governance, appealing to buyers with targeted pain points.
Strategic alliances grew in importance. Teradata partnered with Fivetran on a native connector that moves data from 700-plus sources into VantageCloud for AI workloads. Vendors also courted hyperscalers’ marketplaces to simplify procurement and reach mid-market buyers. Competitive intensity remained high as pricing pressure, open-source tools, and skills shortages forced suppliers to differentiate through service quality, security certifications, and ecosystem breadth.
Data Integration Industry Leaders
-
IBM Corporation
-
Microsoft Corporation
-
Informatica Inc.
-
SAP SE
-
Oracle Corporation
- *Disclaimer: Major Players sorted in no particular order
Data Integration Market Companies Covered in this Report
- Informatica Inc.
- IBM Corporation
- Microsoft Corporation
- SAP SE
- Oracle Corporation
- SAS Institute Inc.
- Denodo Technologies
- TIBCO Software Inc.
- QlikTech International AB
- Precisely
- Talend S.A.
- Fivetran Inc.
- Boomi LP
- SnapLogic Inc.
- MuleSoft LLC (Salesforce)
- Matillion Ltd
- Amazon Web Services, Inc.
- Google LLC
- HVR Software BV
- Airbyte Inc.
- Celigo Inc.
- Tray.io Inc.
- Alteryx Inc.
- SyncMatters Ltd.
- Hitachi Vantara LLC
Market Opportunities and Future Outlook
Compliance-driven interoperability and cross-domain data standardization are tangible whitespace for integration vendors that can productize lineage, audit trails, and shared semantics for regulators and auditors. The SEC October 1, 2026 effective date for joint data standards under the Financial Data Transparency Act of 2022 creates a near-term window for regulated entities and their technology suppliers to modernize reporting pipelines and metadata controls. At the same time, ASTP/ONC updates (2026 ISA and Draft USCDI Version 7 in January 2026) keep healthcare interoperability and data normalization on active roadmaps. Together, these policy and standards signals favor platforms that can operationalize data contracts, lineage, and controlled sharing across multi-system estates.
Agentic AI and governed AI-to-data connectivity also stand out as a distinct opportunity area within data integration stacks, particularly when enterprises want AI agents to access trusted enterprise data with policy enforcement. Informatica and Microsoft expanded integration of Informatica IDMC with Microsoft Fabric (including Fabric Open Mirroring support) and positioned MCP-based access patterns for agentic AI workflows, providing current-market evidence of vendor focus in this area. In parallel, SAPs agreement to acquire Reltio ties MDM more tightly to SAP Business Data Cloud, while the build-out of local points of delivery, including Informatica's Azure-based deployment in Switzerland, highlights demand for integration capabilities that pair cloud elasticity with in-country processing and governance controls.
Recent Industry Developments in Data Integration Market
- July 2026: The launch of SnapCode and MCP Server enables AI driven enterprise integration from coding environments. The launch expands direct data and integration tooling, accelerating governed, AI assisted integration across enterprises and strengthening AI native data workflows within data fabric stacks.
- May 2026: Informatica and Microsoft deepen collaboration to deliver trusted data for agentic AI and analytics at scale via the IDMC and Microsoft Foundry integration. The partnership enhances data governance and accessibility for enterprise AI, reinforcing Informatica's positioned data layer in multicloud environments.
- March 2026: SAP agreed to acquire Reltio to integrate MDM capabilities into SAP Business Data Cloud for agentic AI. The capacity addition strengthens SAP's data fabric with integrated MDM for AI driven transformations across the SAP ecosystem.
Data Integration Market Report Scope and Research Methodology
Market Definition and Coverage
This market is defined as the revenue generated from software and services that connect, move, transform, and synchronize data across different systems so it can be used reliably for reporting, analytics, and operations.
Scope exclusions: We exclude general IT outsourcing that is not tied to an integration workload, plus pure database storage, compute, and networking services sold without integration capability.
Segments Covered in This Report
- By Component
- Tools
- ETL and ELT Platforms
- Data Replication and CDC
- Data Virtualisation
- Streaming Integration
- Data Quality and MDM Tools
- Services
- Professional Services
- Managed Services
- Tools
- By Deployment
- Cloud
- Public Cloud
- Private Cloud
- Hybrid Cloud
- On-Premise
- Cloud
- By Enterprise Size
- Micro Enterprises (1-49)
- Small Enterprises (50-249)
- Medium Enterprises (250-999)
- Large Enterprises (1,000+)
- By Application
- Customer and Sales Analytics
- Operations and Supply-chain Optimisation
- Marketing Analytics
- Finance and Risk Management
- Human Resources Analytics
- Product and RandD Data Integration
- Others
- By End-user Vertical
- IT and Telecom
- BFSI
- Healthcare and Life Sciences
- Manufacturing
- Retail and E-commerce
- Government and Defense
- Energy and Utilities
- Media and Entertainment
- Others
- By Geography
- North America
- United States
- Canada
- Mexico
- South America
- Brazil
- Argentina
- Rest of South America
- Europe
- Germany
- United Kingdom
- France
- Italy
- Spain
- Nordics
- Benelux
- Russia
- Rest of Europe
- Asia-Pacific
- China
- India
- Japan
- South Korea
- ASEAN
- Rest of Asia-Pacific
- Middle East and Africa
- Middle East
- GCC
- Turkey
- Rest of Middle East
- Africa
- South Africa
- Nigeria
- Egypt
- Rest of Africa
- Middle East
- North America
Data Sources, Market Sizing, and Validation
Desk Research
Desk research was used to set the market perimeter, understand demand drivers, and anchor assumptions that can be checked using public data. We rely on reputable public sources such as the US Bureau of Labor Statistics for IT labor trends, US Census Bureau and Eurostat for enterprise activity indicators, NIST and similar standards bodies for data management and interoperability guidance, and regulator publications that influence governance and data movement.
We also review company filings and investor decks, product documentation, association websites, and credible press coverage to map how buyers describe integration work (cloud migration, application modernization, and analytics enablement). For model hygiene, paid database subscriptions are used selectively for company financials and intelligence, news and financials screening, patent databases, and shipment-level import and export signals where hardware appliances appear in disclosed bills of materials. These examples are not exhaustive, and many other sources are referenced for data collection, validation, and clarification.
Primary Interviews and Surveys
Primary work is used to pressure-test the desk view and convert general demand signals into measurable sizing inputs. We speak with solution owners, implementation partners, and enterprise users across key regions to align assumptions on adoption pace, typical contract sizes, and deployment mix to what is actually being purchased. When gaps show up, follow-up conversations are used to confirm whether the issue is scope, pricing, or timing, and then the model is adjusted before final sign-off.
Distribution of primary research fieldwork respondents
| Company type | Respondent position | Region |
|---|---|---|
| Top tier: 35% | CXOs: 15% | APAC: 47% |
| Mid tier: 46% | Functional/Unit leaders: 27% | EMEA: 34% |
| Smaller Players: 19% | Managers: 58% | Americas: 19% |
Market-Sizing & Forecasting
Sizing starts from a top-down build where IT spending and cloud adoption indicators are translated into an addressable pool for integration work, which is then narrowed using adoption rates by industry and enterprise size. To keep the totals realistic, the result is cross-checked using selective bottom-up approximations such as sampled vendor revenue signals, channel checks on typical deal bands, and a volume times ASP logic for common subscription packages.
A few practical inputs that shape the model include the pace of cloud and hybrid deployments, the share of integration delivered as tools versus services, the rate of new application rollouts that create connector demand, and the intensity of governance requirements that increase project scope. For forecasting, we use scenario analysis supported by expert consensus on variables like cloud migration timing, data estate complexity, and the shift from batch to near real-time pipelines. Where bottom-up signals are incomplete, we handle gaps by using conservative ranges and then rechecking them against regional enterprise counts and reported software revenue trends.
Data Validation & Update Cycle
Model outputs are triangulated against independent signals, then reviewed for anomalies such as sudden mix shifts, unrealistic regional shares, or pricing jumps that do not match what buyers report. If a variance is found, the underlying driver is isolated, rechecked with interview notes, and validated using another desk source before the number is kept.
A multi-step internal review is completed before publishing so assumptions, units, and currency conversions remain consistent across the time series. Reports are refreshed annually, and interim updates are made when material events change demand patterns or pricing. Before delivery, the analyst runs a fresh pass so clients receive the latest updated view.
Mordor Intelligence's Data Integration Market Sizing Compared With Other Published Estimates
Published market sizes for data integration often differ because teams do not treat tools, services, and adjacent categories in the same way, and they also pick different base years and currency timing. We see the biggest differences when one estimate leans on vendor revenue labeling, and another estimate reconstructs demand from enterprise adoption signals.
Some published figures expand scope into data quality, governance, or broader platform revenue, and they can also push faster growth by assuming uniform cloud migration across industries. In Mordor Intelligence's sizing, revenue is counted only when it is tied directly to integration tooling and integration services, and adjacent data management suites are excluded unless they are priced and sold as part of an integration workload.
Benchmark comparison
| Source | Market Size | Gaps in Research Methodology |
|---|---|---|
| Mordor Intelligence | USD 14.33 B (2026) | |
| Industry Publisher A | USD 14.32 B (2024) | Uses an earlier base year and a broader definition that explicitly includes platforms plus a wide set of services, which can pull in spending that is not integration-specific. |
| Industry Publisher B | USD 14.29 B (2024) | Reports a different timeline and mixes multiple service labels (including professional and managed services), which can shift totals depending on how implementation work is attributed. |
The table shows that even close-looking values can come from different years and different included revenue lines. By keeping the scope tied to integration-specific spending and by validating adoption, mix, and pricing through repeated checks, the final number stays traceable to clear inputs that can be revisited and updated.
Key Questions Answered in the Report
What was the global data integration market size in 2026?
The market reached USD 14.33 billion in 2026.
Which deployment model is growing fastest?
Hybrid-cloud deployments are forecast to rise at a 16.62% CAGR between 2026-2031.
Which application area will see the strongest growth through 2031?
Operations and supply-chain optimisation is expected to lead with a 15.74% CAGR.
Why is healthcare adopting data integration so rapidly?
The 21st Century Cures Act mandates real-time interoperability, pushing healthcare and life sciences toward a 18.91% CAGR.
How are regulations like DORA influencing purchasing decisions?
Financial firms face real-time lineage and incident-reporting requirements under DORA, accelerating investment in governed integration platforms.
What is driving consolidation among integration vendors?
Providers are acquiring complementary capabilities such as reverse ETL and database support to deliver end-to-end data movement ecosystems and stay competitive.