
Data Discovery Market Size and Share
Market Overview
| Study Period | 2020 - 2031 |
|---|---|
| Market Size (2026) | USD 18.82 Billion |
| Market Size (2031) | USD 41.07 Billion |
| Growth Rate (2026 - 2031) | 16.92 % |
| Fastest Growing Market | Asia-Pacific |
| Largest Market | North America |
| Market Concentration | Medium |
Major Players *Disclaimer: Major Players sorted in no particular order Image © Mordor Intelligence. Reuse requires attribution under CC BY 4.0. | |
Data Discovery Market Analysis by Mordor Intelligence
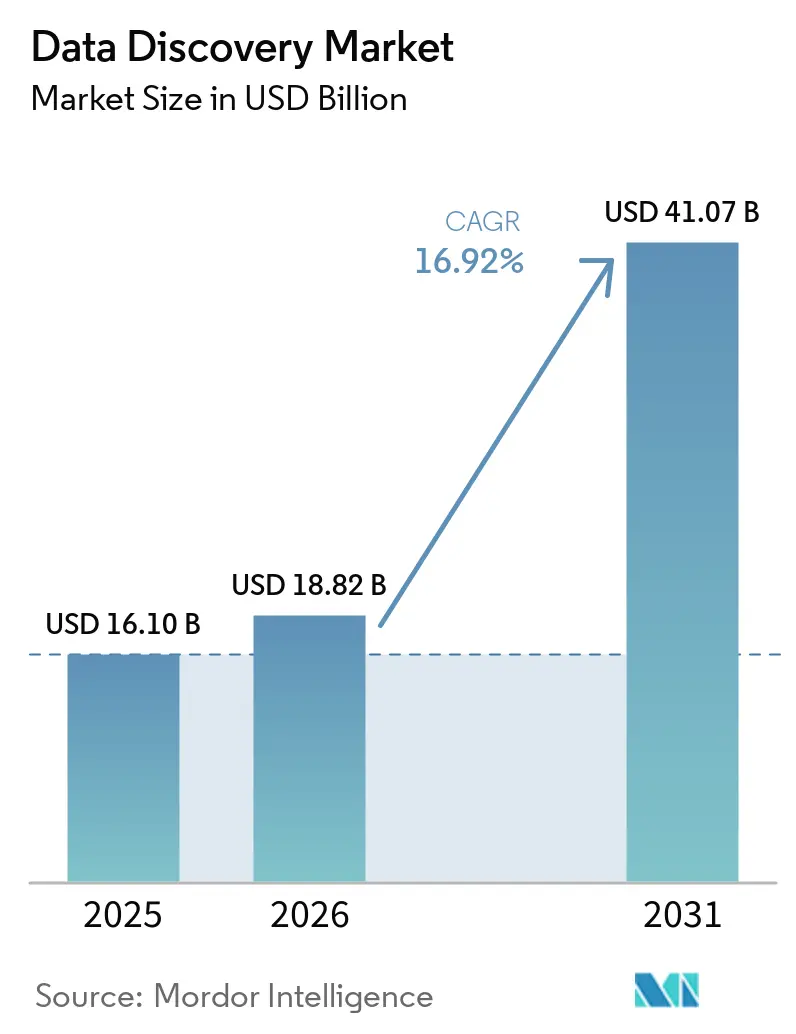
The data discovery market size is expected to grow from USD 16.1 billion in 2025 to USD 18.82 billion in 2026 and is forecast to reach USD 41.07 billion by 2031 at 16.92% CAGR over 2026-2031. This growth cements the data discovery market as one of the fastest-rising segments of enterprise analytics, fueled by mounting requirements to turn multi-structured data into timely business decisions. Heightened cloud adoption, rapid advances in generative AI, and widening executive mandates for data-driven cultures are accelerating platform demand. At the same time, customers are pivoting from traditional business-intelligence stacks toward intuitive self-service tools that democratize insight generation across departments, boosting platform stickiness and recurring revenue streams. Competitive strategies are increasingly shaped by region-specific regulations—especially sovereign-cloud mandates in APAC and data-governance rules in Europe—that determine deployment choices and vendor partnerships.
Key Report Takeaways
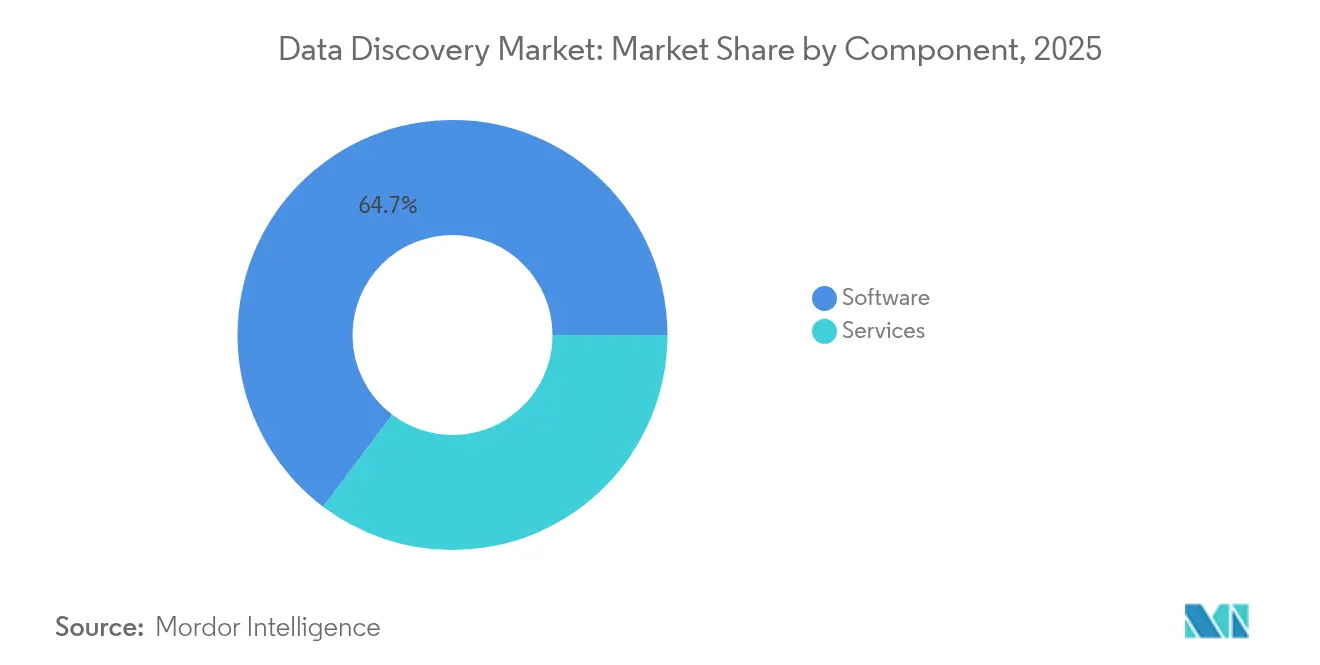
- By component, software solutions retained 64.72% of data discovery market share in 2025, while services are expanding at a 23.12% CAGR through 2031.
- By deployment model, on-premise installations held 54.30% of the data discovery market size in 2025; cloud deployments are set to post a 24.62% CAGR to 2031.
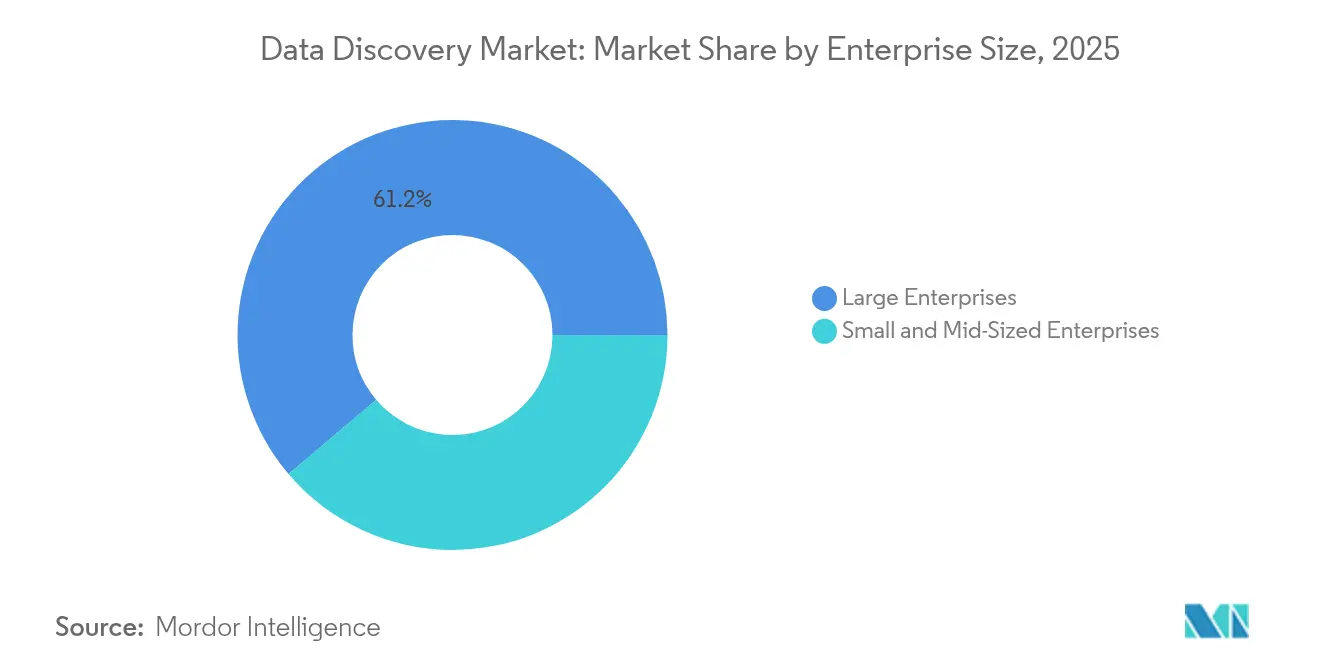
- By enterprise size, large enterprises captured 61.20% of the data discovery market size in 2025; small and mid-sized enterprises will rise at a 24.14% CAGR.
- By vertical, BFSI led with 23.78% of data discovery market share in 2025, whereas healthcare and life sciences is forecast to grow at a 18.92% CAGR.
- By application, risk and compliance management accounted for 27.95% of the data discovery market size in 2025, while customer-experience and personalization applications are projected to advance at a 20.12% CAGR.
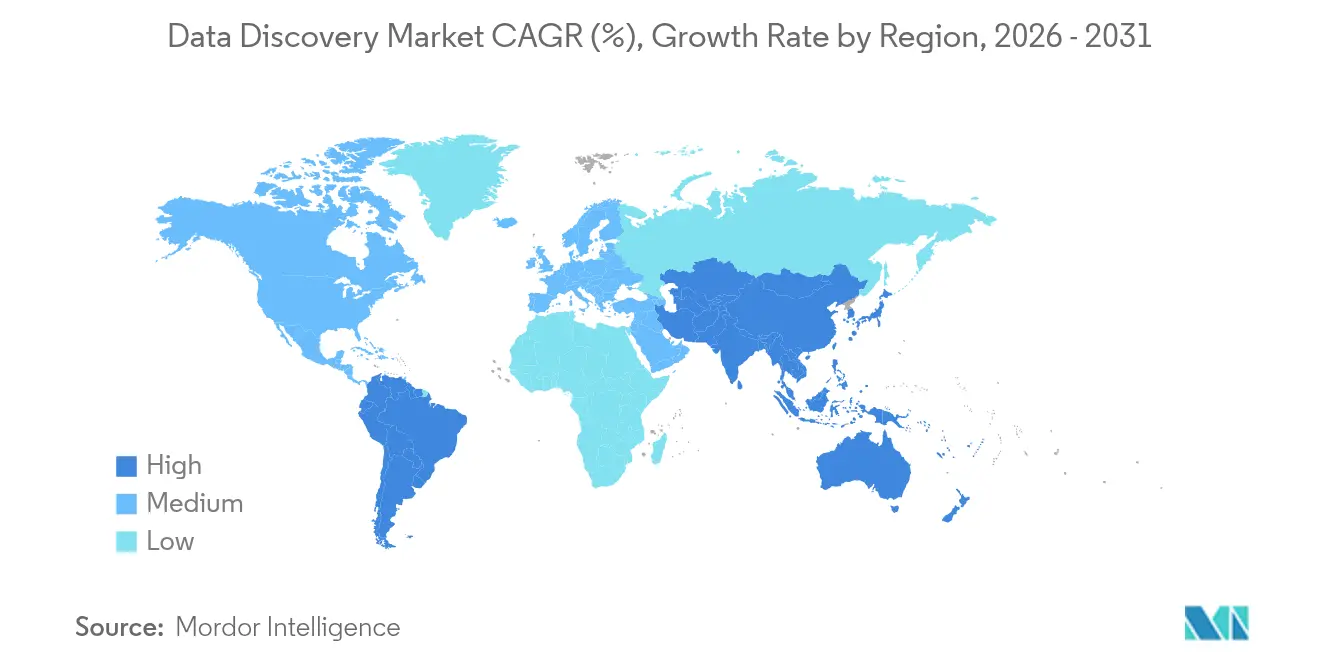
- By geography, North America commanded 39.60% of the data discovery market in 2025; APAC is poised for the fastest expansion at an 18.27% CAGR.
Note: Market size and forecast figures in this report are generated using Mordor Intelligence’s proprietary estimation framework, updated with the latest available data and insights as of 2026.
Market Trends and Insights
Drivers Impact Analysis of Data Discovery Market*
| Driver | (~) % Impact on CAGR Forecast | Geographic Relevance | Impact Timeline |
|---|---|---|---|
| Proliferation of multi-structured data | +4.2% | Global | Medium term (2-4 years) |
| Push for data-driven decision-making | +3.8% | North America, EU core, APAC expansion | Short term (≤2 years) |
| Rapid uptake of self-service analytics | +3.5% | Global, SME concentration | Medium term (2-4 years) |
| Governance and compliance mandates | +2.9% | EU, North America, emerging APAC | Long term (≥4 years) |
| Generative-AI copilots in workflows | +2.7% | North America, EU, developed APAC | Short term (≤2 years) |
| Falling columnar cloud-warehouse costs | +1.9% | Global cloud-first markets | Medium term (2-4 years) |
| Source: Mordor Intelligence | |||
Proliferation of Multi-Structured Data Sources
Enterprises now ingest streams from IoT sensors, social feeds, documents, and edge devices, forcing platforms to unify diverse formats without preprocessing. Vendors embed natural-language processing to auto-catalog assets, reducing the time analysts spend curating data.[1] Edge rollouts amplify this need, and shortages in semiconductors have made cloud elasticity more attractive for scaling discovery workloads. Organizations are concluding that legacy warehouses alone cannot accommodate today’s data velocity, thereby accelerating migrations to cloud-native discovery solutions.
Enterprise Push for Data-Driven Decision-Making
Executive mandates have reframed discovery platforms as strategic assets. HP’s rollout of a conversational BI layer on Databricks enables supply-chain teams to surface anomalies through simple queries instead of heavy engineering efforts.[2] Transparent lineage functions also satisfy auditors, especially in financial services, and successful deployments pair technology rollouts with cultural shifts that place data insights at the heart of day-to-day decisions.
Rapid Uptake of Self-Service Analytics Platforms
Organizations with mature self-service programs report 42% efficiency gains and a 64% rise in data accessibilitys.[3] Microsoft’s managed self-service architecture shows how shared semantic models preserve governance while empowering business users. SMEs, previously constrained by IT budgets, now embrace cloud-native delivery that supports unpredictable usage bursts without upfront infrastructure.
Governance and Compliance Mandates
Europe’s Data Act obliges firms to catalog and share data assets on demand, making integrated governance a procurement prerequisite.[4] The European Central Bank’s focus on risk-data aggregation likewise pushes banks toward platforms with robust audit trails. In the United States, the OCC’s 2025 plan reinforces data-classification requirements across third-party ecosystems, while several APAC governments require sovereign storage that further localises deployments.
Restraints Impact Analysis of Data Discovery Market*
| Restraint | (~) % Impact on CAGR Forecast | Geographic Relevance | Impact Timeline |
|---|---|---|---|
| Escalating data security and privacy risks | –2.8% | Global, with stronger pressure in EU and highly regulated sectors | Long term (≥4 years) |
| Limited availability of data-engineering and stewardship talent | –2.1% | North America, EU, developed APAC | Medium term (2-4 years) |
| Complex integration with legacy systems | –1.7% | Global, most acute among large enterprises | Medium term (2-4 years) |
| Strict sovereign-cloud data-localization mandates | –1.4% | APAC core, expanding into EU and other emerging markets | Long term (≥4 years) |
| Source: Mordor Intelligence | |||
Data Security and Privacy Concerns
Nearly half of global cyberattacks in 2024 involved data or credential theft, with APAC bearing one-third of incidents. Manufacturers are prime ransomware targets, and broader data access raises regulator scrutiny. Privacy-enhancing technologies exist, yet adoption is hampered by performance trade-offs and cost. Enterprises now demand granular access controls and immutable audit logs that lengthen implementation cycles and inflate budgets.
Shortage of Data-Engineering and Stewardship Talent
Global demand for data specialists eclipses supply, prolonging deployment timelines and elevating service-partner costs. Firms juggling tariff-driven supply-chain disruption alongside platform modernisation cite talent scarcity as a top hurdle. Competition for skilled personnel inflates salaries, pushing some enterprises toward managed-services models to bridge capability gaps.
*Our forecasts treat driver/restraint impacts as directional, not additive. The impact forecasts reflect baseline growth, mix effects, and variable interactions.
Data Discovery Market Segment Analysis
By Component:
Services Drive Implementation SuccessSoftware still dominated the data discovery market size with a 64.72% revenue share in 2025. However, services are growing fastest at a 23.12% CAGR as businesses realise successful rollouts require integration, governance, and change-management expertise. Consulting engagements tackle architecture modernisation, while managed services appeal to SMEs lacking internal resources. Over the forecast horizon, services are expected to capture a larger slice of incremental spending as platform complexity rises and talent bottlenecks persist. The shift underscores the transition from tool-centric purchases to outcome-oriented contracts that bundle software with measurable business impact.
Software vendors continue to refine subscription models and embed low-code configuration to curb heavy customisation. Yet enterprise clients frequently augment licences with specialised partners for data onboarding, taxonomy design, and lineage validation. This hybrid buying behaviour aligns with broader market maturation trends in which value is measured by decision-speed improvements rather than feature lists.

By Deployment Mode:
Cloud Economics Override Security ConcernsOn-premise installations retained 54.30% of the data discovery market share in 2025, owing chiefly to banking and public-sector data-localisation mandates. Cloud deployments, however, are projected to climb at a 24.62% CAGR as cost-optimised warehouses and sovereign-cloud frameworks alleviate risk perceptions. Firms now mix local storage for sensitive records with cloud compute for analytical bursts, creating demand for unified control planes that mask underlying complexity.
Fujitsu’s sovereign-cloud launch powered by Oracle Alloy typifies regional responses to localisation rules while still delivering elastic cloud scale. As more regulators publish cloud-security benchmarks, cross-industry confidence grows, and enterprises shift capex toward opex-based consumption models that reduce upgrade cycles.
By Enterprise Size:
SME Democratization Accelerates Market ExpansionLarge enterprises commanded 61.20% of 2025 revenue, but SME adoption is surging at 24.14% CAGR thanks to pay-as-you-go models and intuitive self-service interfaces. Smaller firms, once excluded by infrastructure costs, now consume curated data products through browser-based portals, shrinking time-to-insight. Vendor roadmaps increasingly feature out-of-the-box connectors and auto-governance templates to quick-start SME deployments.
Meanwhile, large organisations remain critical to vendor roadmaps because their complex multi-cloud footprints showcase advanced lineage and security features. Yet even these buyers expect consumer-grade experiences for business users, reinforcing a universal usability bar across customer tiers.
By Industry Vertical:
Healthcare Innovation Outpaces Financial MaturityBFSI led 2025 spending with 23.78% data discovery market share, driven by stringent reporting and audit obligations. Healthcare and life sciences, however, is forecast for the fastest 18.92% CAGR through 2031 as precision-medicine research, clinical-trial analytics, and real-world evidence programs multiply data volume and complexity. Telecommunications, retail, and manufacturing maintain steady investment to optimise customer engagement and shop-floor efficiency, while utilities report expanding interest in predictive maintenance amid decarbonisation drives.
Vertical solutions that pre-package domain ontologies and compliance artefacts are gaining traction, shortening deployment cycles and differentiating vendors in crowded bidding contests.
By Application:
Customer-Experience Transformation Drives GrowthRisk and compliance management held the largest 27.95% slice of 2025 revenues within the data discovery market size, reflecting a regulatory baseline every institution must meet. Looking ahead, customer-experience and personalisation workloads are set for a 20.12% CAGR as firms seek granular insight into omni-channel behaviour. Unifying marketing, support, and product telemetry enables micro-segmentation and real-time offers that lift lifetime value.
Sales and marketing optimisation likewise benefits from consolidated profiles, while operations and supply-chain analytics help organisations mitigate disruptions and improve resilience. Asset-performance management is seeing early adoption in energy and industrial domains where uptime is mission-critical.
Geography Analysis
North America Data Discovery Market
North America retained 39.60% of 2025 revenue, supported by mature governance frameworks, deep cloud penetration, and robust partner ecosystems. Financial-services regulations continue to drive discovery platform renewals, and the U.S. intelligence community’s 2023-2025 data strategy underlines federal commitment to interoperable architectures. Technology-sector RandD labs further expand platform footprints to power AI product development.
APAC Data Discovery Market
APAC is forecast to be the fastest-growing region with an 18.27% CAGR. National digital-government programs and sovereign-AI roadmaps accelerate demand for localised yet scalable discovery environments. Japan exemplifies this trajectory through public-sector shifts to Oracle Cloud Infrastructure, while rising data-centre capacity investments across Southeast Asia lay physical foundations for broader adoption.
EMEA and South America Data Discovery Market
Europe posts steady gains, underpinned by GDPR and the Data Act’s stringent data-sharing and lineage obligations. Banks must align with the European Central Bank’s risk-data guidance, stimulating fresh platform upgrades. Elsewhere, South America and the Middle East and Africa are moving from pilot phases toward enterprise-wide deployments, though infrastructure gaps and talent shortages temper near-term expansion.
Regulatory Landscape
The regulatory environment for data discovery is tightening around auditability, data governance, and controls for AI-assisted analytics. In the European Union, Regulation (EU) 2024/1689 (AI Act) sets explicit data governance obligations for high-risk AI systems under Article 10, including requirements around data collection, preparation, documentation, and bias detection and mitigation. The Act enters full application on August 2, 2026, which increases compliance scrutiny for discovery capabilities that feed AI workflows, particularly on lineage, metadata completeness, and reproducibility of analytical outputs.
In the United States, federal and financial-sector measures are adding more specific compliance triggers that shape platform design and deployment. In June 2026, the U.S. General Services Administration issued a GSAR clause (552.239-7001) establishing data safeguarding requirements for Large Language Model systems processing government data. This reinforces the need for discovery tools with enforceable access controls and auditable handling of sensitive datasets. Separately, U.S. financial regulators published a final joint rule in June 2026, effective October 1, 2026, establishing data standards for interoperability of financial regulatory data. This raises demand for interoperability-ready catalogs, standardized metadata, and traceable data transformations across regulated reporting pipelines.
Competitive Landscape
The data discovery market is moderately fragmented. Global cloud providers leverage existing IaaS footprints to upsell discovery modules, while best-of-breed vendors differentiate in cataloguing, lineage, or vertical compliance depth. Strategic alliances—such as recent joint database services between leading hyperscalers and database specialists—showcase demand for cross-cloud interoperability maintained under single-pane governance.
Patent trends highlight intensified RandD around natural-language interfaces and automated metadata generation, signalling a race to lower the skill barrier for complex exploration tasks. Vendors bundling advisory services alongside software are gaining traction, particularly where customers grapple with privacy, sovereignty, and talent constraints. Niche players able to certify workloads against regional sovereignty codes are carving defensible beachheads in government and regulated verticals.
Pricing innovation is evident as subscription tiers blend storage, compute, and governance meters to align expenditure with realised business benefits. Overall, competitive intensity remains high, but no single provider dominates mindshare across all regions and verticals.
Data Discovery Industry Leaders
-
Tableau Software, LLC
-
Datameer, Inc.
-
SAP SE.
-
Tibco Software Inc.
-
Cloudera, Inc.
- *Disclaimer: Major Players sorted in no particular order

Data Discovery Market Companies Covered in this Report
- Microsoft Corp.
- Tableau Software LLC (Salesforce)
- SAP SE
- QlikTech International AB
- IBM Corp.
- Oracle Corp.
- Amazon Web Services Inc.
- Google LLC (Looker)
- Altair Engineering Inc.
- SAS Institute Inc.
- MicroStrategy Inc.
- Alteryx Inc.
- Datameer Inc.
- Cloudera Inc.
- Talend SA
- Informatica Inc.
- Collibra NV
- Alation Inc.
- Snowflake Inc.
- Tibco Software Inc.
Market Opportunities and Future Outlook
Agentic and conversational analytics are shifting data discovery from a catalog-and-search function toward an active context layer that can govern how AI agents find, interpret, and act on enterprise data. Vendor roadmaps already reflect this direction. In July 2026, Google Cloud made Conversational Analytics in BigQuery generally available using Gemini models for natural-language interaction, and AWS reached general availability for Amazon Bedrock Managed Knowledge Base with built-in document access control for agentic retrieval. This productization creates whitespace for discovery platforms that can standardize metric definitions, expose trusted semantic layers, and enforce policy-aware access in workflows where business users (and agents) query data without hand-built dashboards.
A second opportunity is unifying distributed data estates, particularly where sovereign and regulated deployments require hybrid architectures. In July 2026, Denodo announced Denodo Platform 9.5 with semantic elements (metric views) in a knowledge graph to provide context for agentic AI, highlighting pull for active metadata and cross-source context rather than passive documentation. With on-premise still accounting for 54.30% of the data discovery market share in 2025, vendors and service partners have room to differentiate through governance-by-design implementations, packaged compliance templates (risk and compliance management was 27.95% of 2025 application revenue), and connectors that keep hybrid discovery consistent across cloud, sovereign cloud, and legacy environments without weakening audit trails.
Recent Industry Developments in Data Discovery Market
- July 2026: Tableau (Salesforce) expanded Tableau Agent capabilities with new conversational analytics enhancements and AI integrations including Claude, ChatGPT, and Codex. The updates strengthen natural-language driven analysis and accelerate self-service discovery for business users. Broader model connectivity also increases competitive pressure on vendors to support multi-model governance, lineage, and consistent semantic definitions.
- May 2025: Salesforce introduced Tableau Next, positioning it as an AI agent driven approach to business intelligence that connects insights to actions inside enterprise workflows. The launch reinforced the market shift from dashboard-centric BI toward agent-assisted exploration and decision automation. It also increased the importance of governed semantic layers and trusted data products to prevent inconsistent metrics at scale.
- June 2024: The European Union adopted Regulation (EU) 2024/1689 (AI Act), establishing a risk-based framework for AI systems, including strict data governance requirements for high-risk use cases. The legislation increased demand for discovery capabilities that can document data sources, preparation steps, and bias controls. This regulatory direction elevated procurement emphasis on metadata management, lineage, and audit-ready reporting across AI-enabled analytics stacks.
Data Discovery Market Report Scope and Research Methodology
Market Definition and Coverage
This market covers revenue earned from data discovery software and related services that help organizations find, profile, classify, and understand data across on-premises, cloud, and hybrid environments.
Scope exclusions: We exclude pure-play ETL tools, data warehousing hardware, and standalone visualization packages that are not positioned as data discovery.
Segments Covered in This Report
- By Component
- Software
- Services
- By Deployment Mode
- On-Premise
- Cloud
- Hybrid
- By Enterprise Size
- Small and Mid-Sized Enterprises
- Large Enterprises
- By Industry Vertical
- Banking, Financial Services and Insurance (BFSI)
- Telecommunications and IT
- Retail and E-Commerce
- Manufacturing
- Energy and Utilities
- Healthcare and Life Sciences
- Government and Public Sector
- Other Verticals
- By Application
- Risk and Compliance Management
- Sales and Marketing Optimization
- Customer Experience and Personalization
- Operations and Supply-Chain Analytics
- Asset and Performance Management
- Other Applications
- By Geography
- North America
- United States
- Canada
- Mexico
- South America
- Brazil
- Argentina
- Rest of South America
- Europe
- United Kingdom
- Germany
- France
- Spain
- Italy
- Rest of Europe
- Asia-Pacific
- China
- Japan
- India
- South Korea
- Australia and New Zealand
- Rest of Asia-Pacific
- Middle East
- Israel
- Saudi Arabia
- United Arab Emirates
- Turkey
- Rest of Middle East
- Africa
- South Africa
- Egypt
- Nigeria
- Rest of Africa
- North America
Data Sources, Market Sizing, and Validation
Desk Research
Desk research starts with public signals that can be checked and rechecked, before assumptions are added. We use sources such as US Census Bureau and Bureau of Economic Analysis series for enterprise IT spend direction, US SEC filings and annual reports to understand revenue mix language, and peer-reviewed journals for adoption patterns and data management practices.
To keep the model grounded by geography and regulation, we also refer to sources such as NIST publications, OECD digital economy statistics, and European Commission materials related to data governance and cross-border data rules. Patent databases are used to track how quickly discovery-related capabilities are evolving and which functions are being productized. We also review investor presentations and reputable technology press to time major capability shifts and deployment trends. These examples are not exhaustive, and many other sources were reviewed for data collection, validation, and clarification.
Primary Interviews and Surveys
Primary work is used to test what the desk findings do not fully explain, especially around what buyers count as data discovery versus adjacent analytics tooling. We speak with a mix of platform providers, service partners, system integrators, and enterprise users, and we cover demand signals across APAC, EMEA, and the Americas so regional rollout realities are reflected.
Input from interviews helps confirm deployment mix shifts, typical bundling with governance features, and how pricing changes with data volume, user seats, and workload scale, which are then carried into the final model.
Distribution of primary research fieldwork respondents
| Company type | Respondent position | Region |
|---|---|---|
| Top tier: 30% | CXOs: 19% | APAC: 45% |
| Mid tier: 49% | Functional/Unit leaders: 27% | EMEA: 29% |
| Smaller Players: 21% | Managers: 54% | Americas: 26% |
Market-Sizing & Forecasting
For sizing, we use a top-down and bottom-up approach. The starting point is a demand pool built from enterprise software spending patterns, then mapped to discovery-specific use cases. To keep that from becoming too abstract, totals are cross-checked with selective bottom-up approximations such as sampled vendor revenue cues, channel partner checks, and an ASP times adoption-volume build using typical seat bands.
Key inputs that steer the model include cloud versus on-premises deployment mix, adoption of self-service discovery workflows, growth in governed data initiatives, the pace of unstructured data growth, and average pricing logic tied to user seats and data connectors. Where bottom-up signals are thin, we fill gaps using proxy ratios from similar buyer cohorts, then adjust them after primary feedback confirms whether the ratios feel realistic.
Forecasts are built using scenario analysis supported by a light multivariate regression. Drivers like cloud migration pace, regulatory push for data governance, and enterprise analytics adoption are varied within realistic ranges. The final trajectory is accepted only after the output aligns with primary expectations on budget cycles and renewal timing.
Data Validation & Update Cycle
Validation is done through a set of checks that make the number explainable from more than one angle. We compare outputs against independent signals such as enterprise software spend direction, cloud workload expansion, and disclosed segment narratives, then investigate any sharp jumps that do not match adoption realities.
Before sign-off, the model is reviewed in multiple steps. Outliers are discussed and corrected with clear notes on what changed and why. Reports are refreshed annually, and interim updates are triggered when material events occur, such as major pricing model shifts or changes in data governance rules. Right before delivery, an analyst performs a fresh pass so clients receive the latest updated view.
Mordor Intelligence's Data Discovery Market Size Compared Against Other Published Estimates
Published numbers for data discovery can look far apart because the market label is used loosely, and because adjacent tools are sometimes pulled into the total. Differences also show up when one source reports a software-only view while another adds services, or when the base year and currency timing are not aligned.
The main gap comes from whether standalone BI and generic visualization revenue is counted as data discovery, and in Mordor Intelligence the total is kept to discovery platforms plus related services that explicitly support finding, profiling, and cataloging data across environments. Another driver is how pricing is modeled over time. Some estimates assume aggressive ASP expansion from AI add-ons without checking renewal behavior, while others use conservative constant-price logic. Refresh cadence also matters, since fast-moving product bundling can change what is included from one year to the next.
Benchmark comparison
| Source | Market Size | Gaps in Research Methodology |
|---|---|---|
| Mordor Intelligence | USD 16.10 B (2025) | |
| Global Consultancy A | USD 12.70 B (2024) | Uses an earlier base year and appears to include a wider set of software and service components, which can pull in governance and analytics items that are not always sold as discovery. |
| Industry Publisher B | USD 8.90 B (2023) | Anchors the market to reported sales revenue in a prior year and may undercount bundled discovery features sold inside broader data platforms, which can compress the total versus a capability-led scope. |
Taken together, the spread is mostly explained by scope edges and year alignment, rather than by a single math choice. By tying the total to clear buyer use cases, checking pricing against real deployment patterns, and validating assumptions with interviews, the estimate stays traceable to inputs a reader can follow and repeat.
Key Questions Answered in the Report
What is the current size of the data discovery market and how fast is it growing?
The data discovery market is valued at USD 18.82 billion in 2026 and is forecast to reach USD 41.07 billion by 2031, reflecting a 16.92% CAGR.
Which region leads the market today, and which region is expanding the fastest?
APAC is projected to post the quickest 18.27% CAGR through 2031.
Which industry verticals are the biggest contributors and the fastest risers?
Banking, financial services, and insurance represent the largest 23.78% share, whereas healthcare and life sciences are growing at a 18.92% CAGR.
What deployment model is gaining traction against on-premise systems?
Cloud deployments are set to expand at a 24.62% CAGR, outpacing on-premise installations that still account for 54.30% of 2025 revenue.
What are the top restraints that could slow market growth?
The most significant barriers include data-security and privacy risks (–2.8% impact on CAGR), talent shortages in data stewardship (–2.1%), legacy-system integration complexity (–1.7%), and strict sovereign-cloud data-localization mandates (–1.4%).