
Data Classification Market Size and Share
Market Overview
| Study Period | 2020 - 2031 |
|---|---|
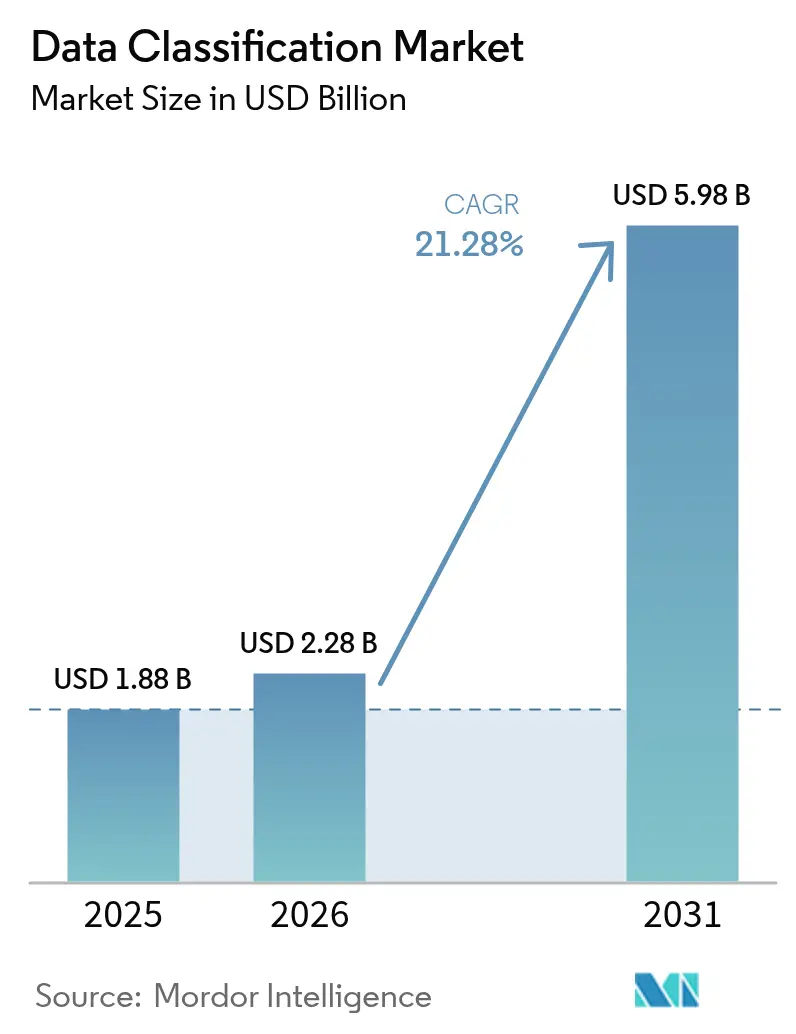
| Market Size (2026) | USD 2.28 Billion |
| Market Size (2031) | USD 5.98 Billion |
| Growth Rate (2026 - 2031) | 21.28 % |
| Fastest Growing Market | Asia Pacific |
| Largest Market | North America |
| Market Concentration | Medium |
Major Players *Disclaimer: Major Players sorted in no particular order Image © Mordor Intelligence. Reuse requires attribution under CC BY 4.0. | |
Data Classification Market Analysis by Mordor Intelligence
The data classification market size in 2026 is estimated at USD 2.28 billion, growing from 2025 value of USD 1.88 billion with 2031 projections showing USD 5.98 billion, growing at 21.28% CAGR over 2026-2031. Rapid data growth, estimated at 328.77 million TB created every day, and tougher global privacy mandates are pushing enterprises to adopt real-time, AI-enabled data labeling that scales across hybrid cloud estates. AI-powered classification engines embedded in cloud-native architectures now detect sensitive information across unstructured repositories, while sovereign-cloud initiatives in Asia-Pacific propel regional demand. The rising threat landscape, where the average energy-sector breach cost hit USD 4.78 million in 2024, further underscores the urgency of automated governance. Investments by hyperscalers such as AWS and Microsoft in regional data centers add momentum by lowering latency and meeting residency rules.
Key Report Takeaways
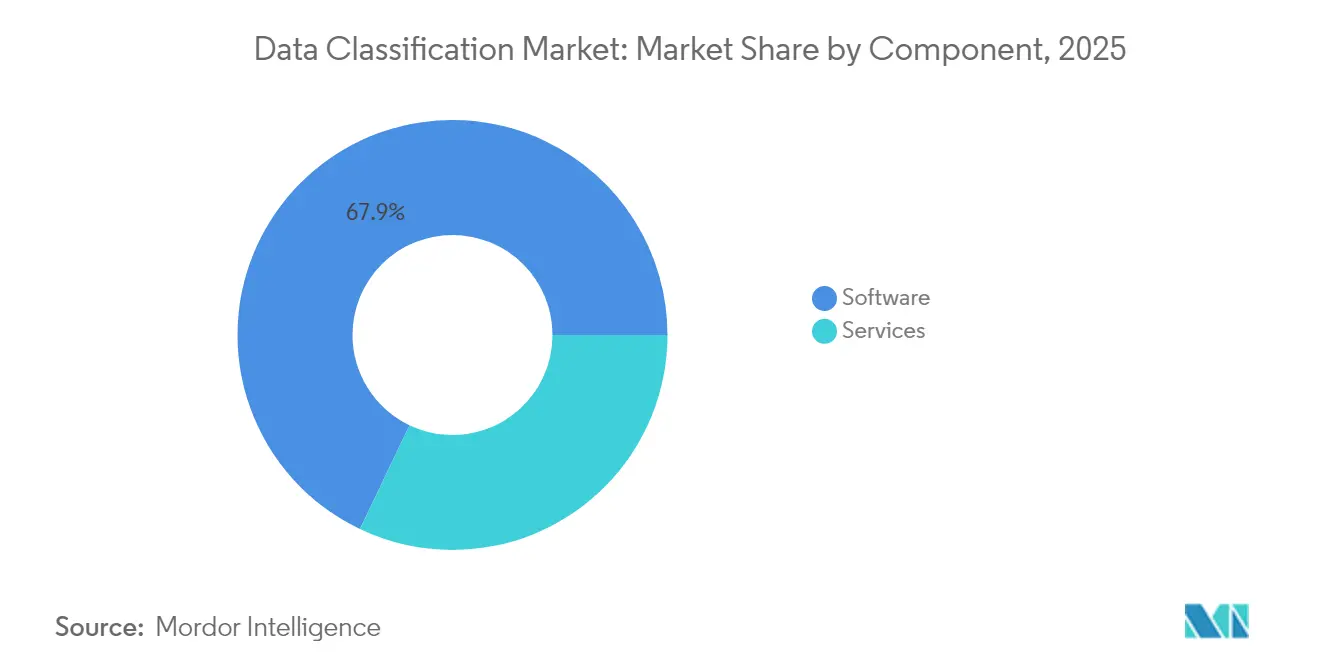
- By component, software led with 67.92% revenue share in 2025, while services are projected to grow at a 23.62% CAGR through 2031.
- By classification method, content-based models captured 42.76% share in 2025; ML-driven approaches are forecast to expand at a 22.44% CAGR to 2031.
- By organization size, large enterprises held 70.55% of the data classification market share in 2025, whereas the SME segment is set to grow at 23.29% CAGR.
- By application, access control and IAM accounted for 56.12% share of the data classification market size in 2025; governance and compliance is advancing at a 22.91% CAGR.
- By industry vertical, BFSI contributed 35.12% revenue share in 2025; government and defense is poised for 21.78% CAGR growth.
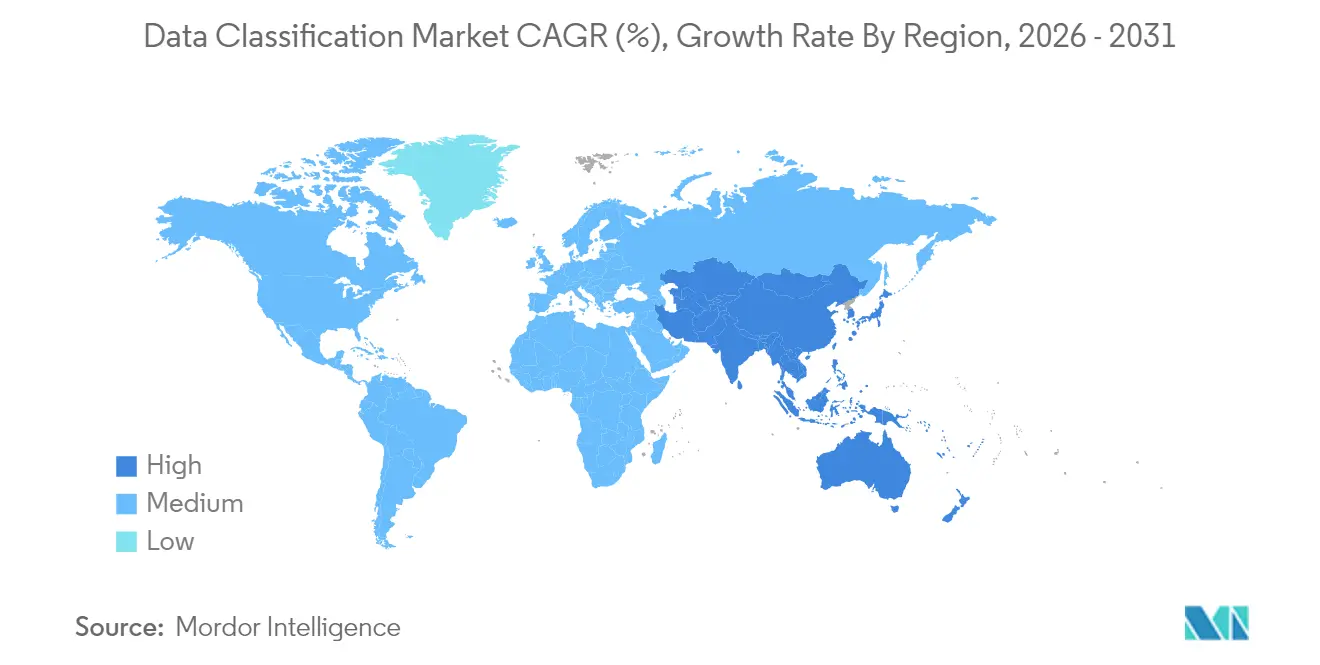
- By geography, North America commanded 40.62% share in 2025, yet Asia-Pacific is projected to record a 22.07% CAGR to 2031.
Note: Market size and forecast figures in this report are generated using Mordor Intelligence’s proprietary estimation framework, updated with the latest available data and insights as of 2026.
Market Trends and Insights
Drivers Impact Analysis of Data Classification Market*
| Driver | (~) % Impact on CAGR Forecast | Geographic Relevance | Impact Timeline |
|---|---|---|---|
| Expanding global privacy mandates | +4.2% | Global, with concentrated impact in EU, North America, and APAC | Medium term (2-4 years) |
| Explosive growth of unstructured data and breach risk | +3.8% | Global, particularly acute in North America and Europe | Short term (≤ 2 years) |
| Cloud-native data classification demand | +3.5% | APAC core, spill-over to MEA and Latin America | Medium term (2-4 years) |
| AI/ML-powered auto-classification hitting production at scale | +3.1% | North America & EU leading, rapid APAC adoption | Short term (≤ 2 years) |
| Confidential-computing chipsets enabling inline tagging | +2.4% | North America and select EU markets | Long term (≥ 4 years) |
| GenAI safety requiring fine-grained data labeling | +2.7% | Global, with early adoption in regulated industries | Medium term (2-4 years) |
| Source: Mordor Intelligence | |||
Expanding Global Privacy Mandates
European DORA rules and updated HIPAA standards shift compliance from scheduled audits to continuous verification, obliging firms to embed classification logic directly into data processing workflows[1]. Multinational enterprises operating in multiple jurisdictions often apply the strictest global requirement as the baseline, which accelerates deployment of unified classification architectures. Financial institutions must meet anti-money-laundering reporting within minutes, increasing demand for policy-driven discovery. Similar pressure comes from Latin American data sovereignty statutes that align with GDPR. Together these mandates shorten procurement cycles, nudging even mid-sized firms toward SaaS-based tools that update policies automatically.
Explosive Growth of Unstructured Data and Breach Risk
Unstructured repositories grow 62% each year, leaving security teams blind to who holds sensitive records. Enterprises report excessive permissions on 82% of file shares, which exposes valuable designs and customer data. Energy utilities now see 1,100 weekly cyberattacks, and breach investigations show mis-classified documents as a root cause. Law practices suffer similar exposure because client files sit in shared drives without labels. AI-driven pattern recognition is increasingly chosen because static rule sets cannot keep pace with dynamic collaboration platforms.
Cloud-Native Data Classification Demand
Sixty-four percent of Australian organizations are testing sovereignty strategies, and nearly half of APAC public-sector agencies plan to adopt such controls within a year. Classification engines must operate across multi-cloud footprints while respecting local residency constraints. Microsoft’s USD 1.5 billion partnership with UAE-based G42 highlights regional compute expansion that depends on built-in labeling to segregate regulated workloads. Sovereign cloud adoption forces enterprises to maintain dual policy layers: global standards and jurisdiction-specific tags. Vendors that automate this mapping gain clear differentiation.
AI/ML-Powered Auto-Classification Hitting Production at Scale
Companies now report 96% improvements in data quality after layering machine learning onto legacy discovery pipelines. Forcepoint integrated Getvisibility’s self-learning model to eliminate lengthy rule creation, letting accuracy improve with live feedback. Microsoft Purview provides more than 200 built-in information types that automatically label content across Exchange, SharePoint, and SQL assets. Rising model precision reduces false positives, which in turn lowers help-desk overhead and speeds user adoption. SMEs benefit most because they previously lacked resources for manual tuning.
Restraints Impact Analysis of Data Classification Market*
| Restraint | (~) % Impact on CAGR Forecast | Geographic Relevance | Impact Timeline |
|---|---|---|---|
| Lack of cross-industry taxonomy standards | -2.1% | Global, with particular challenges in emerging markets | Long term (≥ 4 years) |
| High integration cost in legacy estates | -1.8% | North America and Europe with established IT infrastructure | Medium term (2-4 years) |
| "Classification debt" from synthetic data proliferation | -1.5% | Global, concentrated in AI-intensive industries and regions | Medium term (2-4 years) |
| Homomorphic encryption delaying clear-text inspection | -1.2% | North America & EU leading adoption, selective enterprise deployment | Long term (≥ 4 years) |
| Source: Mordor Intelligence | |||
Lack of Cross-Industry Taxonomy Standards
Financial regulators classify risk data differently from medical authorities, forcing vendors to maintain sector-specific rule libraries. Multinationals must reconcile GDPR terminology with China’s definition of “important data” when transferring files. This fragmentation drives custom coding effort, increases vendor lock-in fears, and slows purchasing decisions. Industry alliances are drafting open schema proposals but adoption remains uneven. As a result, integrators earn sizeable revenue from mapping workshops rather than from pure software licenses.
High Integration Cost in Legacy Estates
Critical-infrastructure providers still operate systems commissioned more than 20 years ago, many lacking modern APIs[2]. Retrofitting classification into such environments often exceeds 18 months, during which compliance risks stay unresolved. SMEs experience similar friction because scarce security staff must balance day-to-day operations with transformation projects. Budget holders sometimes defer classification rollouts until broader ERP upgrades are scheduled. Vendors now promote agentless connectors and pre-built pipelines to curb these costs, but complexity remains a key inhibitor.
*Our forecasts treat driver/restraint impacts as directional, not additive. The impact forecasts reflect baseline growth, mix effects, and variable interactions.
Data Classification Market Segment Analysis
By Component:
Services Propel Growth Beyond Software LicensesSoftware continued to generate the highest revenue, translating into 67.92% of the data classification market in 2025. License sales centered on policy engines, discovery crawlers, and SaaS dashboards. Even so, professional and managed services are scaling at a 23.62% CAGR because enterprises need guidance to clear long-standing classification debt. Engagements often begin with multi-petabyte scans that feed remediation backlogs and stretch internal resources. Managed service providers supplement skill shortages by handling model retraining, regulatory updates, and ticket triage on a subscription basis. These contracts can span several years, which shifts spending from one-time capital expense to recurring OPEX. The approach resonates with boards seeking predictable budgets and audit-ready evidence. In monetary terms, services could represent USD 2.16 billion of the data classification market size by 2031, reflecting their strategic importance. Software vendors are therefore bundling advisory capacity into premium tiers to protect margins.
Second-generation implementations rely on continuous tuning rather than annual health checks. Service partners build DevSecOps pipelines that trigger classification whenever new data lands in object storage. They also codify shared taxonomies across business units, which compresses onboarding timelines for acquisitions. The trend broadens the data classification market because mid-tier firms can rent expertise instead of hiring scarce specialists. Vendor marketplaces now list curated service bundles that align to ISO 27001, HIPAA, or PCI templates, further democratizing adoption. As services revenue accelerates, system integrators are acquiring boutique consultancies to strengthen domain knowledge and secure wallet share.

By Classification Method:
Machine Learning Redefines Accuracy BenchmarksContent-based inspection held 42.76% of spending in 2025 by leveraging regex and fingerprinting to flag intellectual property. Yet ML-driven and semantic models are compounding at a 22.44% CAGR by learning context from millions of labeled documents. Pattern-blind capabilities, such as transformer networks that analyze sentence structure, lift recall rates and cut false alerts. Microsoft Purview trains on global telemetry, which fuels regular model refreshes without customer action. Digital Guardian layers contextual signals like location and device posture on top of content clues, enabling risk-weighted tagging. Combined approaches now ship as pre-configured bundles so administrators can phase in new engines without business disruption.
Early adopters report that ML lifts reviewer productivity by 35%, as fewer items require human adjudication. Organizations with multilingual archives gain measurable benefit because semantic models handle language variance better than manual keyword lists. Vendors are opening APIs to integrate customer-specific ontologies, bringing bespoke accuracy without ground-up development. The shift boosts the data classification market because it turns what was once an elite capability into a SaaS checkbox. Training data nevertheless remains a bottleneck for niche domains, prompting some firms to share anonymized corpora under mutual-benefit agreements. Over the forecast horizon, ML adoption is expected to reduce time-to-value from quarters to weeks, cementing its role as the default methodology.
By Organization Size:
Cloud-Native Platforms Democratize Enterprise-Grade LabelingLarge enterprises contributed 70.55% of 2025 revenue due to regulatory exposure and budget depth. They were early proponents of integrated governance suites that span on-premises file servers and multi-cloud estates. Even so, SMEs now represent the fastest-growing cohort at 23.29% CAGR, benefiting from zero-infrastructure SaaS offerings. Most platforms provision within hours and require only lightweight connectors to email, collaboration, and object storage. Subscription tiers align cost to usage, making entry points viable for firms with fewer than 500 employees. Templates tuned for health, finance, and legal content accelerate deployment because SMEs lack full-time compliance officers.
Education resources, such as Microsoft’s community-led workshops, further lower barriers by training IT generalists to manage classification policies. The PUZZLE framework gives practical checklists that let SMEs embed minimum viable security into cloud workloads. Industry associations also circulate open-source rule packs so members can bootstrap without starting from blank pages. As adoption expands, platform vendors collect telemetry that enhances ML accuracy for all tenants, creating a flywheel that benefits smaller firms disproportionately. The pattern incentivizes marketplaces to list niche connectors for accounting, HR, and customer-relationship systems popular in the mid-market, broadening coverage without bespoke scripting.
By Application:
Governance and Compliance Moves Center StageAccess control and IAM consumed 56.12% of spending in 2025 because label-driven permissions form the backbone of zero-trust policies. Email and mobile protection followed, as distributed workforces share sensitive documents through chat and bring-your-own device channels. The fastest growth, at 22.91% CAGR, lies in governance and compliance dashboards that surface metrics for regulators and boards. These tools draw from classification telemetry to visualize data residency, retention, and lineage. They export machine-readable reports for automated assurance portals, trimming audit preparation from weeks to hours. The capability becomes critical under near-real-time disclosure mandates such as the SEC’s cybersecurity incident rule.
Integrations with risk-scoring engines let compliance teams prioritize remediation based on data criticality rather than file count. Advanced dashboards embed predictive analytics that estimate potential fines if mislabeled records leave a region. Therefore, spending patterns shift from point DLP plugins to unified platforms with built-in analytics. Vendors position compliance modules as product-led growth levers, offering freemium license tiers that surface risk findings and funnel upsell to full-featured suites. The resulting transparency fuels executive sponsorship, expanding the data classification market beyond the security department.

By Industry Vertical:
Government and Defense Accelerate Spending TrajectoryBFSI generated 35.12% of 2025 revenue, fueled by Basel III capital rules and anti-money-laundering detection obligations. Healthcare followed, driven by HIPAA modernization and push for electronic health records. The most rapid expansion, 21.78% CAGR, is in government and defense, where zero-trust requirements and classified information workflows demand precise labeling. The updated DoD Information Security Program obliges contractors to apply uniform marking rules across email, collaboration platforms, and cloud storage. Validation windows for technical-data restrictions now stretch to 6 years, ensuring sustained service revenue. Defense agencies also invest in inline labeling at network gateways to support secure cross-domain solutions.
Critical infrastructure operators, such as utilities experimenting with smart-grid analytics, increasingly mirror defense-grade practices to block nation-state threats. National data strategies call for sovereign cloud facilities, which in turn require multi-tenant segmentation enforced by classification tags. Large system integrators form joint ventures with public-sector entities to align product roadmaps to mission needs. As these contracts often specify domestic hosting, localization boosts regional SaaS footprints. Vertical specialization therefore becomes a competitive differentiator and ensures steady inflows to the data classification market.
Geography Analysis
North America Data Classification Market
North America retained leadership with 40.62% of 2025 revenue because stringent regulations and early AI adoption pushed enterprises to modernize discovery programs. BigID’s USD 60 million funding round in 2025 exemplifies venture appetite for solutions that automate data hygiene ahead of new SEC disclosure rules. Financial institutions deploy labeling to meet intraday reporting, while healthcare providers integrate tags into electronic medical records to comply with evolving HIPAA expansions. Canada’s provincial privacy acts mirror federal requirements, reinforcing consistent demand. Mexico’s tech clusters adopt cloud-hosted platforms to meet USMCA data-transfer clauses, though uptake concentrates in multinational subsidiaries.
APAC Data Classification Market
Asia-Pacific is the fastest-growing region with a 22.07% CAGR, reflecting sovereign-cloud mandates and heavy infrastructure spending by hyperscalers. AWS pledged USD 6 billion to Malaysia and NTT committed USD 90 million to Bangkok data centers, creating local compute that reduces latency for policy engines. China proposes easing outbound data approval but still labels many datasets as “important,” forcing dual controls. Japan and South Korea deploy classification in 5G manufacturing to protect trade secrets. India’s IT-services exporters demand multi-tenant tagging to segregate client data, expanding the addressable pool of cloud subscribers.
Europe Data Classification Market
Europe ranks a solid second by value, propelled by the Digital Operational Resilience Act that requires continuous control testing by 2025. Germany’s Industry 4.0 plants tag operational data to safeguard intellectual property and comply with supply-chain security audits. The United Kingdom balances post-Brexit adequacy with domestic innovation rules, so firms monitor cross-border flows under dual policies. France promotes sovereign cloud zones to host public-sector workloads, while Italy tightens critical-infrastructure protections. Nordic countries, early GDPR adopters, now pilot confidential-computing chips that enable inline tagging without exposing clear text, positioning the region for next-wave innovation.
Regulatory Landscape
Data classification adoption is being directly shaped by security and privacy regimes that formalize how sensitive information is labeled, controlled, and sometimes kept in-country. In China, GB/T 43697-2024 (issued by the State Administration for Market Regulation, effective October 1, 2024) provides a structured approach to data classification and grading. The PRC Regulations on Network Data Security Management (adopted August 2024, effective January 1, 2025) require categorized and classified protection of network data based on its security importance, which raises compliance requirements for enterprises operating cross-border data flows.
In the United States, NIST guidance continues to anchor operational controls and the terminology used by many global programs, including NIST SP 800-53 Rev. 5 and NIST IR 8496 (2023) for baseline classification language supporting Zero Trust implementations. Newer sovereignty and residency requirements are also emerging: the Philippines Executive Order No. 119 (signed July 13, 2026) establishes a mandatory government data classification and residency framework that distinguishes restricted-access versus open-access data. This reinforces jurisdiction-aware tagging and residency enforcement as procurement requirements for in-scope tools and services.
Value Chain Analysis
The value chain starts with policy and taxonomy definition, then data discovery and inventory across structured and unstructured repositories. It moves to classification engine execution (content, context, role, and ML/semantic models), followed by policy enforcement (IAM/ABAC, DLP, encryption, retention), and ends with reporting and evidence for audits and continuous controls. Hyperscalers and governance platforms (for example, Microsoft Purview and cloud-native stacks from AWS and others) provide embedded controls and connectors, while specialist vendors add deep content analytics and privacy dashboards. Delivery is completed through systems integrators, managed security service providers, and consultancies that run multi-petabyte scans, tune models, map sector taxonomies, and maintain policy updates, supporting the market shift toward recurring services alongside software.
Key bottlenecks sit at taxonomy harmonization and integration layers. Fragmented definitions across industries and jurisdictions increase customization needs, while legacy estates without modern APIs prolong deployment cycles and raise services dependency. Sovereign cloud and regulated-industry architectures add requirements for cryptographic control and segmentation, illustrated by Deutsche Telekom building a sovereign data platform on Google Cloud with external key management and format-preserving encryption to meet GDPR and Germany's telecommunications privacy requirements. Standards and practical guides such as NIST NCCoE draft practice guidance on discovering and labeling unstructured data (SP 1800-39 IPD, February 2026) feed the ecosystem by giving buyers implementable reference patterns that vendors and integrators translate into packaged accelerators.
Competitive Landscape
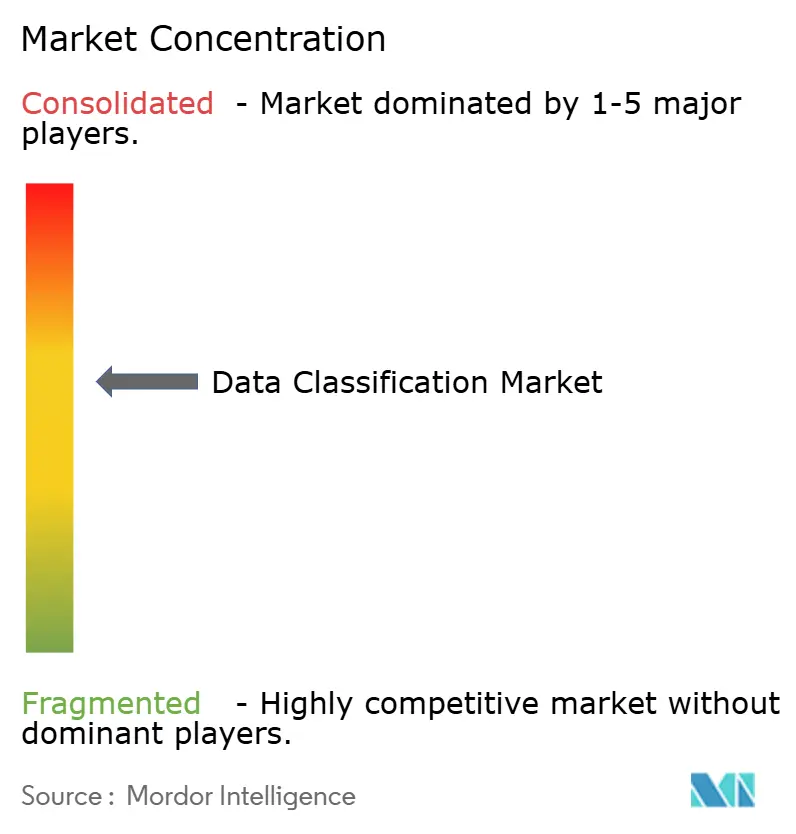
The data classification market exhibits moderate fragmentation as hyperscale cloud vendors and specialized security firms vie for platform share. Microsoft Purview integrates labeling across Azure, Microsoft 365, and SQL services, offering one-stop governance that entices large enterprises. AWS, Google Cloud, and IBM embed similar controls into storage APIs, lowering adoption friction for developers. Specialized vendors such as Varonis and BigID differentiate through deep-content analytics and privacy dashboards that visualize data lineage. Emerging players like Cyera focus on cloud-native data security posture management, attracting rapid funding and accelerating innovation.
Acquisition activity is reshaping competitive dynamics. Forcepoint purchased Getvisibility to pair self-learning models with its DLP engine, improving precision across hybrid clouds. Capgemini bought Syniti to fuse data-quality services with governance consulting, expanding value-added offerings. Snowflake’s acquisition of Reka AI and Databricks’ purchase of MosaicML illustrate the convergence of analytics, AI, and labeling capabilities. These moves respond to buyer preference for consolidated platforms that cut licensing complexity and integrate compliance evidence.
Pricing models evolve toward consumption-based tiers tied to terabytes scanned and users protected. Vendors bundle starter kits with pre-built taxonomies to accelerate time-to-value. Channel partners build vertical accelerators that encode sector regulations, creating sticky ecosystems. Competitive advantage increasingly centers on demonstrable ROI, with suppliers showcasing breach-cost avoidance and audit resource savings. Market entrants offering narrow point solutions face pressure as customers consolidate around integrated suites backed by global support networks.
Data Classification Industry Leaders
-
Amazon Web Services, Inc.
-
Boldon James Ltd (QinetiQ)
-
IBM Corporation
-
Microsoft Corporation
-
Broadcom Inc. (Symantec Corporation)
- *Disclaimer: Major Players sorted in no particular order
Data Classification Market Companies Covered in this Report
- Amazon Web Services
- Microsoft Corporation
- IBM Corporation
- Broadcom (Symantec)
- Google LLC
- OpenText (TITUS)
- Thales Group
- Fortra (Boldon James)
- SECLORE
- Digital Guardian
- Forcepoint
- Varonis Systems
- BigID Inc.
- Concentric AI
- Netwrix Corporation
- Spirion LLC
- Immuta Inc.
- OneTrust LLC
- PKWARE Inc.
- Palo Alto Networks
Market Opportunities and Future Outlook
Productization of automated classification inside core data platforms is expanding the addressable buyer set beyond standalone tools, particularly for semi-structured and unstructured data that drives most compliance and breach exposure. In 2026, Snowflake made sensitive data classification generally available for semi-structured JSON data types (VARIANT, ARRAY, OBJECT). Databricks made automated data classification generally available in Unity Catalog alongside attribute-based access control, explicitly mapping to compliance contexts such as GDPR and HIPAA. Platform-level embedding creates whitespace for vendors and service providers to deliver connectors, taxonomy packs, and governance workflows that cover hybrid estates and map labels directly to enforcement (row/column controls, DLP, and access policies).
Opportunities are also opening around AI-era operating models where classification becomes a prerequisite for safe GenAI use and for scaling controls across collaboration and cloud services. Cloudflare added Data Classification into DLP profiles (April 2026), and AWS introduced an AI-agent approach for automated classification in Amazon SageMaker Catalog (March 2026), reflecting a shift toward agent-assisted discovery and faster onboarding of new datasets. Buyer interest in auditable, repeatable practices is reinforced by public-sector guidance workstreams such as NIST NCCoE's SP 1800-39 draft (comment period open through March 30, 2026), which supports demand for implementation services that translate reference architectures into production policies, test evidence, and operating procedures across regulated industries and sovereign cloud deployments.
Recent Industry Developments in Data Classification Market
- July 2026: Microsoft began a public preview roadmap for integrating Microsoft Purview Data Loss Prevention with Entra Internet Access to extend classification-driven controls to the network layer. The roadmap targets prevention of sensitive data uploads to unauthorized AI services and unmanaged destinations. It also broadens enforcement beyond endpoints and files, tightening governance in hybrid work and SaaS-heavy environments.
- June 2025: IBM introduced new software to unify governance and security for agentic AI, aligning policy controls with how automated agents access and use enterprise data. The announcement reinforces the convergence of data classification, governance evidence, and AI security controls within unified platforms. For buyers, it supports vendor consolidation strategies where classification and enforcement telemetry feed the same governance layer.
- December 2024: Microsoft announced new Microsoft Purview capabilities aimed at protecting and governing data in the era of AI, expanding how sensitivity labels and related controls are applied across Microsoft environments. The update increased practical coverage of classification and policy enforcement across collaboration and data services. It also strengthened the pull-through effect of integrated suites, where labeling connects directly to access controls and compliance reporting.
Data Classification Market Report Scope and Research Methodology
Market Definition and Coverage
This market covers software and related services used to identify, tag, and label enterprise data so it can be handled correctly for security, governance, and compliance across cloud, on-premises, and hybrid environments.
Scope exclusions: We exclude general data catalog, data discovery, and data labeling tools used mainly for AI model training when they are not sold or positioned as data classification offerings.
Segments Covered in This Report
- By Component
- Software
- Services
- By Classification Method
- Content-based
- Context-based
- User-/Role-based
- ML-driven and Semantic
- By Organization Size
- Large Enterprises
- Small and Medium Enterprises (SMEs)
- By Application
- Access Control and IAM
- Governance and Compliance
- Email and Mobile Protection
- By Industry Vertical
- BFSI
- Healthcare and Life Sciences
- Government and Defence
- IT and Telecom
- Energy and Utilities
- Other Industry Verticals
- By Geography
- North America
- United States
- Canada
- Mexico
- Europe
- Germany
- United Kingdom
- France
- Italy
- Spain
- Rest of Europe
- Asia-Pacific
- China
- Japan
- India
- South Korea
- Australia
- Rest of Asia-Pacific
- South America
- Brazil
- Argentina
- Rest of South America
- Middle East and Africa
- Middle East
- Saudi Arabia
- United Arab Emirates
- Turkey
- Rest of Middle East
- Africa
- South Africa
- Egypt
- Nigeria
- Rest of Africa
- Middle East
- North America
Data Sources, Market Sizing, and Validation
Desk Research
Desk research starts with building the demand context and the policy backdrop for data classification, then mapping that to how enterprises typically spend on these tools and services. We mainly rely on public, regulator-facing sources such as NIST guidance, CISA advisories, and the SEC's cybersecurity disclosure rules, because these requirements influence adoption priorities and buying timelines.
For market inputs, we also review sources such as US Census and Eurostat digital economy indicators, OECD digital security publications, and ENISA reports on cloud and data protection practices. These are complemented with company annual reports, earnings call transcripts, product documentation, and reputed press coverage so we can capture packaging, deployment patterns, and the typical buyer journey. In a few cases, we use paid subscriptions for company financials and patent databases to check direction on revenue and innovation intensity, while still treating the NIST, CISA, and SEC desk-source list as the anchor for coverage. The desk-source list is not exhaustive, and additional sources were used for cross-checks and clarification.
Primary Interviews and Surveys
Primary discussions are used to confirm what counts as data classification spend, and to stress-test the main adoption drivers such as regulatory urgency, cloud migration, and security posture maturity. We spoke with a mix of solution providers, channel partners, and end users across IT, security, and risk teams, with interviews covering APAC, EMEA, and the Americas so regional buying differences are reflected in the final model.
Distribution of primary research fieldwork respondents
| Company type | Respondent position | Region |
|---|---|---|
| Top tier: 38% | CXOs: 12% | APAC: 43% |
| Mid tier: 47% | Functional/Unit leaders: 29% | EMEA: 34% |
| Smaller Players: 15% | Managers: 59% | Americas: 23% |
Market-Sizing & Forecasting
Sizing is built using top-down and bottom-up logic. We start with a top-down demand pool reconstructed from enterprise security and compliance spending patterns, then narrow it to the share attributable to data classification use cases. To keep the model grounded, we anchor it to market variables such as growth in enterprise data volumes, cloud and hybrid adoption levels, regulatory and audit activity, data breach and insider risk trends, and the share of workloads that require access control and governance controls.
After setting the demand pool, we corroborate totals using selective bottom-up approximations, including sampled vendor revenue signals, channel checks on typical deal sizes, and an ASP-by-deployment view (cloud subscription versus on-premises licensing plus services). Where product bundles create measurement gaps, spend is allocated only when classification functionality is clearly priced, contracted, or actively deployed. Those allocations are then rechecked using interview feedback.
Forecasting uses scenario analysis with short-run trend smoothing on key inputs, because policy changes and security incidents can shift budgets quickly. The base case is adjusted using expert views on the pace of automation in classification workflows, expected service attachment rates, and how fast regulated industries expand coverage across data types.
Data Validation & Update Cycle
Validation is done through repeated cross-checks across the model. We compare outputs against independent indicators such as security software growth, cloud workload expansion, and reported compliance investment trends. If a segment or region shows an unusual jump, we review the underlying driver assumptions, and respondents are re-contacted when the variance cannot be explained through public indicators.
Before sign-off, we run a multi-step review so calculation logic, currency handling, and year alignment stay consistent across tables and narratives. Reports are refreshed annually, and interim updates are made when material events occur, such as major regulatory enforcement actions or sharp changes in enterprise IT spending. Right before delivery, we run a fresh update pass so clients receive the latest view available.
Mordor Intelligence's Data Classification Market Size Measured Against Other Published Estimates
Published market values for data classification can differ widely because the market is defined differently, the base year is not the same, and services are not always treated consistently. We also see gaps where studies use different currency timing, assume faster growth than observed, or do not recheck assumptions with practitioner feedback.
A common split is whether adjacent areas like data discovery, cataloging, or broader data governance platforms are counted inside the same revenue pool, and then projected forward as one market. Some estimates also use longer forecast horizons that naturally compound into larger end values, and they may apply a single high CAGR without testing it against near-term indicators such as regulation-driven projects or cloud migration pacing. Mordor Intelligence limits the total to data classification software and related professional or managed services, and we exclude broader platforms unless classification spend can be separated and validated.
Benchmark comparison
| Source | Market Size | Gaps in Research Methodology |
|---|---|---|
| Mordor Intelligence | USD 2.28 B (2026) | |
| Global Consultancy A | USD 1.85 B (2024) | Uses an earlier base year with a shorter history window and applies a faster growth path to 2030, which can lift the forward curve even if near-term service attachment is lighter. |
| Industry Publisher B | USD 1.94 B (2024) | Uses a broad segmentation view and a different forecast window to 2035, and the longer compounding period can inflate the end market value compared with a tighter mid-term forecast. |
The table indicates that timing and scope choices explain much of the spread, even before forecasting technique is considered. Our approach remains traceable to specific spend drivers, separates software from services where possible, and then uses interview-based checks to keep totals aligned to what buyers actually implement.
Key Questions Answered in the Report
What is the current size of the data classification market?
The market is valued at USD 2.28 billion in 2026 and is forecast to reach USD 5.98 billion by 2031, representing a 21.28% CAGR.
Which region is growing the fastest?
Asia-Pacific shows the highest growth, with the data classification market expected to post a 22.07% CAGR through 2031 due to sovereign-cloud mandates and infrastructure investment.
Which component segment is expanding most rapidly?
Services are growing at 23.62% CAGR because organizations need professional guidance to deploy and maintain AI-enabled labeling across hybrid environments.
How are machine-learning methods impacting adoption?
ML-driven classification improves accuracy, lowers false positives, and reduces manual tuning, helping smaller firms access enterprise-grade protection.
What industries are investing most heavily?
BFSI leads in current spending thanks to strict regulations, while government and defense show the fastest growth at 21.78% CAGR due to national security requirements.
What is a key restraint to wider deployment?
Integrating classification into legacy estates remains costly and time-consuming, particularly for critical infrastructure sectors that still operate outdated systems.