
Data Center RFID Market Size and Share
Market Overview
| Study Period | 2020 - 2031 |
|---|---|
| Market Size (2026) | USD 2.59 Billion |
| Market Size (2031) | USD 4.65 Billion |
| Growth Rate (2026 - 2031) | 12.44 % |
| Fastest Growing Market | Asia-Pacific |
| Largest Market | North America |
| Market Concentration | Medium |
Major Players *Disclaimer: Major Players sorted in no particular order Image © Mordor Intelligence. Reuse requires attribution under CC BY 4.0. | |
Data Center RFID Market Analysis by Mordor Intelligence
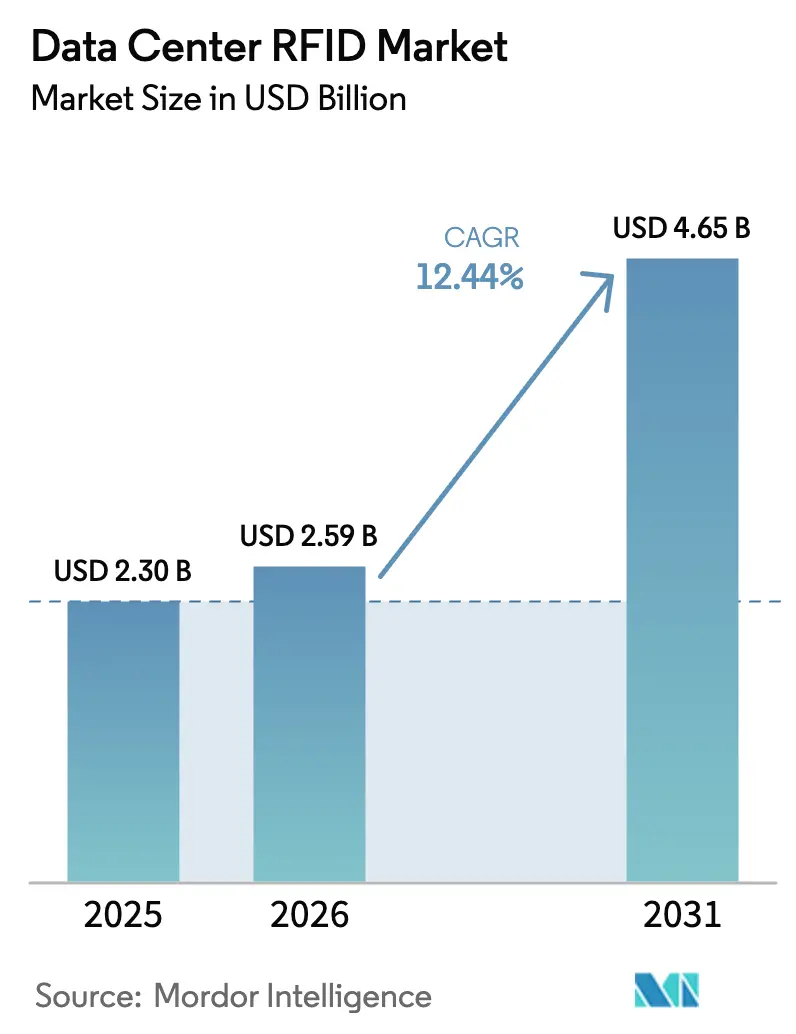
Data center RFID market size in 2026 is estimated at USD 2.59 billion, growing from 2025 value of USD 2.3 billion with 2031 projections showing USD 4.65 billion, growing at 12.44% CAGR over 2026-2031. Capacity expansions at hyperscale facilities, which now double every four years to support racks drawing 40–140 kW, are the primary catalyst behind this growth trajectory DataCenterDynamics. Regulatory audits, sustainability mandates, and the need for real-time visibility over millions of distributed assets further reinforce adoption, pushing RFID from optional to essential in next-generation facilities. Integration with Data Center Infrastructure Management (DCIM) platforms is accelerating value creation by automating ticketing, thermal mapping, and predictive maintenance workflows, while falling UHF tag prices have removed the last meaningful cost barrier. Together, these forces position the data center RFID market as a core enabler of AI-driven, high-density infrastructure operations around the world.
Key Report Takeaways
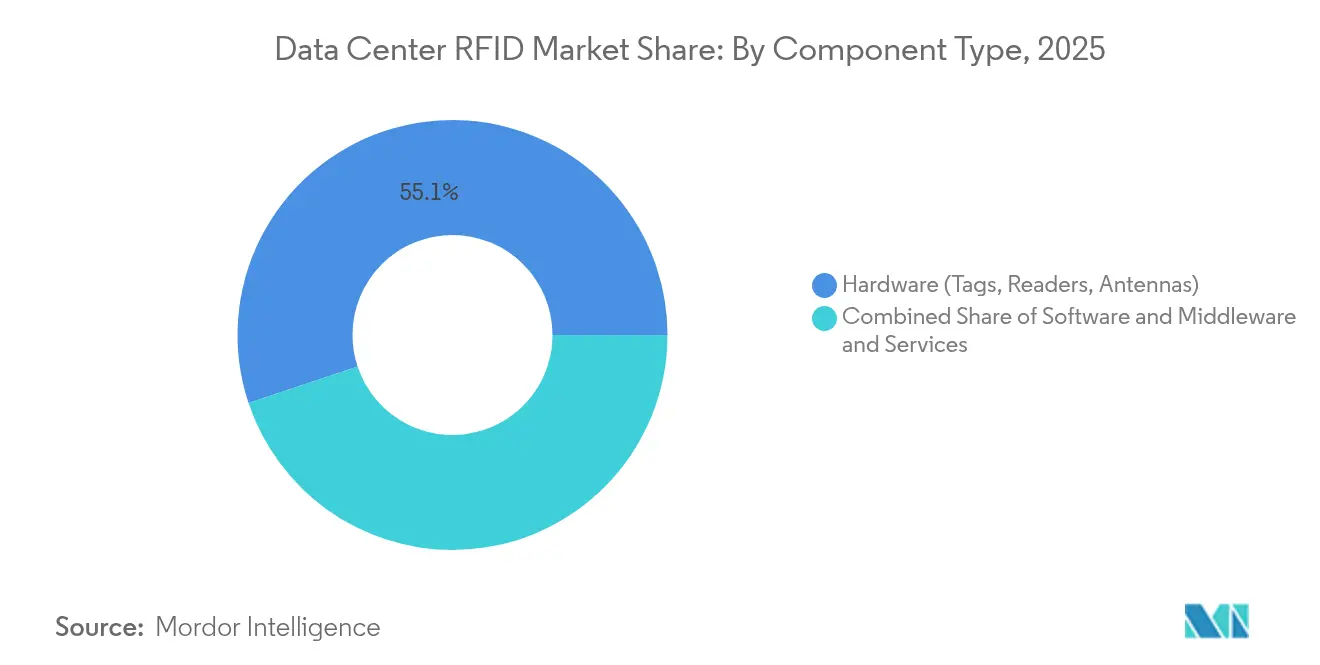
- By component, hardware captured 55.12% of data center RFID market share in 2025, while software and middleware is on track for the fastest CAGR at 13.39% through 2031.
- By tag type, passive tags led with 71.65% revenue share in 2025; active tags are projected to grow at 14.46% CAGR to 2031.
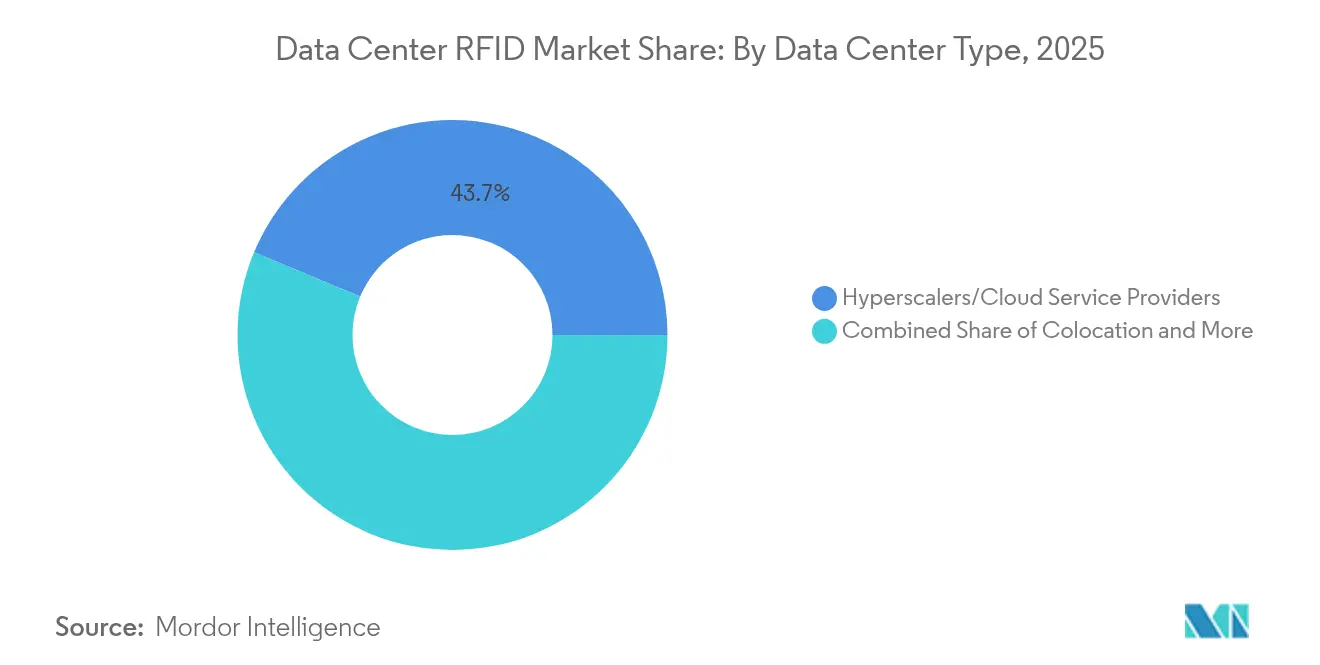
- By data-center type, hyperscalers held 43.72% share of the data center RFID market size in 2025 and are advancing at 14.55% CAGR through 2031.
- By application, asset tracking accounted for 45.86% of data center RFID market size in 2025, while environmental monitoring posts the quickest rise at 15.02% CAGR to 2031.
- By geography, North America retained 36.95% share of the data center RFID market in 2025; Asia-Pacific records the strongest 15.21% CAGR through 2031.
Note: Market size and forecast figures in this report are generated using Mordor Intelligence’s proprietary estimation framework, updated with the latest available data and insights as of 2026.
Market Trends and Insights
Drivers Impact Analysis of Data Center RFID Market*
| Driver | (~) % Impact on CAGR Forecast | Geographic Relevance | Impact Timeline |
|---|---|---|---|
| Real-time asset audit compliance pressure | 2.8% | Global, with early gains in North America, EU | Medium term (2-4 years) |
| Declining RFID tag cost curves | 2.1% | Global | Short term (≤ 2 years) |
| Integration with DCIM and ITSM stacks | 1.9% | North America and EU, spill-over to APAC | Medium term (2-4 years) |
| Hyperscale and edge data-center build-outs | 3.2% | APAC core, spill-over to MEA | Long term (≥ 4 years) |
| AI-enabled RFID thermal mapping | 1.4% | National, with early gains in hyperscale facilities | Long term (≥ 4 years) |
| Circular IT lifecycle buy-back tracking | 0.8% | EU and North America | Long term (≥ 4 years) |
| Source: Mordor Intelligence | |||
Real-time Asset Audit Compliance Pressure Drives Market Acceleration
Persistent audit and governance demands oblige operators to maintain continuously updated inventories rather than occasional cycle counts, and RFID delivers near-perfect accuracy that barcode systems cannot match. The Social Security Administration’s RFID program achieved a 90% cut in labor hours while improving audit accuracy to 99%.[1] Financial institutions reliant on Sarbanes-Oxley compliance have mirrored these outcomes, reporting inventory accuracy above 99% after RFID rollout. Continuous monitoring slashes remediation costs when assets go misplaced and enables real-time reporting to satisfy regulators. This dynamic amplifies spending among U.S. agencies and multinational banks, placing compliance as a top investment trigger for the data center RFID market.
Declining RFID Tag Cost Curves Enable Mass Deployment
Passive UHF tag pricing has slipped to USD 0.10–0.50 per unit as 300 mm wafer production and antenna material advances scale manufacturing efficiencies.[2] Active tags have fallen to USD 15–50 each, opening budget headroom for dense sensor networks in large campuses. Capital injections such as Tageos’ USD 100 million U.S. plant and Avery Dennison’s Mexico line underscore industry confidence in rising volumes. As chip shortages ease by early 2025, predictable supply ensures operators can plan multi-year rollouts without price spikes. Lower unit economics now position data center RFID market adoption as a cost-saving initiative rather than a discretionary capital outlay.
Integration with DCIM and ITSM Stacks Enhances Operational Intelligence
RFID feeds directly into modern DCIM suites, turning static asset ledgers into real-time command centers. Sunbird’s platform processes over 10 billion daily datapoints to trigger automated alerts for thermal, humidity, and capacity deviations.[3] British Airways deploys dcTrack to allocate servers faster across six sites while ServiceNow connectors push location changes straight into enterprise workflows. This deep integration makes RFID indispensable for predictive maintenance and energy savings, accelerating the data center RFID market penetration in mature operations.
Hyperscale and Edge Data-Center Build-outs Fuel Demand
Roughly 120 new hyperscale halls open each year, and edge nodes proliferate even faster as AI inference workloads localize near users. AWS, Meta, and regional players like Sify are injecting billions into capacity, each site requiring thousands of tags, readers, and sensors. Distributed micro-centers with 3–10 kW cabinets depend on unattended, automated monitoring, pushing RFID right to the network edge. These construction pipelines lock in multi-year hardware and software demand, ensuring sustained double-digit growth for the data center RFID market.
Restraints Impact Analysis of Data Center RFID Market*
| Restraint | (~) % Impact on CAGR Forecast | Geographic Relevance | Impact Timeline |
|---|---|---|---|
| High CAPEX and skilled labor cost | -1.8% | Global | Short term (≤ 2 years) |
| RF interference inside dense racks | -1.2% | Global, particularly high-density facilities | Medium term (2-4 years) |
| Data-sovereignty limits on active-tag telemetry | -0.9% | EU, China, emerging markets | Long term (≥ 4 years) |
| Battery-waste concerns in active tags | -0.6% | EU, North America | Long term (≥ 4 years) |
| Source: Mordor Intelligence | |||
High CAPEX and Skilled Labor Cost Constraints
End-to-end deployments often start near USD 27,000 and require engineers versed in antenna physics and data-center protocols. The worldwide shortage of such talent extends project timelines and inflates consulting fees, especially for mid-tier operators. While long-run savings offset upfront expenses, smaller enterprises still label RFID as discretionary. Training programs and turnkey service bundles are emerging to ease adoption, yet the labor gap continues to shave points off the data center RFID market growth potential.
RF Interference Inside Dense Racks Creates Technical Challenges
Metal enclosures, power cables, and liquid-cooling lines generate multipath reflections that degrade read rates, as shown by Sandia National Laboratories where accuracy dipped to 93.9% in live server rooms. AI clusters topping 100 kW per rack intensify electromagnetic noise, requiring directional antennas and fine-tuned power levels. These engineering hurdles raise deployment complexity and sometimes necessitate hybrid tagging strategies, restraining immediate expansion in the densest compute halls of the data center RFID market.
*Our forecasts treat driver/restraint impacts as directional, not additive. The impact forecasts reflect baseline growth, mix effects, and variable interactions.
Data Center RFID Market Segment Analysis
By Component:
Hardware Dominance Driven by Infrastructure ScalingHardware retained 55.12% share of the data center RFID market in 2025 on the back of massive tag rollouts that accompany every new rack build. RF Code has shipped over 3 million tags into enterprise facilities, illustrating the scale of physical deployments. In revenue terms, readers and antennas represent the lion’s share of upfront spend, while middleware subscriptions drive recurring margins. Software and analytics, though smaller today, post the fastest 13.39% CAGR as operators demand AI-enabled insights. Services revenue follows hardware growth because integration, calibration, and ongoing optimization require specialized staff. Together, these spending patterns demonstrate why the data center RFID market size for hardware remains dominant even as value creation shifts toward data and automation layers.
Demand elasticity favors hardware even further because tag unit prices are falling, permitting operators to tag every blade, cable, and peripheral. As enterprises mature, they migrate from handheld readers to continuous fixed-reader grids, expanding antenna footprints in both white space and loading docks. This evolution guarantees multi-year hardware refresh cycles, keeping physical components at the center of procurement strategies. Meanwhile, recurring licenses for DCIM connectors, API feeds, and cybersecurity modules elevate total cost of ownership but also deepen vendor-client lock-in, supporting a balanced ecosystem across the data center RFID industry.

By Tag Type:
Passive Tags Lead Despite Active Growth MomentumPassive tags claimed 71.65% share in 2025 owing to minimal cost and battery-free longevity that stretches asset lifespans. In dense rack aisles where read distances span only centimeters, passive solutions meet audit requirements at the lowest possible budget. The data center RFID market size for passive tagging therefore remains unparalleled. Active tags, however, expand faster at 14.46% CAGR because real-time environmental sensing and 100 meter read ranges support thermal mapping and perimeter security. Modern active platforms integrate temperature, humidity, and even vibration sensors on a single tag, justifying higher unit prices in AI facilities that demand granular data.
Hybrid semi-passive designs have started bridging the gap by pairing passive read modes with battery-assisted sensor functions, enabling five-year lifecycles at mid-tier cost. As circular-economy regulations mandate cradle-to-grave tracking, demand for richer telemetry will likely narrow the lead passive tags hold today. Still, volume economics dictate that passive labels will dominate unit sales for the foreseeable future, underscoring their foundational role in the data center RFID market.
By Data-Center Type:
Hyperscalers Drive Market LeadershipHyperscale and cloud operators represented 43.72% of data center RFID market share in 2025 as single campuses often house over 250,000 tagged assets. Their standardized build templates streamline RFID design, and central purchasing delivers volume discounts that smaller entities cannot match. Double-digit facility growth planned by AWS, Google, and Microsoft ensures this segment also records the steepest 14.55% CAGR toward 2031. Colocation providers follow, requiring multi-tenant segregation that amplifies the need for precise asset location verification. Edge micro-data centers, though smaller individually, represent high-growth greenfield deployments, especially in telecom and retail sectors where thousands of sites roll out in parallel.
Economies of scale favor hyperscalers but also introduce challenges like RF zoning across millions of square feet. Consequently, these giants often implement layered RFID architectures mixing overhead antenna grids with rack-level readers. The resulting best practices trickle down to enterprise and edge clients, setting industry baselines and propelling the entire data center RFID market forward.
By Application:
Asset Tracking Dominates with Environmental Monitoring SurgeAsset tracking delivered 45.86% of data center RFID market size in 2025 because every operator must know what device sits in each rack at any moment. The shift from annual audits to real-time ledgers eliminates manual errors and satisfies auditors instantly. Environmental monitoring, however, captures the strongest 15.02% CAGR as AI clusters increase thermal risk. Sensors tied to RFID networks stream temperature and humidity readings at rack granularity, supporting dynamic cooling and energy savings that can lower PUE. Enhanced workflows such as automatic incident tickets or decommission flags now ride on asset location changes, illustrating the expanding scope of RFID beyond inventory into operational control.
Security integrations add further layers by matching employee badges with asset moves, thwarting insider threats. Workflow automation is emerging as the next wave, where AI engines predict spare-part demand or schedule maintenance windows based on RFID signals. These evolving use-cases enlarge the addressable footprint, ensuring application diversification continues to lift the data center RFID market.
Geography Analysis
North America Data Center RFID Market
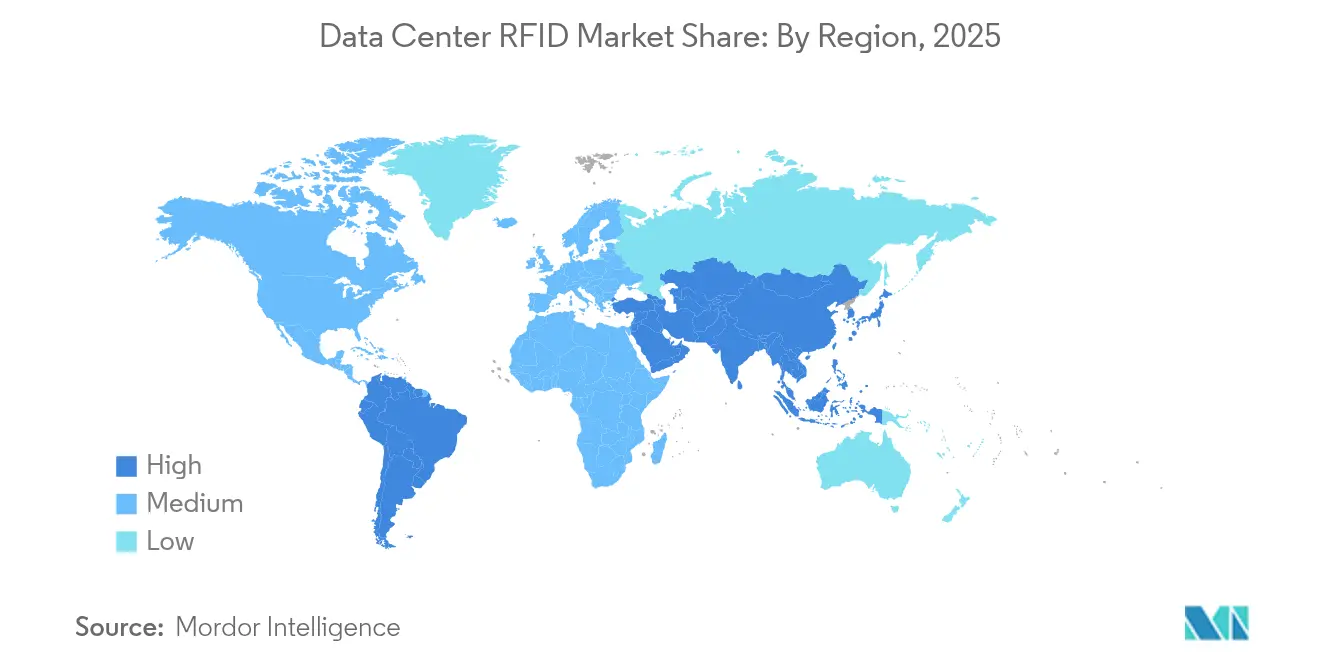
North America held 36.95% of the data center RFID market in 2025, benefiting from mature hyperscale footprints, stringent audit laws, and aggressive AI adoption that demands accurate asset provenance. AWS’s USD 10 billion Mississippi plan and multi-site federal contracts ensure sustained tag volumes. Edge deployments across retail and telecom corridors further expand opportunities, especially as 5G coverage accelerates latency-sensitive compute needs. Regulatory convergence under frameworks like NIST SP-800 strengthens compliance drivers, reinforcing RFID as the de-facto standard for asset validation.
APAC Data Center RFID Market
Asia-Pacific is scaling even faster at 15.21% CAGR thanks to large-scale builds in China, Japan, India, and Southeast Asia. Sify Technologies alone earmarked USD 5 billion for AI data centers that will require millions of tags at inception. Japan’s construction cost surge underscores restricted land and power, pushing operators toward dense racks that magnify thermal management needs and accelerate sensor uptake. Local regulations tilt toward data sovereignty, prompting interest in passive or semi-passive tags that store data locally while limiting active telemetry.
EMEA and South America Data Center RFID Market
Europe combines significant installed base with complex data privacy statutes. Energy-efficiency directives mandate granular monitoring, making RFID vital for carbon accounting. Yet cross-border data flows remain constrained, shaping architectures that anonymize or locally process tag telemetry. Middle East and Africa show rising footprints in Gulf countries where renewable-powered campuses emerge, and South America gains traction through cloud-region rollouts in Brazil and Chile. Collectively, these diversification patterns assure the global data center RFID market remains on a structurally sound upward path.
Regulatory Landscape
RFID deployments in data centers sit at the intersection of facility and security standards, and radio and identification standards. On the facility side, ISO/IEC 22237-6:2024 sets out requirements for data-center security systems, including controls around unauthorized access and intrusion, which reinforces operator demand for verifiable asset inventories and traceability as part of audit-ready security programs.
On the RFID side, ISO/IEC 18000-65:2026 defines air-interface parameters for RFID devices operating in the 860 MHz to 930 MHz range, with support for streaming sensor data. This aligns with the market shift from periodic inventory to continuous monitoring, including environmental telemetry. In parallel, data-sovereignty and data-residency requirements in several jurisdictions shape architectures for active-tag telemetry and cloud analytics, pushing more processing and retention toward in-country systems and on-prem DCIM/ITSM integrations.
Value Chain Analysis
The data center RFID value chain starts with component inputs, including RFID ICs, antennas or inlays, and sensor elements for active or battery-free tags. It then moves through tag and inlay manufacturing and into reader and antenna OEMs, followed by solution assembly that bundles hardware with middleware, location engines, and connectors into DCIM and ITSM stacks.
Deployment and lifecycle services, such as site RF surveys, calibration in dense rack aisles, integration, and managed monitoring, account for a meaningful share of project delivery because interference mitigation and workflow automation are operator-specific. Downstream, data-center operators, including hyperscalers, colocation providers, and enterprises or edge operators, consume these solutions to maintain audit-grade inventories and automate operational workflows. Partnerships between RFID vendors and DCIM platforms are a recurring go-to-market route, including RF Code integrating asset lifecycle and environmental monitoring with Schneider Electric EcoStruxure IT. Hardware supply and sourcing strategies also reflect procurement risk, with tariffs and import-cost volatility encouraging nearshoring and regional manufacturing where feasible, while large operators use standardized build templates to scale tag and reader rollouts across multi-site portfolios.
Competitive Landscape
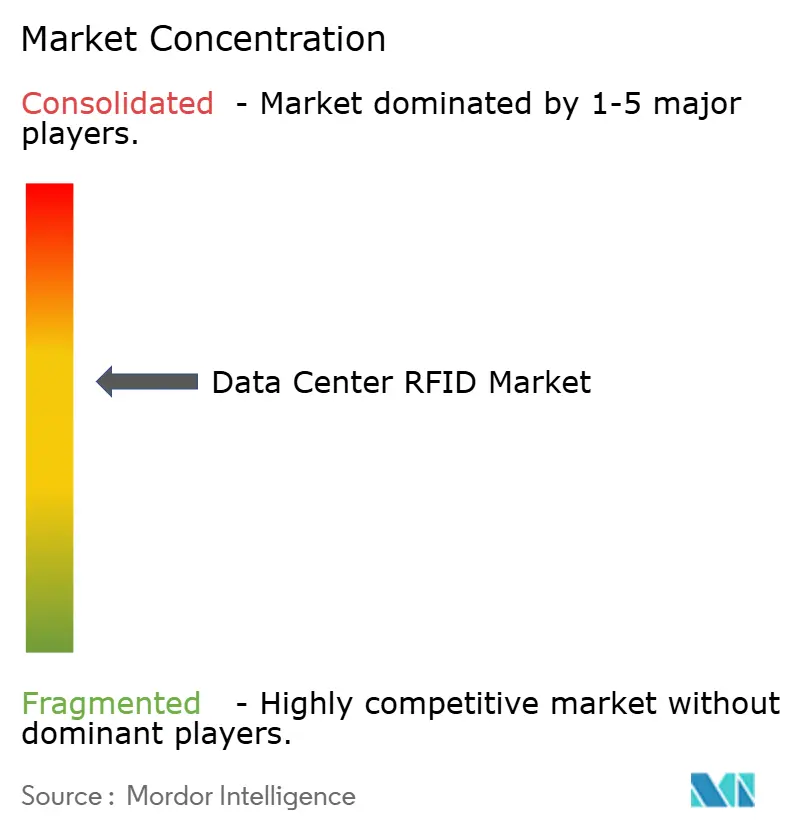
The market is moderately concentrated: the top five vendors account for roughly 65% of global revenue, granting mid-level bargaining power to buyers while leaving room for new entrants. RF Code anchors the active-tag niche via a 3 million-unit installed base linked to its CenterScape software, supplying hyperscalers like Vodafone that demand sub-meter accuracy. Zebra Technologies complements passive tagging with cloud analytics; its Asset Intelligence and Tracking unit recorded USD 462 million revenue in Q1 2025, up 18.4% year over year. Avery Dennison’s vertical factories in Mexico and U.S. guarantee supply resilience, an edge during recent semiconductor shortages.
Strategic alliances expand product scopes. Zebra and Merck’s M-Trust platform marries handheld readers with anti-counterfeiting features to secure pharmaceutical supply chains, a capability that has adjacent relevance in data-center spares management. Identiv and Novanta co-develop reader-inlay bundles for healthcare OEMs, illustrating a broader pivot toward turnkey offerings. Meanwhile, newcomers such as Acceliot leverage cloud-native architectures, boasting STARflex readers that operate in dense rack formations without performance drop-off. Their focus on AI-enabled analytics threatens incumbent software margins, spurring established firms to double down on predictive algorithms.
Capital markets fuel expansion. Vantage Data Centers secured USD 9.2 billion in equity to accelerate its build pipeline, automatically enlarging RFID hardware orders for each new hall . OEMs in reader, antenna, and middleware niches court these operators early to embed proprietary protocols before construction. As battery-free sensor innovations mature, the competitive field is expected to tilt toward vendors offering holistic energy-harvesting solutions. Continuous price erosion on tags ensures differentiation comes from software ecosystems, analytics, and integration depth, shaping future competitive moats in the data center RFID market.
Data Center RFID Industry Leaders
-
IBM Corporation
-
ZEBRA Technologies
-
Hewlett Packard Enterprise
-
GAO RFID
-
RF Code
- *Disclaimer: Major Players sorted in no particular order
Data Center RFID Market Companies Covered in this Report
- IBM Corporation
- Zebra Technologies Corp.
- Hewlett Packard Enterprise
- GAO RFID Inc.
- RF Code Inc.
- Alien Technology LLC
- Avery Dennison Corp.
- Omni-ID Ltd. (HID Global)
- Impinj Inc.
- NXP Semiconductors N.V.
- Honeywell International Inc.
- HID Global Corp.
- Vizinex RFID LLC
- InLogic Inc.
- Quanray Electronics Co. Ltd.
- SmartX Hub Inc.
- Invengo Information Tech. Co. Ltd.
- SATO Holdings Corp.
- Cisco Systems Inc.
- Johnson Controls (Cloudvue RFID)
- Tyco Integrated Security
Market Opportunities and Future Outlook
A key whitespace is shifting from basic tagging to always-on visibility, where passive tags paired with fixed readers and location software function as RTLS for racks, spares cages, and logistics areas. This connects to the operational reality of high-density AI infrastructure, where operators need to reconcile inventories continuously rather than through manual audits. When RFID events are pushed into DCIM and ITSM systems, the value moves beyond inventory toward workflow automation and compliance reporting. In that context, the RF Code partnership with Schneider Electric (EcoStruxure IT) underscores ongoing demand for turnkey integrations that connect physical asset identity and environmental signals to digital operations.
Sensor-centric RFID is also a nearer-term opportunity, particularly in metal-dense data-center environments where cabling and battery maintenance increase operational overhead. Powercast customizing a battery-free RFID sensor condition monitoring system for data centers, in collaboration with Asset Vue, points to active commercial activity around maintenance-free temperature and humidity monitoring on server racks. Standardization further supports adoption of streaming telemetry from RFID endpoints, and ISO/IEC 18000-65:2026 provides a clearer path for interoperable, continuous data capture that can be consumed by analytics and infrastructure management platforms without bespoke air-interface implementations.
Recent Industry Developments in Data Center RFID Market
- March 2026: GAO RFID implemented a hybrid BLE and RFID architecture for a multi-tenant data center operator to address rack-level asset visibility issues and reconcile audit discrepancies exceeding 12 percent. The development enhances integration with DCIM workflows and positions GAO RFID as a key connector between physical assets and IT management platforms. The change strengthens data-center asset visibility and audit accuracy.
- May 2025: Powercast announced customization of its battery-free RFID sensor system for data center equipment monitoring, following a collaboration with Asset Vue to enable maintenance-free humidity and temperature tracking on metal server racks. The battery-free sensing advances DCIM integration and reduces cabling and power draw, improving data-center visibility.
- April 2024: RF Code and Schneider Electric joined forces to integrate autonomous asset lifecycle and environmental monitoring hardware with Schneider Electric's EcoStruxure IT DCIM solution. The integration extends turnkey DCIM capabilities by linking physical asset tracking with virtual infrastructure management.
Data Center RFID Market Report Scope and Research Methodology
Market Definition and Coverage
This market covers spending on RFID solutions that are deployed inside data centers to identify, locate, and manage physical assets, as well as to support audits and operational workflows. It is measured in value terms and reflects deployments across different data center types.
Scope exclusions: We exclude general-purpose RFID used outside data center environments, even if the same hardware or software could be repurposed.
Segments Covered in This Report
- By Component
- Hardware (Tags, Readers, Antennas)
- Software and Middleware
- Services (Integration, Support)
- By Tag Type
- Passive
- Active
- By Data-Center Type
- Colocation
- Hyperscalers/Cloud Service Providers
- Enterprise and Edge
- By Application
- Asset Tracking and Inventory
- Environmental and Thermal Monitoring
- Security and Access Control
- Workflow Automation
- By Geography
- North America
- United States
- Canada
- Mexico
- South America
- Brazil
- Chile
- Argentina
- Rest of South America
- Europe
- United Kingdom
- Germany
- France
- Italy
- Spain
- Rest of Europe
- Asia-Pacific
- China
- Japan
- India
- Singapore
- Australia
- Malaysia
- Rest of Asia-Pacific
- Middle East
- United Arab Emirate
- Saudi Arabia
- Turkey
- Rest of Middle East
- Africa
- South Africa
- Nigeria
- Rest of Africa
- North America
Data Sources, Market Sizing, and Validation
Desk Research
Desk research was used to build the starting structure for the market model and to keep assumptions tied to observable data center activity. We relied on public sources such as Uptime Institute publications, International Telecommunication Union datasets, IEEE papers on RFID performance, and NIST guidance that influences data center identification and security practices.
To translate demand signals into a sizing view, we also reviewed data center capacity and build-out indicators from sources such as US Energy Information Administration releases, national statistics portals, and customs or trade datasets that help validate hardware movement patterns where relevant. Company filings, product documentation, investor presentations, and credible press were used to understand solution positioning and typical deployment contexts, which were then cross-checked with paid subscriptions for company financials and news intelligence, plus patent databases for technology direction. These desk sources are not exhaustive, and many additional publications and datasets were reviewed for data collection, validation, and clarification.
Primary Interviews and Surveys
Primary work was used to pressure-test the desk assumptions on how RFID is purchased, deployed, and refreshed in data centers, particularly where public data is thin. We spoke with a mix of data center operators, systems integrators, and RFID solution specialists across major regions. Inputs from those discussions were then used to triangulate adoption levels, typical tag mixes, and realistic pricing ranges by use case.
Distribution of primary research fieldwork respondents
| Company type | Respondent position | Region |
|---|---|---|
| Top tier: 29% | CXOs: 14% | APAC: 49% |
| Mid tier: 52% | Functional/Unit leaders: 28% | EMEA: 29% |
| Smaller Players: 19% | Managers: 58% | Americas: 22% |
Market-Sizing & Forecasting
Our sizing logic starts with a top-down build that reconstructs the demand pool from data center rollouts and the share of facilities that implement RFID for asset tracking, inventory, and workflow automation, which is then converted into value using typical deployment densities and pricing bands. To keep the totals grounded, the outputs are corroborated with selective bottom-up approximations such as sampled tag and reader volumes per site, channel checks on solution bundles, and supplier revenue cues where they are clearly attributable.
Key model inputs include the installed base and expansion pace of colocation, enterprise, and edge facilities, the intensity of asset movement and audit frequency, the mix of passive versus active tags (which changes bill-of-materials value), reader and antenna density by coverage needs, and the degree of software and middleware attachment (including DCIM integration) per deployment. When a data point cannot be obtained reliably, the gap is handled through a bounded range anchored to interview consensus, then tested for sensitivity before a single value is finalized.
For forecasting, scenario analysis is used because deployment timing is tied to build cycles, compliance activity, and refresh decisions that can shift with budgets. Growth paths are built by region using expected data center capacity additions and adoption lift by use case, and then the assumptions are re-checked with primary respondents before the final curve is locked.
Data Validation & Update Cycle
Validation is done through multiple checks so that unusual jumps are caught early and explained before sign-off. Model outputs are compared with independent signals such as data center build activity, reported deployment patterns, and observed pricing ranges, then variance checks are run across regions and components to spot inconsistencies.
If large gaps show up between what the model implies and what interviews indicate, we re-contact sources to understand whether the issue is a scope mismatch, a timing effect, or a pricing assumption that needs correction. Reports are refreshed annually, and interim updates are completed when material events shift demand or pricing, followed by a final analyst pass right before delivery so clients receive the latest updated view.
Mordor Intelligence's Data Center Rfid Market Sizing Compared With Other Published Estimates
Published market values for data center RFID often vary because the line between data-center-specific deployments and broader RFID spending is not drawn the same way each time. Differences also come from how firms treat software and middleware attach rates, what they assume for passive versus active tag mixes, and how often the underlying adoption and pricing inputs are refreshed.
The table shows a noticeable spread because some estimates lean on older base years and then extend growth using a single headline CAGR, which can miss shifts in data center build cycles and audit-driven adoption. The table points to one recurring gap: in Mordor Intelligence's model, the market includes both data center RFID hardware (tags, readers, antennas) and the related software and middleware tied to these deployments, while other sources may emphasize hardware-only definitions or use broader application buckets that are not always limited to data center environments.
Benchmark comparison
| Source | Market Size | Gaps in Research Methodology |
|---|---|---|
| Mordor Intelligence | USD 2.59 B (2026) | |
| Global Consultancy A | USD 1.00 B (2023) | Uses an earlier base year and a longer runway to 2032, with segmentation that includes monitoring and compliance themes that can be counted beyond RFID spend inside data centers. The approach can understate the impact of software and middleware attachment when results are communicated primarily through device categories. |
| Industry Publisher B | USD 0.94 B (2023) | Anchors the market to shipments and revenue tables by type, and then applies a high growth rate into 2030, which can amplify differences when tag mix and reader density assumptions are not validated by data center operators. Some application buckets span multiple verticals, which may blur what is strictly data center RFID demand. |
Taken together, the comparison suggests that base year choice and what is counted as a qualifying deployment explain most of the variance. By keeping inputs tied to data center adoption signals and component-level attachment logic, the final estimate stays transparent and repeatable even when public data is limited.
Key Questions Answered in the Report
What is the current size of the data center RFID market?
The data center RFID market is valued at USD 2.59 billion in 2026 and is projected to reach USD 4.65 billion by 2031.
Which component holds the largest share within the data center RFID market?
Hardware items such as tags, readers, and antennas lead with 55.12% revenue share because every deployment begins with physical tagging.
Why are hyperscale operators the largest adopters of RFID in data centers?
Hyperscale facilities manage millions of distributed assets, so they rely on RFID to maintain real-time visibility and comply with stringent audit requirements.
How fast is the Asia-Pacific region growing in the data center RFID market?
Asia-Pacific is currently expanding at a 15.21% CAGR, driven by large-scale investments in China, Japan, and India.
What technical hurdle most commonly limits RFID performance in dense server racks?
Metallic enclosures and high electromagnetic interference create RF shadows that reduce read accuracy, often requiring specialized antenna placement.
How does integrating RFID with DCIM platforms benefit data-center operators?
DCIM integration automates ticketing, thermal mapping, and predictive maintenance, allowing operators to cut labor costs and improve uptime.
- Data Center Power Market Power systems worldwide, split by component, tier and facility size.
- Data Center Server Market Servers worldwide, split by tier, facility size and facility type.
- Data Center Construction Market Construction across all regions, split by tier, facility size and facility type.
- South America Data Center SSD Market South America SSDs, split by form factor, interface and nand technology.
- Micro Mobile Data Center Market Micro mobile units worldwide, split by rack unit size, form factor and application.
- North America Containerized Data Center Market Modular builds demand across North America, covering container size, component module and tier.
- Brazil Data Center Storage Market Storage in Brazil, split by storage technology, storage type and end user.
- Europe Data Center GPU Market Europe's GPUs, split by deployment type, gpu type and interconnect.
- North America Data Center Networking Market Networking demand across North America, covering component, end-user and data-center type.
- South America Data Center Power Market South America's power systems, split by power infrastructure, end user and power capacity range.
- Data Center Managed Services Market Managed services across the global market, covering service type, deployment model and facility type.
- Europe Green Data Center Market Europe energy efficiency, split by component, facility type and tier.
- South Africa Data Center Storage Market Storage in South Africa, split by storage technology, storage type and facility type.