
Market Overview
| Study Period | 2020 - 2032 |
|---|---|
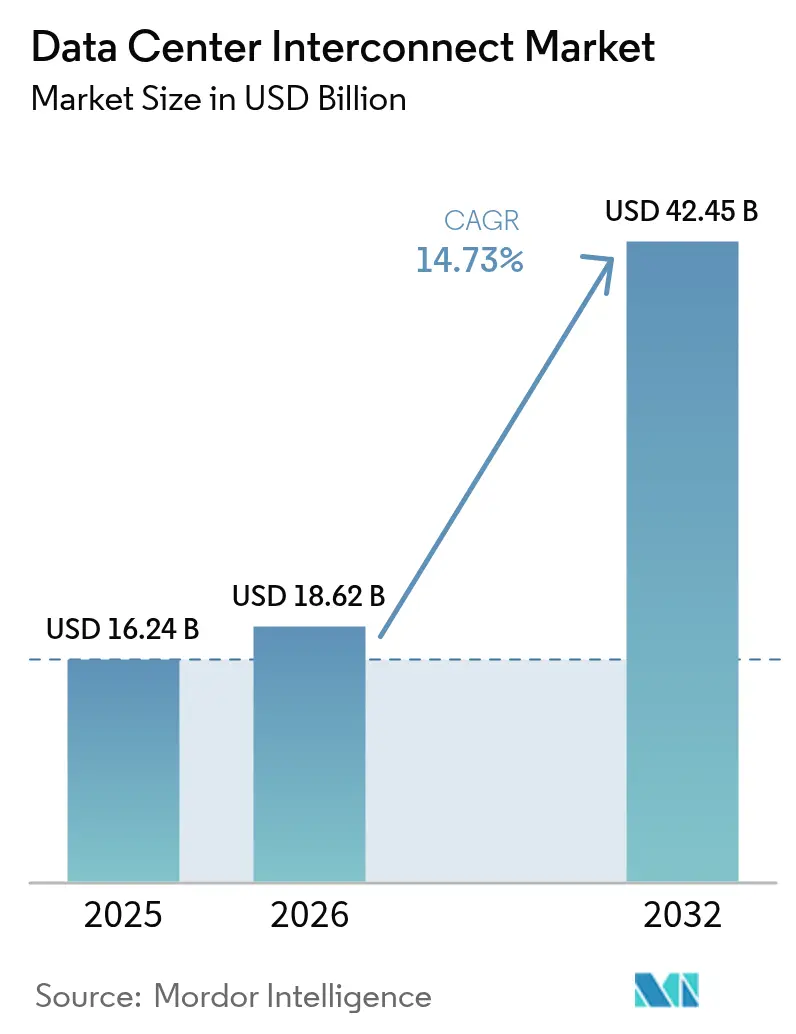
| Market Size (2026) | USD 18.62 Billion |
| Market Size (2032) | USD 42.45 Billion |
| Growth Rate (2026 - 2032) | 14.73% CAGR |
| Fastest Growing Market | Asia Pacific |
| Largest Market | North America |
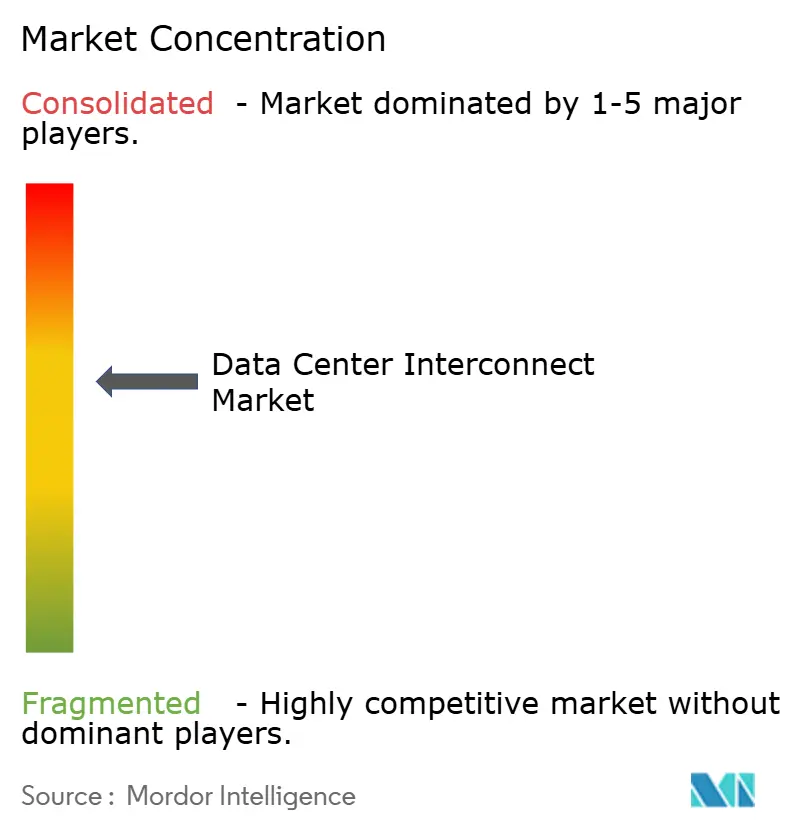
| Market Concentration | Medium |
Major Players *Disclaimer: Major Players sorted in no particular order Image © Mordor Intelligence. Reuse requires attribution under CC BY 4.0. | |
Data Center Interconnect Market Analysis by Mordor Intelligence
The data center interconnect market size was valued at USD 16.24 billion in 2025 and estimated to grow from USD 18.62 billion in 2026 to reach USD 42.45 billion by 2032, at a CAGR of 14.73% during the forecast period (2026-2032). Strong capital spending by hyperscale operators, the migration of artificial intelligence workloads that need ultra-high bandwidth, and expanding edge deployments are reshaping network-architecture priorities. Operators are moving away from monolithic enterprise links toward AI-optimized, low-latency fabrics built on coherent optics, photonic switching, and software-defined control. Near-term growth concentrates on metropolitan corridors where 400 Gbps and 800 Gbps links replace legacy 100 Gbps waves. Supply-side innovation in co-packaged optics and 1.6 Tbps coherent engines reinforces the long-run expansion outlook, while sustainability mandates spur adoption of energy-efficient switching and liquid-cooling–ready short-reach optics. Regional investment patterns remain heterogeneous: Asia-Pacific leads in capacity additions, North America dominates in R&D, and Europe scales green interconnect designs to satisfy carbon-neutral goals.
Key Report Takeaways
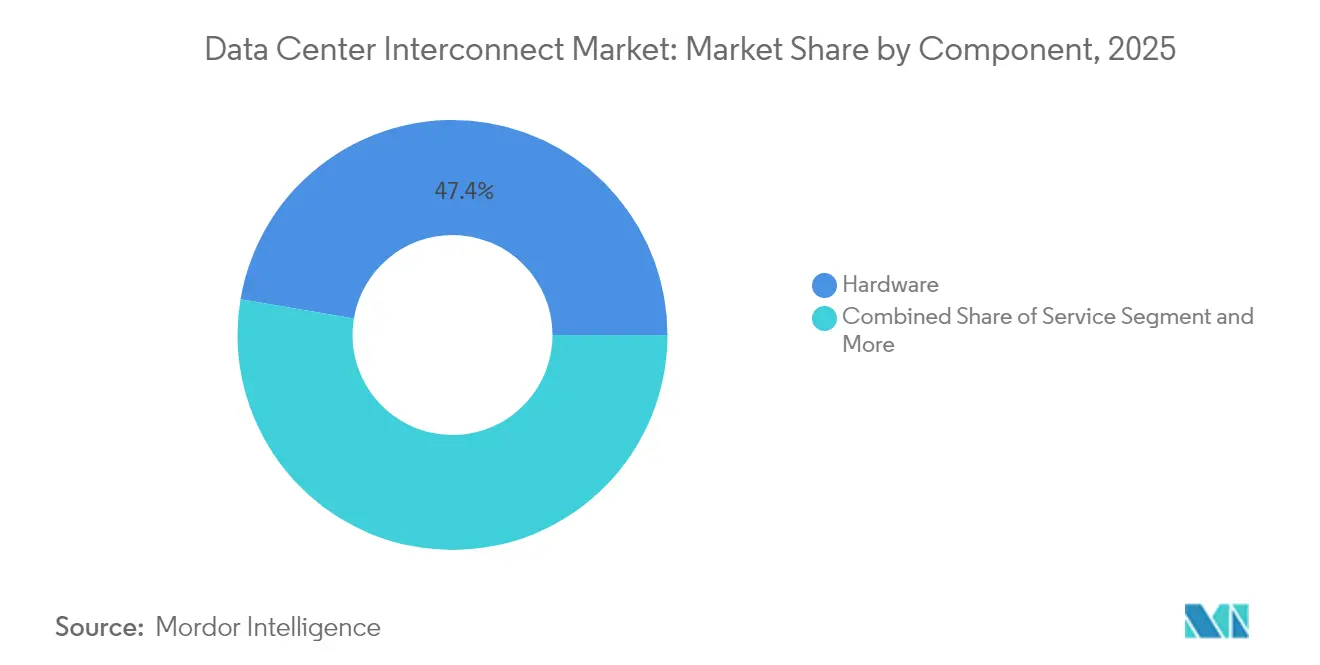
- By component, hardware accounted for a 47.35% slice of the data center interconnect market share in 2025; software-defined networking and control platforms are poised to post the fastest 16.12% CAGR through 2032.
- By connectivity type, short-haul links captured 60.25% of the data center interconnect market size in 2025, while long-haul connections are expected to grow at a 14.88% CAGR from 2026 to 2032.
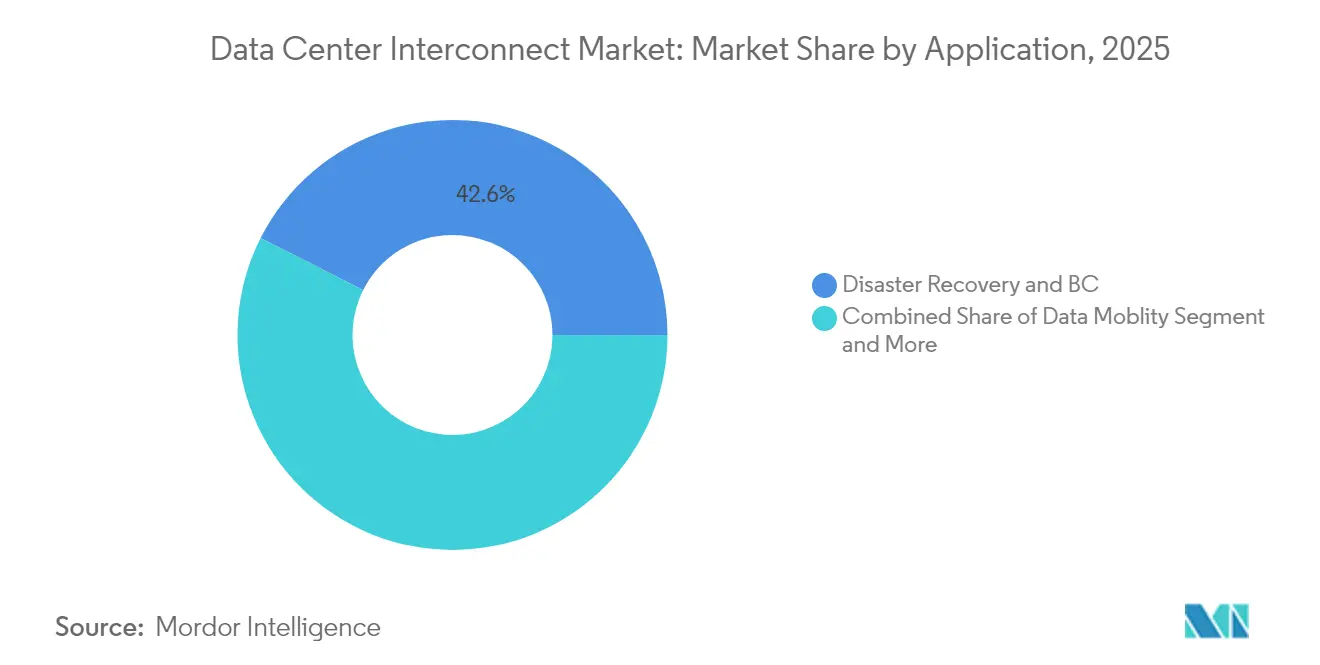
- By application, disaster recovery and business continuity represented 42.55% of 2025 revenue; data mobility is projected to expand at a 15.05% CAGR to 2032.
- By end-user industry, communication service providers held 58.25% of 2025 revenue, yet internet content and carrier-neutral providers will record a 14.66% CAGR over the outlook period.
Note: Market size and forecast figures in this report are generated using Mordor Intelligence’s proprietary estimation framework, updated with the latest available data and insights as of 2026.
Global Data Center Interconnect Market Trends and Insights
Drivers Impact Analysis*
| DRIVER | (~) % IMPACT ON CAGR FORECAST | GEOGRAPHIC RELEVANCE | IMPACT TIMELINE |
|---|---|---|---|
| Expanding edge and hyperscale data-center footprints | +2.8% | Global, led by North America and Asia-Pacific | Medium term (2-4 years) |
| Surge in AI/HPC traffic requiring greater than 400 Gbps links | +3.2% | North America, China, Western Europe | Short term (≤ 2 years) |
| Commercial 5G roll-outs accelerating low-latency backhaul demand | +1.9% | Asia-Pacific core, spill-over to Europe and North America | Medium term (2-4 years) |
| Campus liquid-cooling retrofits boosting short-reach optical spend | +1.1% | Global hyperscale markets | Short term (≤ 2 years) |
| Satellite ground-station colocation creating novel DCI nodes | +0.8% | Rural North America, Northern Europe, Australia | Long term (≥ 4 years) |
| Net-zero mandates driving adoption of photonic switching fabrics | +1.4% | Europe, California, select Asia-Pacific markets | Long term (≥ 4 years) |
| Source: Mordor Intelligence | |||
Expanding Edge and Hyperscale Data-Center Footprints
Hyperscale operators have earmarked USD 180 billion for distributed infrastructure that places compute close to users,[1]Vicor Team, “Defining Future Edge Computing Using Micro-Data Centers,” Vicor Corporation, vicorpower.comforcing interconnect designs to support dense mesh topologies rather than hub-and-spoke layouts. Amazon’s USD 100 billion expansion and Meta’s USD 65 billion program typify this shift. Edge micro-facilities, projected to grow at a 37.9% CAGR, require power-efficient short-reach optics paired with programmable routing that can rebalance traffic in real time. Carrier hotels now double as edge nodes where cloud, content, and network operators converge, adding fresh demand for multi-tenant intra-metro links.
Surge in AI/HPC Traffic Requiring greater than 400 Gbps Links
AI model training generates all-to-all traffic patterns that saturate legacy 100 Gbps networks. Optical module shipments for 400G/800G exceeded 20 million units in 2024,[2]Eliza Strickland, “A Crucial Optical Technology Has Finally Arrived,” IEEE Spectrum, spectrum.ieee.org underscoring aggressive migration timelines. NVIDIA’s 800G photonic switch roadmap and IEEE’s 800G Ethernet standard illustrate the ecosystem’s pivot to coherent optics that push toward 1.6 Tbps lanes. Photonic switching fabrics reduce hop counts and latency, enabling AI clusters to scale without the oversubscription penalties of electrical spine-leaf trees.
Commercial 5G Roll-outs Accelerating Low-Latency Backhaul Demand
5G radio access requires sub-5 ms round-trip latency, compelling operators to interconnect edge aggregation sites with core data centers using fiber paths under 20 km. Vapor IO and NVIDIA deployed an AI-enabled 5G edge in Las Vegas,[3]Staff Writers, “Vapor IO and NVIDIA Launch AI-Driven 5G Edge Deployment,” Edge Industry Review, edgeir.com illustrating the tight coupling between mobile edge compute and data center interconnect fabrics. Software-defined segmentation and dynamic bandwidth allocation ensure slices with strict QoS meet varying application profiles.
Campus Liquid-Cooling Retrofits Boosting Short-Reach Optical Spend
Liquid cooling allows higher rack densities, raising intra-facility bandwidth requirements. Each retrofit coincides with server refreshes where operators adopt 16-fiber MPO 400G optics to sustain east-west traffic caused by AI inference loads. Sustainability commitments, such as EdgeConneX’s plan for carbon-neutral operations by 2030, align with these thermal-and-optical upgrades.
Restraints Impact Analysis*
| RESTRAINTS | (~) % IMPACT ON CAGR FORECAST | GEOGRAPHIC RELEVANCE | IMPACT TIMELINE |
|---|---|---|---|
| High upfront cost of coherent optics and ROADMs | -1.8% | Global, notably emerging markets | Short term (≤ 2 years) |
| Multi-vendor interoperability and network-complexity issues | -1.2% | Global | Medium term (2-4 years) |
| Shortage of skilled fiber-construction labor | -2.1% | North America, Western Europe | Medium term (2-4 years) |
| Municipal permitting delays for metro-haul trenching | -0.9% | Urban centers worldwide | Long term (≥ 4 years) |
| Source: Mordor Intelligence | |||
High Upfront Cost of Coherent Optics and ROADMs
Advanced coherent engines and reconfigurable optical add-drop multiplexers (ROADMs) command premiums up to 300% over legacy gear, stretching capex budgets for mid-tier carriers. The ROADM market is projected at USD 1.2 billion by 2026, reflecting heavy investment needs. Operators in cost-sensitive regions postpone upgrades, reinforcing a two-tier global adoption pattern.
Shortage of Skilled Fiber-Construction Labor
Telecom build-outs face a workforce gap that the Semiconductor Industry Association estimates will need 1 million additional technicians by 2030. Wage inflation escalates metro trenching costs, and lengthy training cycles delay project completion. Rural deployments suffer the most severe constraints, slowing last-mile connectivity to edge zones.
*Our forecasts treat driver/restraint impacts as directional, not additive. The impact forecasts reflect baseline growth, mix effects, and variable interactions.
Segment Analysis
By Component: Software Orchestration Drives Next-Generation Architectures
Hardware held 47.35% of 2025 revenue as operators procured dense DWDM shelves and coherent transceivers that underpin the data center interconnect market. The software tier will post a 16.12% CAGR as controllers automate bandwidth pooling, latency steering, and failover. Vendors pursuing co-packaged optics blend silicon switching with embedded lasers, lowering power per bit and shrinking footprints. Services revenue grows in tandem, reflecting demand for design, integration, and lifecycle support.
The data center interconnect market size for hardware is forecast to rise alongside AI cluster roll-outs, yet programmable orchestration remains the strategic differentiator. Operators use open APIs to stitch multi-vendor optics into a single intent-based fabric, cutting provisioning cycles from weeks to hours.


By Connectivity Type: Long-Haul Growth Accelerates Inter-Regional Expansion
Short-haul links (< 80 km) delivered 60.25% of 2025 revenue because metro campuses, cloud on-ramps, and carrier hotels require dense east-west bandwidth. Long-haul systems will outpace with a 14.88% CAGR as hyperscalers pursue resilience across regions. The data center interconnect market size for long-haul will benefit from 1.6 Tbps coherent platforms that squeeze more capacity into existing fiber.
Projects such as the Medusa submarine cable add fresh routes linking Europe and Africa, creating new demand pools. Meanwhile, edge growth sustains short-haul volumes, ensuring balanced capex allocation between metro and backbone domains.
By Application: Data Mobility Emerges as Strategic Differentiator
Disaster recovery led 2025 spending with a 42.55% share as enterprises hardened business-continuity postures. Data mobility will grow fastest at 15.05% CAGR as AI models, databases, and container images move fluidly among clouds. The data center interconnect market share for mobility solutions rises because multi-cloud strategies rely on low-latency replication and object-storage shuttling.
Shared resource clustering supports HPC bursts while edge intelligence pushes models to inference nodes, raising temporal traffic peaks. Vendors offering bandwidth-on-demand and encryption at line rate stand to capture these latency-critical workflows.
By End-User Industry: ICPs/CNPs Drive Innovation Through Scale
Communication service providers retained 58.25% revenue in 2025, leveraging nationwide fiber footprints to monetize wholesale waves. Internet content and carrier-neutral providers will clock a 14.66% CAGR as hyperscale platforms and neutral colos race to add capacity. Government, research, and education demand remains stable as public agencies modernize legacy network backbones.
Hyperscalers vertically integrate optics—exemplified by Microsoft’s in-house transceiver program—to control cost and supply risk. Neutral colocation chains such as Equinix expand cross-connect marketplaces, reinforcing secular demand for vendor-agnostic interconnect fabrics.
Geography Analysis
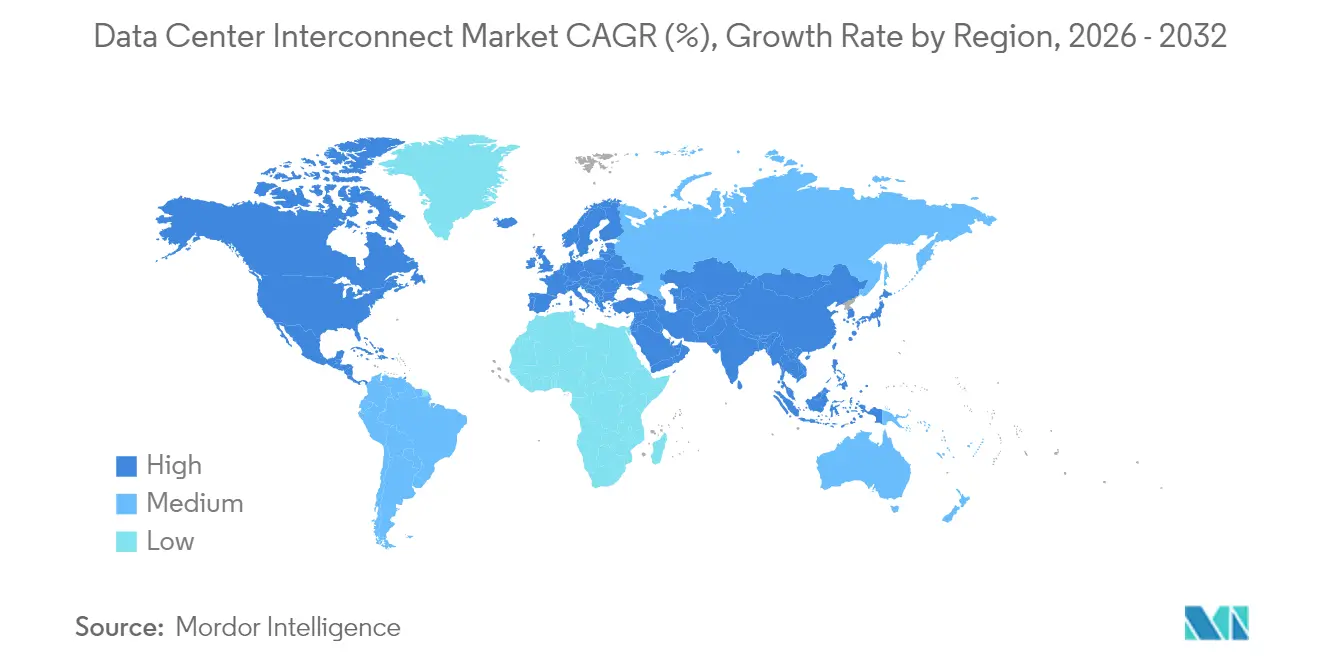
North America leads the data center interconnect market owing to concentrated hyperscale campuses, advanced fiber corridors, and an active open-source ecosystem. DE-CIX Dallas’s 400 GE upgrade highlights metro densification. U.S. projects spearhead photonic-switch adoption, aided by robust venture funding and favorable tax incentives.
Asia-Pacific is the fastest-growing region, with data-center capacity expected to triple by 2033 on the back of cloud adoption in China, Japan, India, and ASEAN markets. Domestic AI ambitions and 5G roll-outs accelerate both short-haul metro builds and cross-border long-haul corridors.
Europe balances sustainability rules and digital sovereignty objectives. Germany alone is projected to reach a USD 25.3 billion data-center valuation by 2029, purchasing high-efficiency optics to align with the EU’s carbon-neutral pledge. Submarine cables such as 2Africa improve resilience, supporting content exchange with Middle Eastern and African hubs.
Latin America is a rising investment theater; Brazil accounts for 40% of regional spend, and Brookfield’s search for an Ascenty partner underscores confidence in hyperscale growth. Mexico’s Querétaro cluster attracts cloud majors seeking sub-20 ms latency to U.S. markets.
The Middle East and Africa pursue sovereign AI and cloud initiatives. Gulf states deploy liquid-cooled campuses tied to solar plants, while terrestrial routes along the Red Sea and new cable landings in Kenya widen continental reach.

Regulatory Landscape
The data center interconnect (DCI) ecosystem is shaped more by telecom and optical-transport standards than by a single DCI-specific regulator, with compliance anchored to ITU-T and IEEE specifications that govern interoperability and physical-layer performance. ITU-T amendments such as G.709.5 (August 2024, FlexO short-reach interfaces through 800G) and G.959.1 (May 2025, updated WDM IrDI specifications) provide reference points for vendor design and cross-domain interworking, while industry implementation agreements like OIF 800ZR define 800G coherent interface requirements commonly used in amplified single-span DWDM DCI links.
Deployment pace is also influenced by policy and infrastructure governance, especially for metro and long-haul fiber builds that underpin DCI. In July 2025, the White House issued Executive Order 14318 to accelerate federal permitting for data center infrastructure, targeting permitting as a bottleneck for new corridors. At the global level, regulators at the ITU Global Symposium for Regulators (GSR-26) endorsed Best Practice Guidelines on May 15, 2026 focused on regulatory governance essentials for digital infrastructure, reinforcing cross-sector coordination themes that affect fiber siting, right-of-way processes, and multi-operator infrastructure planning.
Value Chain Analysis
The DCI value chain spans upstream optical and connectivity components (lasers, modulators, connectors, cabling, and silicon photonics), midstream system integration (coherent pluggables, DWDM line systems, packet-optical platforms, and switching/routing), and downstream deployment and operations by hyperscalers, internet content and carrier-neutral providers, and communication service providers. With 400G/800G becoming mainstream and 1.6T engines entering product cycles, equipment vendors such as Cisco, Nokia, and Ciena increasingly depend on component ecosystems and standards bodies for interoperability, while operators are putting more weight on software-defined control to automate provisioning, protection, and bandwidth-on-demand across metro and regional fabrics.
Recent supply-chain and deployment signals point to tighter coupling between physical connectivity and AI-oriented infrastructure expansion. Large-scale fiber and route-diversity builds feed the downstream capacity layer, exemplified by the Heartland Fiber Project launched in May 2026, a USD 700 million initiative to build 2,000 miles of high-capacity fiber across seven US states to support AI data center development. On the component and interconnect side, partnerships such as 3M and Microsoft (July 2026) around Expanded Beam Optical technology reflect efforts to improve density and reliability of optical connections within hyperscale environments, while operator and colo ecosystems (for example, Equinix partnering with Cisco and NVIDIA in June 2026 to extend Secure AI Factory capabilities across data centers) support distribution and adoption of standardized architectures across multiple sites.
Competitive Landscape
Competition remains moderate with ongoing consolidation. Nokia’s USD 2.3 billion Infinera acquisition marries coherent DSP silicon with global channel reach, intensifying the fight for end-to-end optical portfolios. Zayo’s USD 4.25 billion Crown Castle fiber deal bolsters metro presence in tier-2 U.S. cities.
Vendors differentiate through integrated hardware-software stacks, AI-driven network telemetry, and sustainability features. Startups targeting photonic switching or co-packaged optics disrupt the status quo by slashing cost per bit. Ecosystem alliances—such as Kyndryl with Cloudflare or Lumen with Google Cloud—bundle connectivity and managed services, deepening value capture.
Patent filings accelerate around multi-core fiber, quantum-safe encryption, and silicon photonics. Intellectual-property depth becomes a strategic shield as hyperscalers weigh in-house build versus buy decisions.
Data Center Interconnect Industry Leaders
Ciena Corp
Cisco Systems Inc
Juniper Networks Inc
Fujitsu Ltd
Microsemi Corporation
- *Disclaimer: Major Players sorted in no particular order

Market Opportunities and Future Outlook
A key whitespace area is the transition from conventional metro DCI toward AI-driven scale-across architectures that connect separate data center campuses into a single logical cluster over tens of miles. This shift is pushing demand for ultra-low-latency, high-capacity links and tighter integration between optical transport and switching fabrics. Commercial proof points include DriveNets reporting a July 2026 commercial deployment connecting two GPU clusters 52 miles apart at 111.2 Tbps with 0.9 ms latency, and Lightpaths expanding AI-grade fiber in July 2026 to serve two hyperscale campuses in Michigan and Wisconsin, cited as exceeding 1 GW each. These deployments raise requirements for coherent optics, operational automation, and deterministic performance across inter-datacenter routes, not only within a single facility.
Opportunities also concentrate around interoperable standards and validation ecosystems that reduce multi-vendor complexity at 800G and 1.6T, while making security a built-in capability of high-speed pluggables. The OIFs June 2026 work to establish MACsec support guidelines for 1.6T pluggables, along with public interoperability demonstrations such as Keysight and Broadcom's March 2026 Ultra Ethernet Consortium specification demo at 800GE (with Link Layer Retry and Credit-Based Flow Control), expands the toolchain for qualification and interop testing. In parallel, near-packaged optics and multi-source agreements, such as the July 2026 China NPO optical interconnect MSA launched with Huawei, Baidu, and partners, create space for suppliers and operators to standardize next-generation interconnect approaches while balancing power, rack space, and security requirements for AI-heavy traffic patterns.
Recent Industry Developments
- June 2026: HPE Juniper Networking began shipping the QFX5250-64OE-L, positioning a fully liquid-cooled switch architecture with 64 x 1.6 Tbps OSFP-RHS ports and 102.4 Tbps capacity for high-density data center and inter-datacenter fabrics. Shipping availability strengthens the supply side for 800G and 1.6T class designs and supports operators pushing liquid-cooling-ready network upgrades alongside AI cluster builds.
- May 2026: Lumen Technologies agreed to acquire Alkira, a cloud-native, carrier-agnostic networking platform, to accelerate cloud-to-cloud and east-west connectivity offerings that align with multi-site data center interconnect use cases. The deal tightens integration between on-demand connectivity control planes and underlying transport, helping service providers package DCI as a managed, multi-cloud capability.
- October 2024: Sify Technologies doubled national long-distance network capacity in India using Ciena technology, expanding the optical backbone that underpins inter-datacenter and cloud connectivity. The capacity upgrade supports higher-bandwidth enterprise and cloud traffic growth and reinforces the role of coherent optical platforms in scaling national DCI corridors.


Research Methodology Framework and Report Scope
Market Definition and Coverage
This market is measured as the revenue generated from solutions that connect two or more data centers over short and long distances, so data, workloads, and storage can move with low latency and high reliability.
Scope exclusions: It excludes general LAN switching inside a single data center campus and connectivity built only for end-user branch or WAN access that does not interconnect data centers.
Segmentation Overview
- by Component
- Hardware (DWDM, OTN, Packets)
- Software-Defined Networking and Control
- Services (Managed, Professional)
- by Connectivity Type
- Short-Haul
- Long-Haul
- by Application
- Disaster Recovery and Business Continuity
- Shared Data and Resource Clustering
- Data (Storage) Mobility
- Other Applications
- by End-user Industry
- Communication Service Providers (CSPs)
- Internet Content / Carrier-Neutral Providers (ICPs/CNPs)
- Government, Research and Education
- Other Verticals
- by Geography
- North America
- United States
- Canada
- Mexico
- South America
- Brazil
- Argentina
- Rest of South America
- Europe
- Germany
- United Kingdom
- France
- Russia
- Spain
- Italy
- Rest of Europe
- Asia-Pacific
- China
- Japan
- India
- South Korea
- Australia and New Zealand
- Rest of Asia-Pacific
- Middle East and Africa
- Middle East
- UAE
- Saudi Arabia
- Turkey
- Rest of Middle East
- Africa
- South Africa
- Nigeria
- Kenya
- Rest of Africa
- Middle East
- North America
Data Sources, Market Sizing, and Validation
Desk Research
Desk research was used to map the demand signals and the supply-side building blocks that sit behind DCI spending. We referenced public sources such as International Telecommunication Union (ITU) statistics, U.S. Federal Communications Commission (FCC) releases, OECD broadband and digital economy indicators, Eurostat ICT datasets, and IEA electricity and efficiency data to understand traffic growth, network readiness, and energy constraints.
To translate those signals into market inputs, we also reviewed company filings and earnings transcripts, investor presentations, reputable telecom and data center press, and technical publications and standards notes (for example, from IEEE and IETF). For calibration, we selectively used paid subscriptions for company financials and intelligence, news and financials, and patent databases to confirm product cycles and investment timing. The desk sources listed here are illustrative, and additional public and paid references were also used for data collection, validation, and clarification.
Primary Interviews and Surveys
Primary work focused on validating what is actually deployed for inter-data-center links and what gets counted as paid DCI spend. We interviewed and surveyed a mix of network operators, colocation and cloud-aligned data center stakeholders, system integrators, and component suppliers across APAC, EMEA, and the Americas. Their input was then used to tighten adoption rates, pricing direction, and upgrade timing assumptions.
Distribution of primary research fieldwork respondents
| Company type | Respondent position | Region |
|---|---|---|
| Top tier: 28% | CXOs: 12% | APAC: 45% |
| Mid tier: 56% | Functional/Unit leaders: 28% | EMEA: 31% |
| Smaller Players: 16% | Managers: 60% | Americas: 24% |
Market-Sizing & Forecasting
Sizing starts from a top-down build where network build-outs and traffic growth are reconstructed into a realistic DCI demand pool by region, and then converted to spend using a blended equipment and services mix. The totals are then checked with selective bottom-up approximations, such as sampled pricing times shipped volumes for key interfaces, plus channel checks on typical project sizes, which helps adjust for double counting and timing gaps.
In the model, we track indicators that show up repeatedly in DCI decisions, including hyperscale and colocation capacity additions, inter-data-center bandwidth upgrades (for example, shifts toward 400G and 800G links), fiber route availability in key metro corridors, mix changes between short-haul and long-haul connectivity, and typical refresh cycles tied to router and optical platform upgrades. When primary inputs indicate gaps in coverage for a segment, those gaps are handled using conservative penetration ranges anchored to the closest observable deployment pattern.
For forecasting, scenario analysis is used so the base case matches how operators and data center buyers plan multi-year upgrades. The scenarios are driven by expected traffic growth, capex intensity, and unit price progression, and they are reconciled back to what interviewees consider feasible given permitting, power availability, and supply lead times.
Data Validation & Update Cycle
Validation is done through multiple checks so the outputs stay tied to real-world market signals. We compare results against independent indicators like announced data center builds, network capex trends, and observed upgrade cycles, and then review large variances at regional and application levels before internal sign-off.
When a key assumption shifts, such as a major pricing reset for high-speed optics or a step change in build activity, the team re-contacts selected experts to confirm whether it is temporary noise or a durable change. Reports are refreshed annually, and interim updates are made for material events. Before delivery, an analyst completes a fresh review pass so clients receive the latest updated view.
Mordor Intelligence's Data Center Interconnect Market Sizing Compared With Other Published Estimates
Published market sizes for data center interconnect often do not match because the included revenue items can vary, and the starting year and exchange rate timing are not always aligned. The spread can also widen when one model assumes faster pricing declines for high-speed optics than another, or when recent upgrade activity is not fully captured.
Key gaps usually come from whether the estimate counts only inter-data-center connectivity equipment and related services, or whether it also folds in broader data center networking spend that is not strictly used to interconnect data centers. By checking bandwidth upgrade timing and refreshing blended ASP curves, Mordor Intelligence keeps the total linked to DCI deployments such as short-haul and long-haul interconnect links, rather than adjacent networking items that sit outside the market scope.
Benchmark comparison
| Source | Market Size | Gaps in Research Methodology |
|---|---|---|
| Mordor Intelligence | USD 18.62 B (2026) | |
| Industry Research Publisher A | USD 10.12 B (2024) | Uses an earlier base year and a smaller captured spend pool in practice, which can miss later-cycle 400G and 800G upgrade ramps that lift near-term revenue. |
| Industry Research Publisher B | USD 13.55 B (2024) | Reports a different start year and applies its own pricing and mix assumptions across equipment and services, which can shift the counted value when unit prices fall but bandwidth per link rises. |
The table shows that most of the difference is explained by base-year selection and by what gets included as DCI revenue versus adjacent networking spend. With scope rules and price-mix assumptions stated clearly, the final number can be traced back to upgrade cycles, capacity additions, and realistic unit price movement.


Key Questions Answered in the Report
What is the current size and growth rate of the data center interconnect market?
Global revenue reached USD 18.62 billion in 2026 and is projected to rise to USD 42.45 billion by 2032 on a 14.73% CAGR.
Which connectivity type is expanding fastest within data center interconnect solutions?
Long-haul (? 80 km) links are forecast to grow at a 14.88% CAGR between 2026-2032, outpacing short-haul deployments.
How are AI and HPC workloads shaping future interconnect investments?
Training clusters that need 400 Gbps 800 Gbps bandwidth are pushing operators to adopt coherent optics, photonic switching, and software-defined control for low-latency performance.
Why do communication service providers remain the largest customer group?
They own wide fiber footprints and wholesale wave services, enabling them to capture 58.25% of 2025 revenue even as content and carrier-neutral providers scale quickly.
Which region is recording the fastest capacity growth?
Asia-Pacific, where total data-center capacity is set to triple by 2033 on the back of cloud adoption in China, Japan, India, and Southeast Asia.
What technologies are vendors deploying to cut power consumption in data center links?
Co-packaged optics and photonic switching eliminate multiple electrical stages, lowering energy per bit and helping operators meet net-zero targets.
Page last updated on:






