| Study Period | 2018 - 2030 |
| Base Year For Estimation | 2024 |
| Forecast Data Period | 2025 - 2030 |
| Market Volume (2025) | 59.58 Thousand MW |
| Market Volume (2030) | 93.94 Thousand MW |
| CAGR | 9.54 % |
| Market Concentration | Low |
Major Players*Disclaimer: Major Players sorted in no particular order |

Data Center Market Analysis
The Data Center Market size is estimated at 59.58 thousand MW in 2025, and is expected to reach 93.94 thousand MW by 2030, growing at a CAGR of 9.54%. Further, the market is expected to generate colocation revenue of USD 69,632.5 Million in 2025 and is projected to reach USD 132,660.7 Million by 2030, growing at a CAGR of 13.76% during the forecast period (2025-2030).
The data center industry is undergoing a significant transformation driven by sustainability initiatives and renewable energy adoption. Major operators are increasingly focusing on green energy solutions to power their facilities, with the United States targeting renewable energy to contribute 50% of the energy mix by 2030, up from the current 20%. Data center operators are implementing innovative cooling technologies, energy-efficient systems, and sustainable building practices to reduce their environmental footprint. Leading providers are investing in on-site renewable energy generation, power purchase agreements with renewable energy suppliers, and advanced energy management systems to optimize power usage effectiveness.
The technological landscape of data center infrastructure continues to evolve with the adoption of advanced infrastructure solutions and emerging technologies. According to recent industry data, approximately 74% of US infrastructure decision-makers are implementing containers within Platform-as-a-Service environments, highlighting the shift toward more flexible and scalable architectures. The demand for 'Everything as a Service' (XaaS) solutions has shown remarkable growth, increasing by 42% year-over-year in the first half of 2022. This transformation is driving data center growth as facilities upgrade their infrastructure to support high-density computing, artificial intelligence workloads, and edge computing requirements.
Market concentration patterns reveal strategic positioning in key metropolitan areas, with established hubs continuing to dominate while new locations emerge. Northern Virginia remains the largest data center hotspot in the United States, accounting for 13.07% of the country's installed capacity in 2022. The market demonstrates interesting pricing dynamics across major European hubs, with significant variations in land costs London commands premium prices at USD 150 per square foot, while Amsterdam offers more competitive rates at USD 38 per square foot. These price differentials are influencing investment decisions and driving the emergence of new data center locations.
Investment patterns in the global data center market reflect a focus on strategic expansion and technological advancement. Major operators are investing in next-generation facilities equipped with advanced cooling systems, automated infrastructure management, and enhanced security features. The industry is witnessing increased investment in edge computing facilities to support growing demands for low-latency applications and distributed computing architectures. Sydney's transition to 100% renewable electricity for data centers and Melbourne's USD 95 million investment in AI startup development exemplify the growing intersection between digital infrastructure and technological innovation. These investments are accompanied by the development of comprehensive digital ecosystems, including improved connectivity infrastructure and enhanced power distribution networks.
Global Data Center Market Trends
Rising data consumption, growing number of digitalization applications, such as smart services, social networking, cashless payments, smart home automation services, and other applications drive the market's growth
- Global data consumption increased from 1.8 GB/month in 2016 to 7.6 GB/month in 2022. It is estimated to reach 26 GB/month by 2029. The growing number of digitalization applications, such as smart services, social networking, cashless payments, smart home automation services, and others, has boosted data consumption globally. A few countries, such as China and the United States, have already implemented 6G, while multiple countries are still implementing phases of 5G.
- However, in Africa, the deployment has been slow as the region plans to strengthen its 4G services first and then roll out 5G. The growing demand for online streaming services such as Netflix, Disney+, and Amazon Prime is boosting the consumption of data among users. The data consumed per smartphone increased from 1.8 GB/month in 2016 to 9.1 GB/month in 2023, which may reach 26 GB/month by 2029.
- Global data consumption is expected to grow further during the forecast period, reaching 19.2%. The leading regions in terms of data consumption are Africa, North America, and the Middle East, with 25.8%, 24.6%, and 23.9%, respectively. The increasing data consumption due to high bandwidth speeds and the growing adoption of digitalization services and IoT platforms may boost the demand for data centers globally.

Understand The Key Trends Shaping This Market
Download PDF
Growing digitalization services such as online shopping, social networking, cab booking, digital transactions, food orders, and other services are expected to drive the market demand
- The global population was estimated at 7.91 billion in 2022, with 4.95 billion internet users and 4.62 billion active social media users. On average, global users spend around 6 hours using the internet daily. The number of users is expected to record a CAGR of 4.6% during the forecast period (2023-2029). Growing digitalization services such as online shopping, social networking, cab booking, digital transactions, food orders, and other services are expected to increase data consumption. The data consumption is expected to grow by 18.6% during the forecast period. The regions with more than 90% internet users include North America and Northern and Western Europe.
- However, Asia-Pacific leads globally in terms of the number of smartphone users. The number of smartphone users was estimated at 2,647 million in 2022, which may reach 4,456 million by 2029. The region is estimated to record a CAGR of 7.5% in terms of the number of smartphone users during the forecast period. The deployment of 5G has helped users gain access to multiple digitalization services in the region.
- The United Arab Emirates, South Korea, China, and the Netherlands are the leading countries globally, with internet speeds of 136.4 Mbps, 106.9 Mbps, 96.3 Mbps, and 94.9 Mbps, respectively. The implementation of advanced technologies in telecommunication and smart devices and the growing number of people using digitalization services are expected to drive the growth of the global data center market in the future.

OTHER KEY INDUSTRY TRENDS COVERED IN THE REPORT
- Quick adoption of 5G network and deployment of 6G in developed nations, and increasing average download speeds of both 4G anf 5G services drives the market growth
- The growing demand for home automation services, streaming content, and online gaming may increase data consumption, thus boosting the demand for data centers globally.
- The growing demand for smart devices such as televisions, tablets, lighting, and their digital applications is boosting the global demand for fiber optic cables.
Segment Analysis: Data Center Size
Mega Segment in Data Center Market
The mega data center size segment dominates the global data center market segmentation, holding approximately 33% market share in 2024, with an IT load capacity of around 15,152 MW. These facilities, containing more than 15,000 servers and spread across large areas, are primarily concentrated in the United States and Canada, with North America accounting for over 30% of the mega data center deployments. The power capacity of these facilities ranges from 10 MW to 100 MW, enabling organizations to access large amounts of internet and industrial internet data at high speed and bandwidth. Asia is expected to account for nearly 36% of the market, while Europe may account for approximately 18% during the forecast period, driven by the growing usage of cloud services for data storage and the increasing adoption of digital transformation initiatives across these regions.
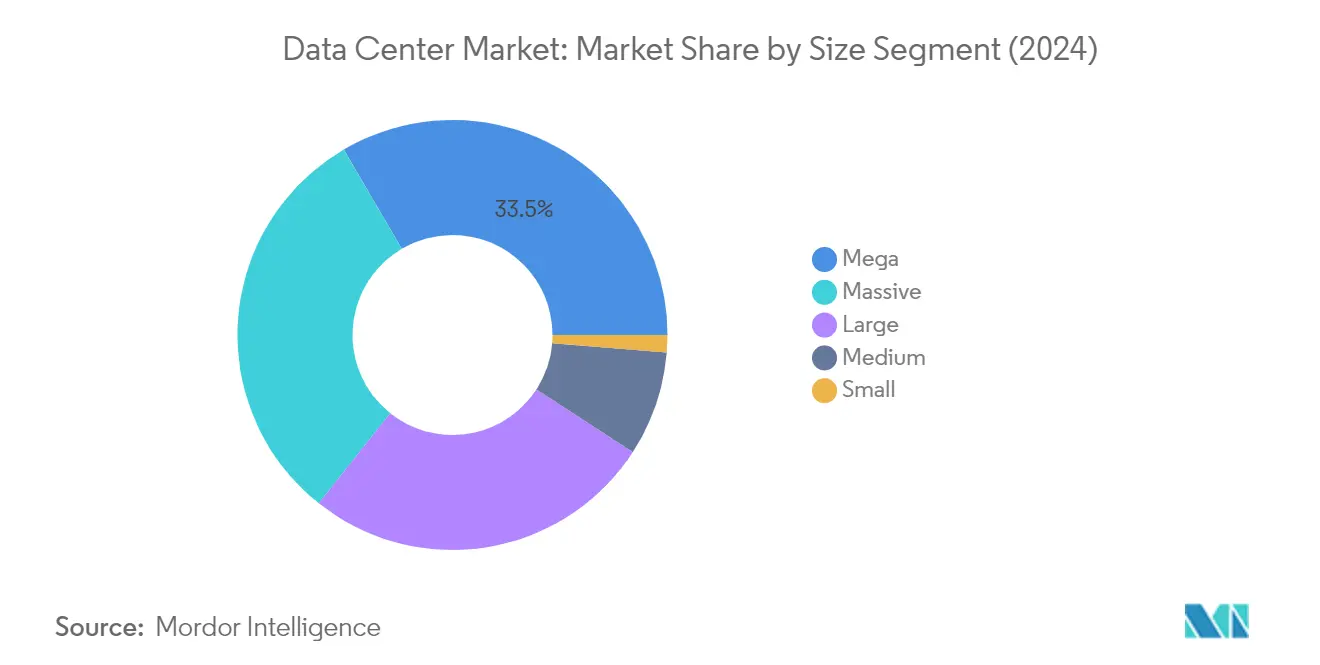
Massive Segment in Data Center Market
The massive data center size segment represents the second-fastest growing segment in the market, projected to grow at approximately 10% during 2024-2029. This growth is primarily driven by the increasing usage of hyperscale facilities and cloud services across various regions. The segment's expansion is particularly notable in regions like North America, where the United States contributes more than 85% of massive data center deployments. The growth is further supported by major operators like Digital Realty Trust Inc. and DataBank, who continue to invest in massive data center facilities. The segment is witnessing significant developments in Europe and Asia-Pacific regions, with providers focusing on expanding their massive data center footprint to meet the rising demand for cloud computing and digital services.
Remaining Segments in Data Center Size Market
The large, medium, and small data center segments each serve distinct market needs and continue to play crucial roles in the overall data center infrastructure. The large segment caters to enterprises requiring substantial computing power but not at the scale of mega or massive facilities. Medium-sized data centers are particularly prevalent in developing economies, offering a balanced approach to data center deployment with more manageable operational costs. The small segment primarily serves local businesses and organizations with modest data processing needs, providing cost-effective solutions for companies that don't require extensive infrastructure. These segments collectively offer a diverse range of options for businesses of varying sizes and requirements, contributing to the market's overall growth and development.
Segment Analysis: Tier Type
Tier 3 Segment in Data Center Market
The Tier 3 segment dominates the global data center services market, holding approximately 63% market share in 2024. This significant market position is driven by the segment's comprehensive redundancy capabilities and high availability, with facilities designed to have no more than 1.6 hours of unplanned downtime per annum. Europe leads the market with substantial Tier 3 certified facilities, particularly in the United Kingdom where Slough and Greater London comprise major shares. The segment's growth is further supported by growing urbanization and greater digital penetration in emerging markets such as India and Indonesia. In India, there are around 692 million active internet users, while Indonesian banks have consistently increased their data center budgets annually, particularly focusing on Tier 3 facilities to support their expanding e-commerce sector.
Tier 4 Segment in Data Center Market
The Tier 4 segment is experiencing the most rapid growth in the data center colocation market, projected to grow at approximately 16% CAGR from 2024 to 2029. This remarkable growth is primarily driven by the segment's superior uptime guarantee of 99.995% per year, translating to less than 0.5 hours of downtime annually. The growth is particularly strong in regions with robust submarine cable deployments, which are boosting hyperscale colocation growth. The increasing adoption of cloud and digital services among regional end-user industries is expanding the scope of the B2B cloud computing service market, which in turn is boosting opportunities for Tier 4 hosting with hyperscale construction. The segment's growth is further supported by the rising demand for fault tolerance and complete redundancy for every component.
Remaining Segments in Tier Type
The Tier 1 and 2 segment represents the basic level of data center infrastructure, offering single paths for power and cooling with few redundant and backup components. These tiers primarily cater to small and medium enterprises with minimal IT load requirements and basic uptime needs. While this segment maintains a presence in the market, particularly in developing regions and for organizations with less critical operations, it sees minimal growth compared to higher tiers. The segment's role remains important for businesses requiring cost-effective solutions without the need for advanced redundancy and uptime guarantees, though the market increasingly favors higher tier classifications for more critical operations.
Segment Analysis: Absorption
Utilized Segment in Data Center Market
The utilized segment dominates the global data center market, accounting for approximately 77% of the total IT load capacity in 2024. This segment is also experiencing the strongest growth trajectory, expected to grow at nearly 12% during 2024-2029. The robust growth is primarily driven by increasing cloud adoption, with major hyperscale providers expanding their footprint across key digital markets in Europe and North America. Growing urbanization and greater digital penetration in emerging markets such as India, Vietnam, and Indonesia are also fueling the segment's expansion. The segment benefits from strategic discounts, with approximately 10% reduction in costs available for larger hyperscale cloud providers and enterprise users in the United States. The increasing trend toward renewable energy adoption is becoming a key focus area, exemplified by initiatives like Sweden's 'Node Pole' data center located near the North Pole, which leverages free cooling and hydroelectric power for green data center operations. The segment's growth is further supported by the rising utilization rates, which are expected to reach 81.1% by 2029, reflecting the increasing demand for data center services across various industries.
Non-Utilized Segment in Data Center Market
The non-utilized segment represents the available capacity in data centers that remains unused or reserved for future expansion. This segment plays a crucial role in ensuring data centers maintain sufficient headroom for unexpected demand spikes and future growth requirements. The segment is characterized by strategic capacity planning, where operators maintain a balance between current utilization and future scalability needs. Data center operators typically maintain this buffer capacity to accommodate rapid deployment requirements from hyperscale customers and enterprise clients. The segment is influenced by factors such as regional market maturity, local demand patterns, and infrastructure readiness. Private equity funds are actively promoting new data center projects across various regions, particularly in previously under-served markets including Poland, Spain, Portugal, and Italy. The segment also reflects the industry's focus on sustainable growth, with operators carefully managing their expansion plans to align with actual market demand while maintaining operational efficiency.
Data Center Market Geography Segment Analysis
Data Center Market in United States
The United States continues to maintain its position as the global leader in the data center markets, commanding approximately 35% of the global data center capacity in 2024. The country's dominance is particularly evident in Northern Virginia, which has emerged as the largest data center hotspot, leveraging its densely packed fiber backbones and strategic location. The market's strength is further reinforced by comprehensive tax benefits, with the American Society of Professional Estimators attributing 82-85% of initial capital investment to these advantages. The United States demonstrates remarkable infrastructure readiness, with tax exemptions for qualifying computer equipment purchases by data centers meeting statutory investment and employment requirements. Virginia's pioneering move to extend sales tax exemption benefits to data center colocation tenants has set a precedent for other states. The country's data center landscape is characterized by robust connectivity infrastructure, with Virginia Beach serving as the landing point for four new transoceanic fiber connection cables, enhancing international connectivity capabilities.
Data Center Market in United Arab Emirates
The United Arab Emirates is experiencing unprecedented growth in its data center sector, with a projected CAGR of approximately 15% from 2024 to 2029. The country's emergence as a digital infrastructure hub is supported by its comprehensive regulatory framework, including the establishment of the Office of Data Protection in 2017 and subsequent amendments aligned with global standards. The UAE's commitment to digital transformation is evident through its robust certification ecosystem, encompassing ANSI/TIA-942, ISO/IEC-24762, and various other international standards. The country's strategic approach to data center development is further enhanced by its Special Economic Zones (SEZs) framework, allowing each Emirate to open sectors deemed strategic for diversification. The UAE's data center landscape benefits from significant foreign investment opportunities, with 100% foreign ownership permitted and long-term renewable land access leases. The country's positioning as a regional tech hub is strengthened by complete exemption from taxes, customs, and commercial levies, making it an attractive destination for global data center colocation operators.
Data Center Market in China
China has established itself as a powerhouse in the global data center landscape, particularly notable for its computing capabilities and infrastructure development. The country's data center sector is characterized by its strong focus on technological advancement and innovation, with significant investments in hyperscale facilities. China's approach to data center development is closely aligned with its national digital transformation agenda, emphasizing sustainable growth and energy efficiency. The market benefits from comprehensive government support through various initiatives and policies designed to promote digital infrastructure development. The country's data center ecosystem is particularly strong in major metropolitan areas, with strategic deployments across different regions to ensure optimal coverage and performance. China's commitment to technological sovereignty has led to the development of advanced facilities capable of supporting the growing demands of its digital economy. The market is further strengthened by robust connectivity infrastructure and a growing emphasis on green energy solutions for data center operations.
Data Center Market in United Kingdom
The United Kingdom maintains its position as a crucial European data center hub, with London serving as a primary focus for infrastructure development. The country's data center landscape is characterized by its sophisticated infrastructure and strategic importance in the FLAP-D (Frankfurt, London/Slough, Amsterdam, Paris, Dublin) metro markets. Despite higher land costs in London, averaging around USD 150 per square foot, the market continues to attract significant investments due to its robust connectivity infrastructure and mature digital ecosystem. The UK's data center sector benefits from advanced technological capabilities and a strong emphasis on sustainability, with many facilities transitioning to renewable energy sources. The market is supported by a comprehensive regulatory framework and strong data protection standards, making it attractive to global operators. The country's data center infrastructure is particularly notable for its high-speed connectivity options and diverse range of colocation services, catering to various business requirements and technological needs.
Data Center Market in Other Countries
The global data center landscape extends well beyond the major markets, with significant developments across various regions. Countries like Germany, France, Singapore, and Japan have established themselves as important regional hubs, each offering unique advantages and specializations. Emerging markets in countries such as India, Indonesia, and Brazil are experiencing rapid growth, driven by increasing digital adoption and favorable government policies. The Nordic region, including countries like Norway and Sweden, is gaining prominence due to its natural cooling advantages and renewable energy availability. Countries in the Middle East, such as Saudi Arabia and Qatar, are making substantial investments in digital infrastructure, while nations like South Korea and Australia are focusing on technological innovation and sustainability. Each market brings its own set of advantages, whether it's Ireland's favorable business environment, Singapore's strategic location, or Malaysia's growing digital economy, contributing to the diverse and dynamic global data center ecosystem.
Get Analysis on Important Geographic Markets
Download PDF
Data Center Industry Overview
Top Companies in Data Center Market
The data center market is characterized by continuous innovation in data center infrastructure design, cooling technologies, and energy efficiency solutions. Leading companies are focusing on expanding their geographical footprint through greenfield developments and strategic acquisitions, particularly in emerging markets across Asia-Pacific and the Middle East. Operational excellence is being achieved through automation, AI-driven management systems, and enhanced connectivity solutions like software-defined networking. Companies are increasingly emphasizing sustainability initiatives, with many providers committing to carbon-neutral operations and renewable energy adoption. The industry is witnessing significant investment in edge computing capabilities, hyperscale facilities, and enhanced security measures to meet evolving customer demands. Strategic partnerships with cloud colocation service providers, telecommunications companies, and technology vendors are becoming increasingly important for market expansion and service diversification.
Market Consolidation Drives Industry Evolution Pattern
The data center market exhibits a mix of global conglomerates and specialized regional players, with major operators maintaining significant presence across multiple continents. Global players like Digital Realty Trust, Equinix, and CyrusOne dominate the market through their extensive infrastructure networks and comprehensive service portfolios. The industry is experiencing ongoing consolidation through mergers and acquisitions, as larger players seek to expand their geographic reach and technical capabilities. Private equity firms are increasingly active in the market, funding both established providers and emerging players, particularly in underserved markets and regions with high growth potential.
The market structure is characterized by high barriers to entry due to substantial capital requirements and technical expertise needed for facility development and operation. Regional specialists are maintaining competitive positions by focusing on specific geographic markets or specialized service offerings. Strategic partnerships between local and global players are becoming more common, allowing for rapid market entry and expansion while leveraging local expertise and relationships. The industry is seeing increased participation from telecommunications companies and cloud providers who are either developing their own facilities or forming strategic alliances with established data center colocation companies.
Innovation and Sustainability Drive Future Success
Success in the data center market increasingly depends on providers' ability to deliver innovative data center services while maintaining operational efficiency and sustainability. Incumbent providers must focus on modernizing existing facilities with advanced cooling systems, renewable energy integration, and automated management platforms to maintain their competitive edge. The ability to offer flexible, scalable solutions that accommodate varying customer requirements, from edge computing to hyperscale deployments, is becoming crucial. Companies need to develop strong relationships with cloud service providers and enterprise customers while expanding their service offerings beyond traditional colocation to include interconnection, cloud connectivity, and managed services.
Market contenders can gain ground by focusing on underserved markets and specialized service offerings that address specific industry needs. Success factors include developing expertise in emerging technologies like AI infrastructure and edge computing, while maintaining strong local market knowledge and relationships. Regulatory compliance, particularly regarding data sovereignty and environmental standards, is becoming increasingly important for market participation. Companies must also address the growing demand for sustainable operations and energy efficiency, as these factors increasingly influence customer decisions. The ability to provide comprehensive security solutions and maintain high reliability standards while managing costs will remain critical for both established players and new entrants. The integration of digital infrastructure and enterprise colocation solutions will further enhance competitive positioning.
Data Center Market Leaders
-
CyrusOne Inc.
-
Cyxtera Technologies
-
Digital Realty Trust Inc.
-
Equinix Inc.
-
NTT Ltd
- *Disclaimer: Major Players sorted in no particular order

Need More Details on Market Players and Competiters?
Download PDF
Data Center Market News
- January 2023: CyrusOne acquired an office complex in Frankfurt, Germany, and plans to turn it into a data center campus. The investment group Corum had sold the Europark office complex in Frankfurt for EUR 95 million (USD 102.3 million) before confirming that CyrusOne was the buyer.
- December 2022: With a USD 160 million data center investment in Johannesburg, Equinix Inc., a digital infrastructure provider, wants to expand its presence on the African continent beyond its current locations in Nigeria, Ghana, and Côte d'Ivoire. In mid-2024, the brand-new data center is anticipated to open in South Africa; JN1, a new 4.0 MW data center, will offer more than 20,000 gross square feet of colocation space and 690+ cabinets. Also, there will be two further phases of development. The fully completed 20.0 MW retail complex will offer more than 100,000 gross square feet of colocation space and 3,450+ cabinets.
- December 2022: HGC Global Communications established an agreement with Digital Realty to boost customers’ edge connectivity. Under the agreement, Digital Realty will use edgeX by HGC services for over-the-top (OTT) customers in its three Singapore data centers.
Free With This Report
We provide a complimentary and exhaustive set of data points on the country and regional level metrics that present the fundamental structure of the industry. Presented in the form of 50+ free charts, the sections cover difficult to find data on various countries on smartphone users, data traffic per smartphone, mobile and broadband data speed, fiber connectivity network, and submarine cables.


Data Center Market Report - Table of Contents
1. EXECUTIVE SUMMARY & KEY FINDINGS
2. REPORT OFFERS
3. INTRODUCTION
- 3.1 Study Assumptions & Market Definition
- 3.2 Scope of the Study
- 3.3 Research Methodology
4. MARKET OUTLOOK
- 4.1 It Load Capacity
- 4.2 Raised Floor Space
- 4.3 Colocation Revenue
- 4.4 Installed Racks
- 4.5 Rack Space Utilization
- 4.6 Submarine Cable
5. Key Industry Trends
- 5.1 Smartphone Users
- 5.2 Data Traffic Per Smartphone
- 5.3 Mobile Data Speed
- 5.4 Broadband Data Speed
- 5.5 Fiber Connectivity Network
-
5.6 Regulatory Framework
- 5.6.1 Australia
- 5.6.2 Austria
- 5.6.3 Belgium
- 5.6.4 Brazil
- 5.6.5 Canada
- 5.6.6 Chile
- 5.6.7 China
- 5.6.8 Denmark
- 5.6.9 France
- 5.6.10 Germany
- 5.6.11 Hong Kong
- 5.6.12 India
- 5.6.13 Indonesia
- 5.6.14 Ireland
- 5.6.15 Israel
- 5.6.16 Italy
- 5.6.17 Japan
- 5.6.18 Malaysia
- 5.6.19 Mexico
- 5.6.20 Netherlands
- 5.6.21 New Zealand
- 5.6.22 Nigeria
- 5.6.23 Norway
- 5.6.24 Philippines
- 5.6.25 Poland
- 5.6.26 Russia
- 5.6.27 Saudi Arabia
- 5.6.28 Singapore
- 5.6.29 South Africa
- 5.6.30 South Korea
- 5.6.31 Spain
- 5.6.32 Sweden
- 5.6.33 Switzerland
- 5.6.34 Taiwan
- 5.6.35 Thailand
- 5.6.36 United Arab Emirates
- 5.6.37 United Kingdom
- 5.6.38 United States
- 5.6.39 Vietnam
- 5.7 Value Chain & Distribution Channel Analysis
6. MARKET SEGMENTATION (INCLUDES MARKET SIZE IN VOLUME, FORECASTS UP TO 2030 AND ANALYSIS OF GROWTH PROSPECTS)
-
6.1 Data Center Size
- 6.1.1 Large
- 6.1.2 Massive
- 6.1.3 Medium
- 6.1.4 Mega
- 6.1.5 Small
-
6.2 Tier Type
- 6.2.1 Tier 1 and 2
- 6.2.2 Tier 3
- 6.2.3 Tier 4
-
6.3 Absorption
- 6.3.1 Non-Utilized
- 6.3.2 Utilized
- 6.3.2.1 By Colocation Type
- 6.3.2.1.1 Hyperscale
- 6.3.2.1.2 Retail
- 6.3.2.1.3 Wholesale
- 6.3.2.2 By End User
- 6.3.2.2.1 BFSI
- 6.3.2.2.2 Cloud
- 6.3.2.2.3 E-Commerce
- 6.3.2.2.4 Government
- 6.3.2.2.5 Manufacturing
- 6.3.2.2.6 Media & Entertainment
- 6.3.2.2.7 Telecom
- 6.3.2.2.8 Other End User
-
6.4 Region
- 6.4.1 APAC
- 6.4.2 Africa
- 6.4.3 Europe
- 6.4.4 Middle East
- 6.4.5 North America
- 6.4.6 South America
7. COMPETITIVE LANDSCAPE
- 7.1 Market Share Analysis
- 7.2 Company Landscape
-
7.3 Company Profiles (includes Global Level Overview, Market Level Overview, Core Business Segments, Financials, Headcount, Key Information, Market Rank, Market Share, Products and Services, and Analysis of Recent Developments).
- 7.3.1 AirTrunk Operating Pty Ltd
- 7.3.2 Chindata Group Holdings Ltd
- 7.3.3 CyrusOne Inc.
- 7.3.4 Cyxtera Technologies
- 7.3.5 Digital Realty Trust Inc.
- 7.3.6 Equinix Inc.
- 7.3.7 Flexential Corp.
- 7.3.8 NTT Ltd
- 7.3.9 Quality Technology Services
- 7.3.10 Space DC Pte Ltd
- 7.3.11 Switch
- 7.3.12 Vantage Data Centers LLC
- 7.4 LIST OF COMPANIES STUDIED
8. KEY STRATEGIC QUESTIONS FOR DATA CENTER CEOS
9. APPENDIX
-
9.1 Global Overview
- 9.1.1 Overview
- 9.1.2 Porter’s Five Forces Framework
- 9.1.3 Global Value Chain Analysis
- 9.1.4 Global Market Size and DROs
- 9.2 Sources & References
- 9.3 List of Tables & Figures
- 9.4 Primary Insights
- 9.5 Data Pack
- 9.6 Glossary of Terms
You Can Purchase Parts Of This Report. Check Out Prices For Specific Sections
Get Price Break-up Now
List of Tables & Figures
- Figure 1:
- VOLUME OF IT LOAD CAPACITY, MW, GLOBAL, 2018 - 2030
- Figure 2:
- VOLUME OF RAISED FLOOR AREA, SQ.FT. ('000), GLOBAL, 2018 - 2030
- Figure 3:
- VALUE OF COLOCATION REVENUE, USD MILLION, GLOBAL, 2018 - 2030
- Figure 4:
- VOLUME OF INSTALLED RACKS, NUMBER, GLOBAL, 2018 - 2030
- Figure 5:
- RACK SPACE UTILIZATION, %, GLOBAL, 2018 - 2030
- Figure 6:
- COUNT OF SMARTPHONE USERS, IN MILLION, GLOBAL, 2018 - 2030
- Figure 7:
- DATA TRAFFIC PER SMARTPHONE, GB, GLOBAL, 2018 - 2030
- Figure 8:
- AVERAGE MOBILE DATA SPEED, MBPS, GLOBAL, 2018 - 2029
- Figure 9:
- AVERAGE BROADBAND SPEED, MBPS, GLOBAL, 2018 - 2029
- Figure 10:
- LENGTH OF FIBER CONNECTIVITY NETWORK, KILOMETER, GLOBAL, 2018 - 2030
- Figure 11:
- VOLUME OF IT LOAD CAPACITY, MW, GLOBAL, 2018 - 2030
- Figure 12:
- VOLUME OF DATA CENTER SIZE, MW, GLOBAL, 2018 - 2030
- Figure 13:
- VOLUME SHARE OF DATA CENTER SIZE, %, GLOBAL, 2018 - 2030
- Figure 14:
- VOLUME SIZE OF LARGE, MW, GLOBAL, 2018 - 2030
- Figure 15:
- VOLUME SHARE OF LARGE, MW, DATA CENTER SIZE, %, GLOBAL, 2018 - 2030
- Figure 16:
- VOLUME SIZE OF MASSIVE, MW, GLOBAL, 2018 - 2030
- Figure 17:
- VOLUME SHARE OF MASSIVE, MW, DATA CENTER SIZE, %, GLOBAL, 2018 - 2030
- Figure 18:
- VOLUME SIZE OF MEDIUM, MW, GLOBAL, 2018 - 2030
- Figure 19:
- VOLUME SHARE OF MEDIUM, MW, DATA CENTER SIZE, %, GLOBAL, 2018 - 2030
- Figure 20:
- VOLUME SIZE OF MEGA, MW, GLOBAL, 2018 - 2030
- Figure 21:
- VOLUME SHARE OF MEGA, MW, DATA CENTER SIZE, %, GLOBAL, 2018 - 2030
- Figure 22:
- VOLUME SIZE OF SMALL, MW, GLOBAL, 2018 - 2030
- Figure 23:
- VOLUME SHARE OF SMALL, MW, DATA CENTER SIZE, %, GLOBAL, 2018 - 2030
- Figure 24:
- VOLUME OF TIER TYPE, MW, GLOBAL, 2018 - 2030
- Figure 25:
- VOLUME SHARE OF TIER TYPE, %, GLOBAL, 2018 - 2030
- Figure 26:
- VOLUME SIZE OF TIER 1 AND 2, MW, GLOBAL, 2018 - 2030
- Figure 27:
- VOLUME SHARE OF TIER 1 AND 2, MW, TIER TYPE, %, GLOBAL, 2018 - 2030
- Figure 28:
- VOLUME SIZE OF TIER 3, MW, GLOBAL, 2018 - 2030
- Figure 29:
- VOLUME SHARE OF TIER 3, MW, TIER TYPE, %, GLOBAL, 2018 - 2030
- Figure 30:
- VOLUME SIZE OF TIER 4, MW, GLOBAL, 2018 - 2030
- Figure 31:
- VOLUME SHARE OF TIER 4, MW, TIER TYPE, %, GLOBAL, 2018 - 2030
- Figure 32:
- VOLUME OF ABSORPTION, MW, GLOBAL, 2018 - 2030
- Figure 33:
- VOLUME SHARE OF ABSORPTION, %, GLOBAL, 2018 - 2030
- Figure 34:
- VOLUME SIZE OF NON-UTILIZED, MW, GLOBAL, 2018 - 2030
- Figure 35:
- VOLUME SHARE OF NON-UTILIZED, MW, ABSORPTION, %, GLOBAL, 2018 - 2030
- Figure 36:
- VOLUME OF COLOCATION TYPE, MW, GLOBAL, 2018 - 2030
- Figure 37:
- VOLUME SHARE OF COLOCATION TYPE, %, GLOBAL, 2018 - 2030
- Figure 38:
- VOLUME SIZE OF HYPERSCALE, MW, GLOBAL, 2018 - 2030
- Figure 39:
- VOLUME SHARE OF HYPERSCALE, MW, COLOCATION TYPE, %, GLOBAL, 2018 - 2030
- Figure 40:
- VOLUME SIZE OF RETAIL, MW, GLOBAL, 2018 - 2030
- Figure 41:
- VOLUME SHARE OF RETAIL, MW, COLOCATION TYPE, %, GLOBAL, 2018 - 2030
- Figure 42:
- VOLUME SIZE OF WHOLESALE, MW, GLOBAL, 2018 - 2030
- Figure 43:
- VOLUME SHARE OF WHOLESALE, MW, COLOCATION TYPE, %, GLOBAL, 2018 - 2030
- Figure 44:
- VOLUME OF END USER, MW, GLOBAL, 2018 - 2030
- Figure 45:
- VOLUME SHARE OF END USER, %, GLOBAL, 2018 - 2030
- Figure 46:
- VOLUME SIZE OF BFSI, MW, GLOBAL, 2018 - 2030
- Figure 47:
- VOLUME SIZE OF CLOUD, MW, GLOBAL, 2018 - 2030
- Figure 48:
- VOLUME SIZE OF E-COMMERCE, MW, GLOBAL, 2018 - 2030
- Figure 49:
- VOLUME SIZE OF GOVERNMENT, MW, GLOBAL, 2018 - 2030
- Figure 50:
- VOLUME SIZE OF MANUFACTURING, MW, GLOBAL, 2018 - 2030
- Figure 51:
- VOLUME SIZE OF MEDIA & ENTERTAINMENT, MW, GLOBAL, 2018 - 2030
- Figure 52:
- VOLUME SIZE OF TELECOM, MW, GLOBAL, 2018 - 2030
- Figure 53:
- VOLUME SIZE OF OTHER END USER, MW, GLOBAL, 2018 - 2030
- Figure 54:
- VOLUME OF REGION, MW, GLOBAL, 2018 - 2030
- Figure 55:
- VOLUME SHARE OF REGION, %, GLOBAL, 2018 - 2030
- Figure 56:
- VOLUME SIZE OF APAC, MW, APAC, 2018 - 2030
- Figure 57:
- VOLUME SIZE OF AFRICA, MW, AFRICA, 2018 - 2030
- Figure 58:
- VOLUME SIZE OF EUROPE, MW, EUROPE, 2018 - 2030
- Figure 59:
- VOLUME SIZE OF MIDDLE EAST, MW, MIDDLE EAST, 2018 - 2030
- Figure 60:
- VOLUME SIZE OF NORTH AMERICA, MW, NORTH AMERICA, 2018 - 2030
- Figure 61:
- VOLUME SIZE OF SOUTH AMERICA, MW, SOUTH AMERICA, 2018 - 2030
- Figure 62:
- VOLUME SHARE OF MAJOR PLAYERS, %, GLOBAL
Data Center Industry Segmentation
Large, Massive, Medium, Mega, Small are covered as segments by Data Center Size. Tier 1 and 2, Tier 3, Tier 4 are covered as segments by Tier Type. Non-Utilized, Utilized are covered as segments by Absorption. APAC, Africa, Europe, Middle East, North America, South America are covered as segments by Region.| Data Center Size | Large | |||
| Massive | ||||
| Medium | ||||
| Mega | ||||
| Small | ||||
| Tier Type | Tier 1 and 2 | |||
| Tier 3 | ||||
| Tier 4 | ||||
| Absorption | Non-Utilized | |||
| Utilized | By Colocation Type | Hyperscale | ||
| Retail | ||||
| Wholesale | ||||
| By End User | BFSI | |||
| Cloud | ||||
| E-Commerce | ||||
| Government | ||||
| Manufacturing | ||||
| Media & Entertainment | ||||
| Telecom | ||||
| Other End User | ||||
| Region | APAC | |||
| Africa | ||||
| Europe | ||||
| Middle East | ||||
| North America | ||||
| South America | ||||
Need A Different Region or Segment?
Customize Now
Market Definition
- IT LOAD CAPACITY - The IT load capacity or installed capacity, refers to the amount of energy consumed by servers and network equipments placed in a rack installed. It is measured in megawatt (MW).
- ABSORPTION RATE - It denotes the extend to which the data center capacity has been leased out. For instance, a 100 MW DC has leased out 75 MW, then absorption rate would be 75%. It is also referred as utilization rate and leased-out capacity.
- RAISED FLOOR SPACE - It is an elevated space build over the floor. This gap between the original floor and the elevated floor is used to accommodate wiring, cooling, and other data center equipment. This arrangement assist in having proper wiring and cooling infrastructure. It is measured in square feet (ft^2).
- DATA CENTER SIZE - Data Center Size is segmented based on the raised floor space allocated to the data center facilities. Mega DC - # of Racks must be more than 9000 or RFS (raised floor space) must be more than 225001 Sq. ft; Massive DC - # of Racks must be in between 9000 and 3001 or RFS must be in between 225000 Sq. ft and 75001 Sq. ft; Large DC - # of Racks must be in between 3000 and 801 or RFS must be in between 75000 Sq. ft and 20001 Sq. ft; Medium DC # of Racks must be in between 800 and 201 or RFS must be in between 20000 Sq. ft and 5001 Sq. ft; Small DC - # of Racks must be less than 200 or RFS must be less than 5000 Sq. ft.
- TIER TYPE - According to Uptime Institute the data centers are classified into four tiers based on the proficiencies of redundant equipment of the data center infrastructure. In this segment the data center are segmented as Tier 1,Tier 2, Tier 3 and Tier 4.
- COLOCATION TYPE - The segment is segregated into 3 categories namely Retail, Wholesale and Hyperscale Colocation service. The categorization is done based on the amount of IT load leased out to potential customers. Retail colocation service has leased capacity less than 250 kW; Wholesale colocation services has leased capacity between 251 kW and 4 MW and Hyperscale colocation services has leased capacity more than 4 MW.
- END CONSUMERS - The Data Center Market operates on a B2B basis. BFSI, Government, Cloud Operators, Media and Entertainment, E-Commerce, Telecom and Manufacturing are the major end-consumers in the market studied. The scope only includes colocation service operators catering to the increasing digitalization of the end-user industries.
| Keyword | Definition |
|---|---|
| Rack Unit | Generally referred as U or RU, it is the unit of measurement for the server unit housed in the racks in the data center. 1U is equal to 1.75 inches. |
| Rack Density | It defines the amount of power consumed by the equipment and server housed in a rack. It is measured in kilowatt (kW). This factor plays a critical role in data center design and, cooling and power planning. |
| IT Load Capacity | The IT load capacity or installed capacity, refers to the amount of energy consumed by servers and network equipment placed in a rack installed. It is measured in megawatt (MW). |
| Absorption Rate | It denotes how much of the data center capacity has been leased out. For instance, if a 100 MW DC has leased out 75 MW, then the absorption rate would be 75%. It is also referred to as utilization rate and leased-out capacity. |
| Raised Floor Space | It is an elevated space built over the floor. This gap between the original floor and the elevated floor is used to accommodate wiring, cooling, and other data center equipment. This arrangement assists in having proper wiring and cooling infrastructure. It is measured in square feet/meter. |
| Computer Room Air Conditioner (CRAC) | It is a device used to monitor and maintain the temperature, air circulation, and humidity inside the server room in the data center. |
| Aisle | It is the open space between the rows of racks. This open space is critical for maintaining the optimal temperature (20-25 °C) in the server room. There are primarily two aisles inside the server room, a hot aisle and a cold aisle. |
| Cold Aisle | It is the aisle wherein the front of the rack faces the aisle. Here, chilled air is directed into the aisle so that it can enter the front of the racks and maintain the temperature. |
| Hot Aisle | It is the aisle where the back of the racks faces the aisle. Here, the heat dissipated from the equipment’s in the rack is directed to the outlet vent of the CRAC. |
| Critical Load | It includes the servers and other computer equipment whose uptime is critical for data center operation. |
| Power Usage Effectiveness (PUE) | It is a metric which defines the efficiency of a data center. It is calculated by: (𝑇𝑜𝑡𝑎𝑙 𝐷𝑎𝑡𝑎 𝐶𝑒𝑛𝑡𝑒𝑟 𝐸𝑛𝑒𝑟𝑔𝑦 𝐶𝑜𝑛𝑠𝑢𝑚𝑝𝑡𝑖𝑜𝑛)/(𝑇𝑜𝑡𝑎𝑙 𝐼𝑇 𝐸𝑞𝑢𝑖𝑝𝑚𝑒𝑛𝑡 𝐸𝑛𝑒𝑟𝑔𝑦 𝐶𝑜𝑛𝑠𝑢𝑚𝑝𝑡𝑖𝑜𝑛). Further, a data center with a PUE of 1.2-1.5 is considered highly efficient, whereas, a data center with a PUE >2 is considered highly inefficient. |
| Redundancy | It is defined as a system design wherein additional component (UPS, generators, CRAC) is added so that in case of power outage, equipment failure, the IT equipment should not be affected. |
| Uninterruptible Power Supply (UPS) | It is a device that is connected in series with the utility power supply, storing energy in batteries such that the supply from UPS is continuous to IT equipment even during utility power is snapped. The UPS primarily supports the IT equipment only. |
| Generators | Just like UPS, generators are placed in the data center to ensure an uninterrupted power supply, avoiding downtime. Data center facilities have diesel generators and commonly, 48-hour diesel is stored in the facility to prevent disruption. |
| N | It denotes the tools and equipment required for a data center to function at full load. Only "N" indicates that there is no backup to the equipment in the event of any failure. |
| N+1 | Referred to as 'Need plus one', it denotes the additional equipment setup available to avoid downtime in case of failure. A data center is considered N+1 when there is one additional unit for every 4 components. For instance, if a data center has 4 UPS systems, then for to achieve N+1, an additional UPS system would be required. |
| 2N | It refers to fully redundant design wherein two independent power distribution system is deployed. Therefore, in the event of a complete failure of one distribution system, the other system will still supply power to the data center. |
| In-Row Cooling | It is the cooling design system installed between racks in a row where it draws warm air from the hot aisle and supplies cool air to the cold aisle, thereby maintaining the temperature. |
| Tier 1 | Tier classification determines the preparedness of a data center facility to sustain data center operation. A data center is classified as Tier 1 data center when it has a non-redundant (N) power component (UPS, generators), cooling components, and power distribution system (from utility power grids). The Tier 1 data center has an uptime of 99.67% and an annual downtime of <28.8 hours. |
| Tier 2 | A data center is classified as Tier 2 data center when it has a redundant power and cooling components (N+1) and a single non-redundant distribution system. Redundant components include extra generators, UPS, chillers, heat rejection equipment, and fuel tanks. The Tier 2 data center has an uptime of 99.74% and an annual downtime of <22 hours. |
| Tier 3 | A data center having redundant power and cooling components and multiple power distribution systems is referred to as a Tier 3 data center. The facility is resistant to planned (facility maintenance) and unplanned (power outage, cooling failure) disruption. The Tier 3 data center has an uptime of 99.98% and an annual downtime of <1.6 hours. |
| Tier 4 | It is the most tolerant type of data center. A Tier 4 data center has multiple, independent redundant power and cooling components and multiple power distribution paths. All IT equipment are dual powered, making them fault tolerant in case of any disruption, thereby ensuring interrupted operation. The Tier 4 data center has an uptime of 99.74% and an annual downtime of <26.3 minutes. |
| Small Data Center | Data center that has floor space area of ≤ 5,000 Sq. ft or the number of racks that can be installed is ≤ 200 is classified as a small data center. |
| Medium Data Center | Data center which has floor space area between 5,001-20,000 Sq. ft, or the number of racks that can be installed is between 201-800, is classified as a medium data center. |
| Large Data Center | Data center which has floor space area between 20,001-75,000 Sq. ft, or the number of racks that can be installed is between 801-3,000, is classified as a large data center. |
| Massive Data Center | Data center which has floor space area between 75,001-225,000 Sq. ft, or the number of racks that can be installed is between 3001-9,000, is classified as a massive data center. |
| Mega Data Center | Data center that has a floor space area of ≥ 225,001 Sq. ft or the number of racks that can be installed is ≥ 9001 is classified as a mega data center. |
| Retail Colocation | It refers to those customers who have a capacity requirement of 250 kW or less. These services are majorly opted by small and medium enterprises (SMEs). |
| Wholesale Colocation | It refers to those customers who have a capacity requirement between 250 kW to 4 MW. These services are majorly opted by medium to large enterprises. |
| Hyperscale Colocation | It refers to those customers who have a capacity requirement greater than 4 MW. The hyperscale demand primarily originates from large-scale cloud players, IT companies, BFSI, and OTT players (like Netflix, Hulu, and HBO+). |
| Mobile Data Speed | It is the mobile internet speed a user experiences via their smartphones. This speed is primarily dependent on the carrier technology being used in the smartphone. The carrier technologies available in the market are 2G, 3G, 4G, and 5G, where 2G provides the slowest speed while 5G is the fastest. |
| Fiber Connectivity Network | It is a network of optical fiber cables deployed across the country, connecting rural and urban regions with high-speed internet connection. It is measured in kilometer (km). |
| Data Traffic per Smartphone | It is a measure of average data consumption by a smartphone user in a month. It is measured in gigabyte (GB). |
| Broadband Data Speed | It is the internet speed that is supplied over the fixed cable connection. Commonly, copper cable and optic fiber cable are used in both residential and commercial use. Here, optic cable fiber provides faster internet speed than copper cable. |
| Submarine Cable | A submarine cable is a fiber optic cable laid down at two or more landing points. Through this cable, communication and internet connectivity between countries across the globe is established. These cables can transmit 100-200 terabits per second (Tbps) from one point to another. |
| Carbon Footprint | It is the measure of carbon dioxide generated during the regular operation of a data center. Since, coal, and oil & gas are the primary source of power generation, consumption of this power contributes to carbon emissions. Data center operators are incorporating renewable energy sources to curb the carbon footprint emerging in their facilities. |
Need More Details on Market Definition?
Ask a Question
Research Methodology
Mordor Intelligence follows a four-step methodology in all our reports.
- Step-1: Identify Key Variables: In order to build a robust forecasting methodology, the variables and factors identified in Step-1 are tested against available historical market numbers. Through an iterative process, the variables required for market forecast are set and the model is built on the basis of these variables.
- Step-2: Build a Market Model: Market-size estimations for the forecast years are in nominal terms. Inflation is not a part of the pricing, and the average selling price (ASP) is kept constant throughout the forecast period for each country.
- Step-3: Validate and Finalize: In this important step, all market numbers, variables and analyst calls are validated through an extensive network of primary research experts from the market studied. The respondents are selected across levels and functions to generate a holistic picture of the market studied.
- Step-4: Research Outputs: Syndicated Reports, Custom Consulting Assignments, Databases & Subscription Platforms

Get More Details On Research Methodology
Download PDF


