
Data Center Accelerator Market Size and Share
Market Overview
| Study Period | 2020 - 2032 |
|---|---|
| Market Size (2026) | USD 14.69 Billion |
| Market Size (2032) | USD 32.13 Billion |
| Growth Rate (2026 - 2032) | 13.96 % |
| Fastest Growing Market | Asia Pacific |
| Largest Market | Europe |
| Market Concentration | Medium |
Major Players *Disclaimer: Major Players sorted in no particular order Image © Mordor Intelligence. Reuse requires attribution under CC BY 4.0. | |
Data Center Accelerator Market Analysis by Mordor Intelligence
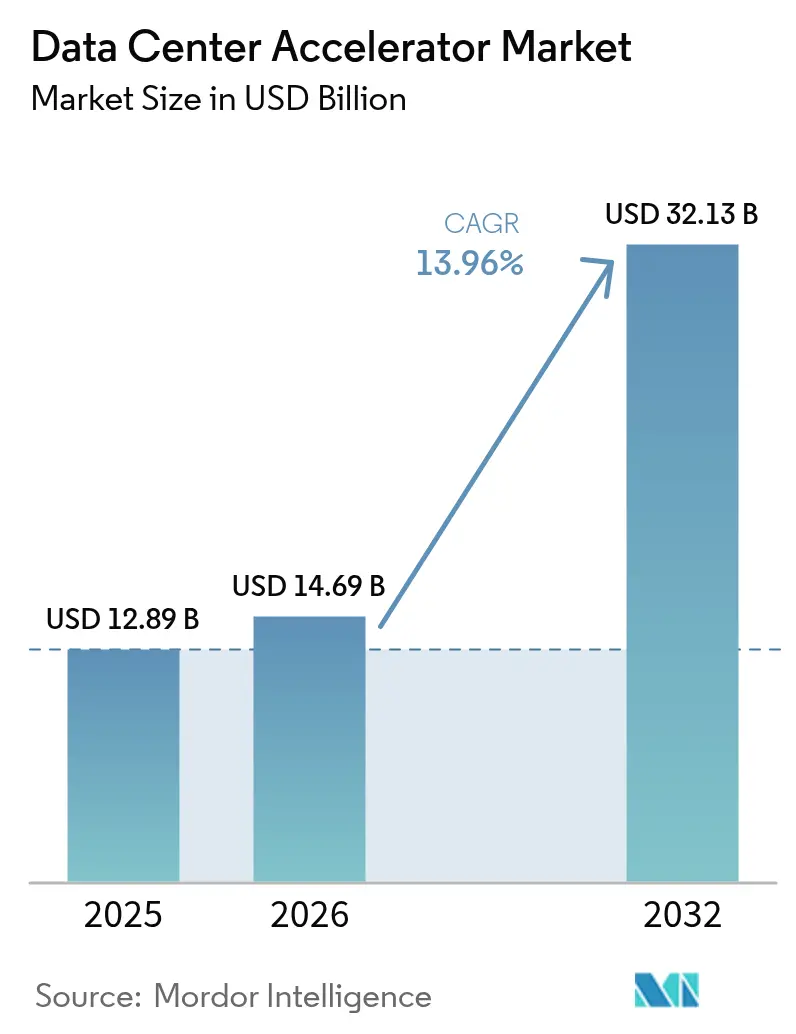
Data Center Accelerator market size in 2026 is estimated at USD 14.69 billion, growing from 2025 value of USD 12.89 billion with 2032 projections showing USD 32.13 billion, growing at 13.96% CAGR over 2026-2032. Escalating artificial-intelligence training cycles, the proliferation of hyperscale facilities, and the pivot toward GPU, ASIC, and other purpose-built chips are the primary engines behind this expansion. Sovereign-cloud programs, export-control regimes, and sustainability mandates are reshaping regional investment patterns, nudging buyers toward domestically sourced accelerators and greener infrastructure. Strained packaging-substrate capacity and high-bandwidth-memory shortages are tempering near-term hardware availability, prompting cloud providers to prioritize the highest-margin configurations. At the same time, liquid-cooling retrofits and renewable-power purchase agreements are emerging as critical selection criteria for capital projects, signaling that energy efficiency is now a competitive differentiator rather than a cost center.
Key Report Takeaways
- By processor type, GPUs led with 73.20% revenue share in 2025; ASICs are projected to expand at a 15.42% CAGR through 2032.
- By application, AI training accounted for 49.30% of the Data Center Accelerator market share in 2025, while AI inference is advancing at a 15.55% CAGR through 2032.
- By deployment model, public cloud captured 57.10% of the Data Center Accelerator market size in 2025; hybrid and edge configurations are expanding at a 15.72% CAGR to 2032.
- By end-user industry, IT and telecom held 39.40% revenue share in 2025, whereas healthcare and life sciences are forecast to grow at a 14.62% CAGR to 2032.
- By geography, North America retained the largest regional stake in 2025, while APAC is projected to record the fastest CAGR through 2032.
Note: Market size and forecast figures in this report are generated using Mordor Intelligence’s proprietary estimation framework, updated with the latest available data and insights as of 2026.
Market Trends and Insights
Drivers Impact Analysis of Data Center Accelerator Market*
| DRIVER | (~) % IMPACT ON CAGR FORECAST | GEOGRAPHIC RELEVANCE | IMPACT TIMELINE |
|---|---|---|---|
| Surging AI/ML training workloads in hyperscale data centers | +4.2% | North America, APAC | Medium term (2-4 years) |
| GPU scarcity driving cloud-based accelerator rentals | +2.8% | North America, Europe | Short term (≤ 2 years) |
| Rapid adoption of generative AI in SaaS platforms | +3.1% | North America, Europe | Medium term (2-4 years) |
| Quantum-inspired algorithms demanding heterogeneous accelerators | +1.5% | North America, Europe, APAC | Long term (≥ 4 years) |
| Edge-to-core workload orchestration | +2.3% | APAC, Europe | Medium term (2-4 years) |
| Sovereign-cloud programs subsidizing domestic accelerator fabs | +1.8% | APAC, MEA, Europe | Long term (≥ 4 years) |
| Source: Mordor Intelligence | |||
Surging AI/ML Training Workloads in Hyperscale Data Centers
Hyperscale operators now deploy data halls purpose-built for AI that demand 10–100 times more compute density than legacy enterprise workloads. Meta’s USD 800 million Indiana campus exemplifies the shift as it standardizes liquid-cooled racks to accommodate multi-petaflop GPU clusters. Microsoft earmarked more than USD 80 billion for U.S. AI facilities in fiscal-year 2025, underscoring the geographic clustering of training infrastructure. Amazon’s USD 100 billion multistate expansion further signals that cloud hyperscalers are pursuing scale economics, but every new megawatt must meet internal renewable-energy thresholds.[3] A balancing act is emerging as enterprises move from prototype models to inference pipelines, resulting in more heterogeneous rack designs that integrate GPU, CPU, and ASIC nodes. Financial institutions exemplify this dual-track buildout, allocating discrete GPU clusters for real-time fraud detection while maintaining CPU-heavy analytics farms for regulatory reporting.
GPU Scarcity Driving Cloud-Based Accelerator Rentals
Chronic shortages of premium GPUs have spawned GPU-as-a-Service platforms that decouple hardware ownership from usage. Oracle Cloud Infrastructure’s supercluster supports 16,384 AMD Instinct MI300X GPUs and offers consumption-based web portals, reducing procurement lead times from months to minutes.[1] Re-purposed cryptocurrency-mining sites in North America and Europe contribute power-dense real estate, allowing operators to monetize stranded electrical capacity. The rental model democratizes access for small and midsize organizations that could not previously justify the capital outlay for top-tier accelerators. Service providers also gain leverage when negotiating vendor allocations, enhancing resilience against single-supplier constraints.
Rapid Adoption of Generative AI in SaaS Platforms
Software-as-a-Service vendors are weaving generative AI directly into collaboration, customer-service, and analytics suites, a move that sharply increases inference transactions per active user. Together AI’s large-language-model cluster underscores hardware differences between inference and training; memory bandwidth and latency eclipse peak FLOPS as bottlenecks. Healthcare SaaS examples, such as diagnostic-imaging APIs, must process encrypted images in real time, thereby favoring ASICs tuned for small-batch inference. In financial services, real-time credit-risk models demand millisecond responses, driving adoption of in-memory computing fabrics. The result is a sustained market for accelerators optimized for power efficiency and deterministic latency rather than absolute throughput.
Quantum-Inspired Algorithms Demanding Heterogeneous Accelerators
Although practical quantum computers remain years away, quantum-inspired classical algorithms have entered pilot use in cryptography, portfolio optimization, and drug-discovery modeling. These workflows pair CPU pre-processing with GPU or FPGA emulation layers and call for hybrid system topologies unlike standard AI clusters. Government research programs and defense contracts are driving early funding, signaling a long-tail demand curve that begins in national laboratories and defense installations before filtering into commercial sectors.[2] Vendors able to blend quantum-simulation engines with mainstream accelerators will command a defensible niche as the market evolves.
Restraints Impact Analysis of Data Center Accelerator Market*
| RESTRAINTS | (~) % IMPACT ON CAGR FORECAST | GEOGRAPHIC RELEVANCE | IMPACT TIMELINE |
|---|---|---|---|
| Tight global supply of advanced packaging substrates | -2.1% | APAC manufacturing hubs | Short term (≤ 2 years) |
| Steep learning curve for heterogeneous programming models | -1.4% | Global | Medium term (2-4 years) |
| Rising Scope-3 emission targets constraining mega-GPU clusters | -1.8% | North America, Europe, APAC | Medium term (2-4 years) |
| Export-control regimes on high-end GPUs and ASICs | -1.2% | China, Russia | Long term (≥ 4 years) |
| Source: Mordor Intelligence | |||
Tight Global Supply of Advanced Packaging Substrates
Accelerators that integrate HBM stacks and chiplets rely on Ajinomoto Build-Up Film and CoWoS packaging, materials now subject to year-long lead times. Suppliers prioritize high-margin SKUs, leaving smaller vendors scrambling for limited allocations. Organic-interposer experimentation is underway but will not meaningfully ease constraints for at least two production cycles. Taiwan and South Korea have announced aggressive substrate-capacity expansions, yet the ramp window extends beyond current demand inflection points.
Steep Learning Curve for Heterogeneous Programming Models
As chips diversify, developers must adopt multiple toolchains, from CUDA to ROCm to vendor-specific SDKs. Skill shortages increase integration costs and prolong proof-of-concept timelines. Open-standard efforts such as OneAPI attempt to bridge gaps, but mismatched release cadences across hardware generations complicate maintenance. Emerging markets face the steepest hurdles because local universities lag in specialized curriculum offerings.
*Our forecasts treat driver/restraint impacts as directional, not additive. The impact forecasts reflect baseline growth, mix effects, and variable interactions.
Data Center Accelerator Market Segment Analysis
By Processor Type:
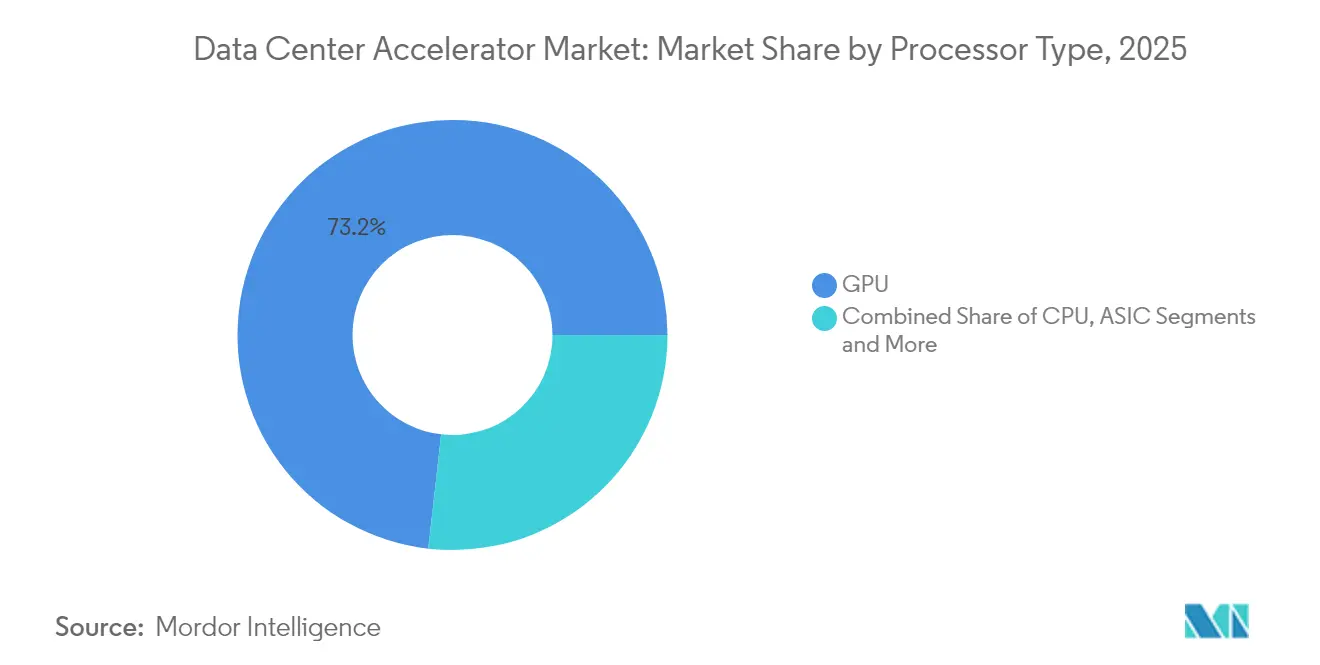
ASICs Emerge as Inference ChampionsGPU processors retained a 73.20% stake in 2025, reflecting their versatility across both model-training and inference tasks. ASIC shipments, however, are projected to rise at a 15.42% CAGR to 2032 as enterprises tune for lower power draw during steady-state inference workloads. Google’s internally developed TPU v6 exemplifies the in-house silicon trend that balances performance and cost. Meanwhile, AMD’s Instinct MI350 family expands HBM capacity to 288 GB, targeting memory-bound transformer models. CPU sockets still orchestrate I/O and housekeeping tasks, while FPGA cards maintain relevance in telecom edge nodes that call for deterministic latency.
ASIC growth illustrates shifting buyer priorities. Power budgets inside co-location cages rarely scale linearly with rack density, driving operators to favor TOPS-per-watt metrics. Inference-dense SaaS offerings, such as customer-support chatbots and real-time personalization engines, require predictable latency that ASIC designs now deliver. Training workloads will still concentrate on multi-GPU clusters, yet a portion of compute cycles migrates to specialized tensor engines integrated into next-gen GPUs, blurring categorical boundaries. Overall, processor diversity strengthens vendor competition, offering buyers leverage on pricing and supply continuity.

By Application:
AI Inference Accelerates Past TrainingAI training accounted for 49.30% of Data Center Accelerator market revenue in 2025, but inference workloads will record a faster 15.55% CAGR through 2032. Businesses once content with pilot projects are now releasing chatbots, recommendation models, and image-analysis services into production, where latency slippage translates directly into customer churn. High-performance computing remains a stable niche centered on weather modeling, genomics, and computational fluid dynamics, relying on GPUs with larger HBM stacks rather than pure ASICs.
Inference growth ripples across hardware selection. Batch-size variability and strict service-level agreements necessitate accelerators that optimize memory bandwidth over raw floating-point throughput. Healthcare providers employ inference-optimized boards to perform diagnostic imaging at the point of care, shortening time to diagnosis for conditions such as stroke. Financial institutions likewise leverage accelerators for real-time risk scoring, embedding compute nodes inside private-cloud environments for regulatory compliance. The expanding application mix will continue to diversify purchase criteria, with software ecosystem maturity increasingly tipping buying decisions.
By Deployment Model:
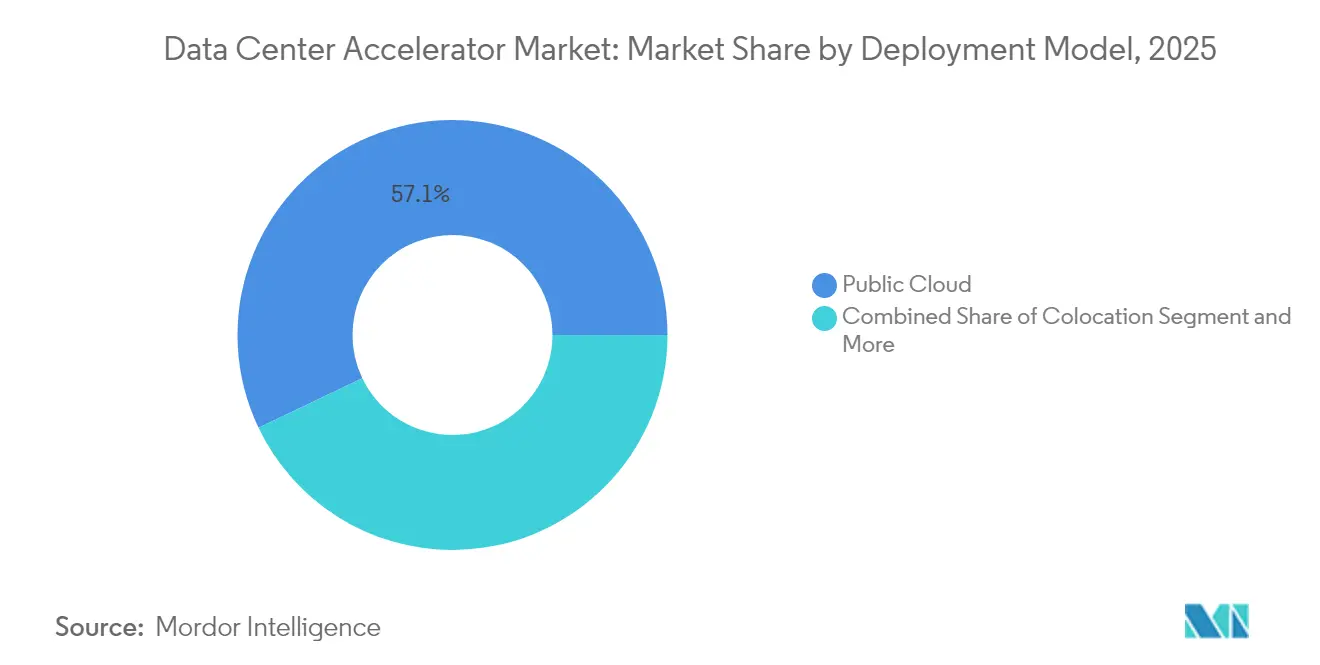
Hybrid Edge Configurations Drive GrowthPublic-cloud tenants consumed 57.10% of Data Center Accelerator market size in 2025. But hybrid-edge installations will expand at a 15.72% CAGR as organizations co-locate inference engines closer to data sources. Telcos upgrade central offices into micro-data centers to process traffic from autonomous vehicles and augmented-reality streams. Co-location providers respond with liquid-cooling retrofits and sovereign-cloud zones to court regulated industries.
On-premise options regain traction where data-sovereignty or cost-predictability outweigh hyperscale convenience. Retailers, for example, run video analytics on in-store edge servers to avoid backhaul latency. Development teams still burst training jobs into the public cloud but increasingly repatriate models for inference. The resulting architectural pluralism fuels demand for management platforms that orchestrate workloads across clouds, co-location sites, and customer campuses.
By End-User Industry:
Healthcare Leads Growth TrajectoryIT and telecom operators represented 39.40% of 2025 revenue as carriers modernized networks for 5G core slicing and network-function virtualization. Healthcare and life sciences, however, will be the fastest-growing vertical at a 14.62% CAGR to 2032. Genomics pipelines depend on petabyte-scale throughput, while diagnostic-imaging instruments require AI inference at the edge to guide physicians in real time. Gretel’s synthetic-data services employ accelerators to generate privacy-preserving datasets, helping hospitals comply with stringent regulatory frameworks.
Financial-services workloads focus on nanosecond-level fraud detection and algorithmic trading simulations, necessitating dedicated accelerator pools inside private clouds. Government and defense users, bolstered by multihundred-million-dollar AI procurement programs, favor secure, air-gapped infrastructures. Media and entertainment studios adopt GPU render farms to accelerate content creation and real-time streaming. These diverse requirements sustain market momentum and foster specialization among chip vendors and system integrators.
Geography Analysis
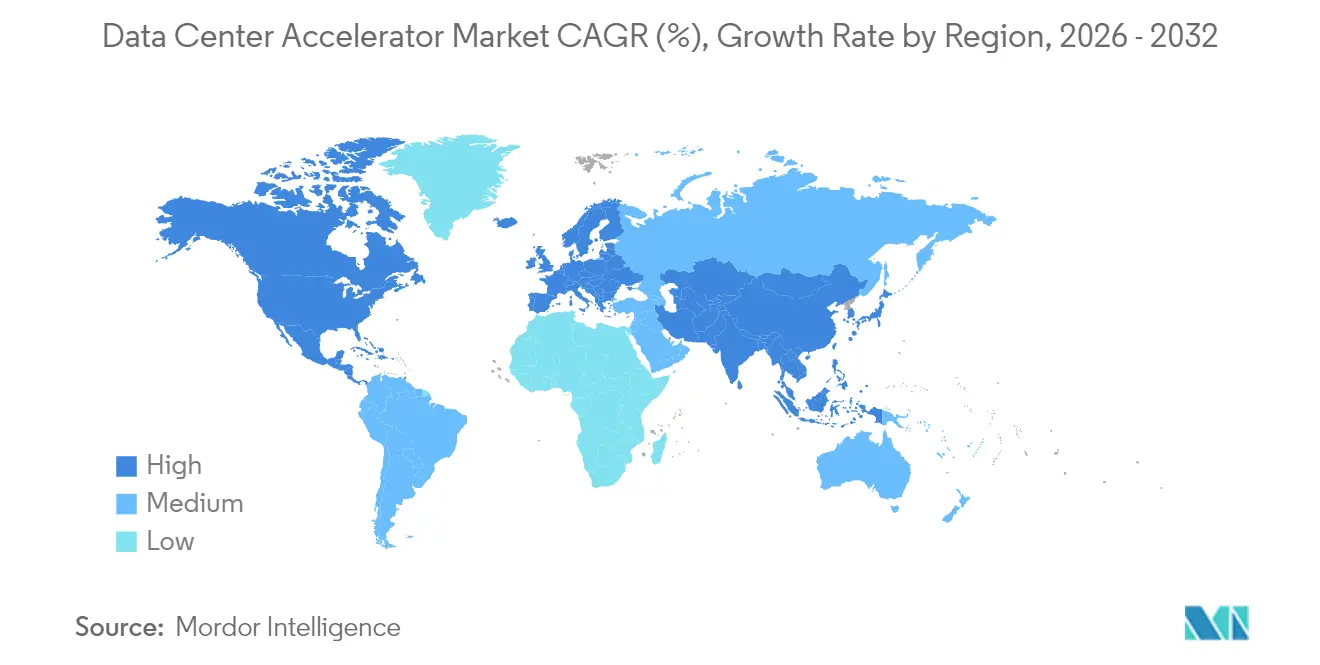
North America Data Center Accelerator Market
North America remains the largest buyer, underpinned by hyperscale capital-expenditure plans from Amazon, Microsoft, and Google. Microsoft’s spending alone surpasses USD 80 billion for domestic facilities in 2025. Canada and Mexico emerge as near-shore options that balance power-cost and latency considerations while staying within North American regulatory frameworks.
APAC Data Center Accelerator Market
APAC will post the highest CAGR, buoyed by sovereign-cloud mandates and the construction of enormous campuses such as South Korea’s USD 35 billion complex. China advances domestic accelerators like Huawei’s Ascend series to navigate export-control limitations. Japan’s Rapidus consortium and SoftBank’s chip initiatives, aided by public funding, aim to reclaim semiconductor manufacturing relevance.
EMEA Data Center Accelerator Market
Europe’s GAIA-X and IPCEI-CIS programs foster cross-border data-sovereignty clouds. Blackstone’s USD 13 billion UK data-center commitment underscores investor confidence in regional AI demand. Middle East and Africa growth hinges on sovereign wealth-fund backing, with energy-price advantages supporting power-hungry installations in the UAE and Saudi Arabia.
Regulatory Landscape
Regulation affecting data center accelerators is increasingly shaped by national security export controls, data sovereignty programs, and AI governance rules that pull hardware selection into compliance planning. In the United States, the Bureau of Industry and Security (BIS) issued the Framework for Artificial Intelligence Diffusion effective January 2025, extending license requirements to advanced computing chips and assemblies containing them under a tiered country framework. This affects cross-border procurement and deployment of high-end GPU and ASIC systems.
In Europe, the EU AI Act adds documentation and transparency obligations that reach into infrastructure choices when accelerators underpin high-risk AI systems. Annex IV technical documentation requires providers to describe the intended hardware, and the Act also drives standardization activity tied to resource performance, including energy consumption across the lifecycle. Transparency requirements for general purpose AI models take effect in August 2026. Together, these measures increase the emphasis on traceability of accelerator configurations, power and efficiency reporting, and end-use controls for operators building multi-region AI capacity.
Value Chain Analysis
The data center accelerator value chain runs from materials and wafer supply into leading-edge foundries and memory suppliers, then into advanced packaging and board or system manufacturing before reaching hyperscalers, cloud providers, and enterprise data centers. Key upstream and midstream participants include TSMC for leading-edge logic and CoWoS packaging, memory suppliers such as SK hynix, Samsung, and Micron for HBM stacks, and OSATs and packaging specialists such as ASE. Downstream, large ODMs and system builders (including Foxconn, Quanta, Wistron, Wiwynn, Pegatron, and Inventec) integrate accelerators into server and rack-scale platforms for customers such as AWS, Microsoft, Google, and Meta.
Across 2024-2025, the primary throughput constraints centered on advanced packaging capacity (notably CoWoS) and HBM availability rather than logic wafer starts. This dynamic reinforces supplier bargaining power and favors customers able to secure long-term allocations. The ecosystem is also shifting toward standardized rack-scale designs and broader manufacturing partner networks; NVIDIA identified a wide set of system manufacturing partners for its Blackwell Ultra (GB300) and Vera Rubin platforms in May 2026, underscoring that production scale and integration capability now sit alongside silicon performance as core differentiators.
Competitive Landscape
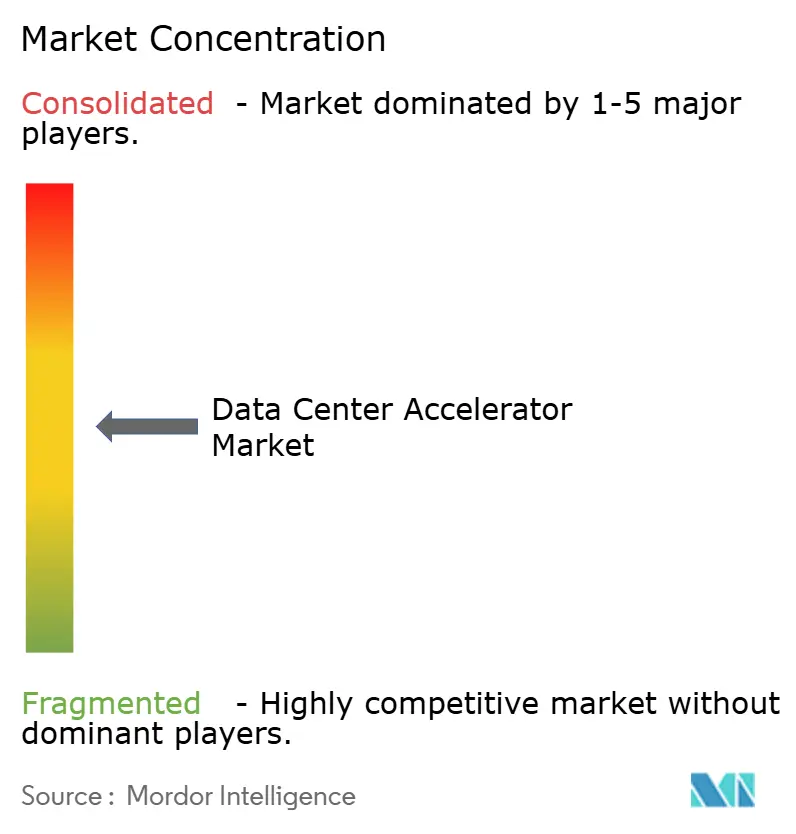
The Data Center Accelerator market displays moderate concentration. NVIDIA dominates training clusters, yet AMD compresses its GPU road map, advancing MI350 launch to early 2025 to win hyperscale sockets. Intel positions Gaudi accelerators for price-performance niches, while Google and Amazon field proprietary TPUs and Inferentia chips to reduce merchant-silicon reliance.
Architectural diversity invites nimble entrants. Cerebras targets wafer-scale AI, Tenstorrent pushes RISC-V designs, and Alibaba’s Hanguang line serves domestic Chinese clouds. Software ecosystems become decisive; vendors bundle compilers, low-level APIs, and model-optimization utilities to lock in developers. Supply-chain risk reshapes sourcing strategies as customers dual-source GPU and ASIC boards to hedge against substrate shortages.
Strategic deals underscore the arms race. Oracle partners with AMD to deploy MI300X superclusters, offering customers an NVIDIA alternative. Microsoft collaborates with liquid-cooling specialists for on-premise clusters in high-density zones. Patent filings in chiplet interconnects surge as firms seek defensible IP positions, evidencing a pivot from monolithic dies to modular architectures.
Data Center Accelerator Industry Leaders
-
Intel Corporation
-
NVIDIA Corporation
-
Advanced Micro Devices Inc.
-
Achronix Semiconductor Corporation
-
Xilinx Inc. (Advanced Micro Devices Inc.)
- *Disclaimer: Major Players sorted in no particular order
Data Center Accelerator Market Companies Covered in this Report
- NVIDIA Corporation
- Intel Corporation
- Advanced Micro Devices Inc.
- Google LLC (TPU)
- Amazon Web Services Inc.
- Qualcomm Technologies Inc.
- Xilinx Inc. (AMD)
- Achronix Semiconductor Corp.
- NEC Corporation
- Dell Technologies Inc.
- IBM Corporation
- Cisco Systems Inc.
- Huawei Technologies Co. Ltd.
- Alibaba Cloud (Hanguang)
- Baidu Inc. (Kunlun)
- Graphcore Ltd.
- Cerebras Systems Inc.
- Tenstorrent Inc.
- Ampere Computing LLC
- Arm Ltd.
- Broadcom Inc.
- Marvell Technology Inc.
- Samsung Electronics Co. Ltd.
- Fujitsu Ltd.
Market Opportunities and Future Outlook
Near-term whitespace is opening around rack-scale standardization, thermal and power engineering, and alternative accelerator pathways that reduce dependence on a single merchant GPU supply chain. Multi-gigawatt campus announcements are pushing demand for interoperable racks, switching, and cooling designs rather than bespoke per-site builds. Meta announced in July 2026 that it is expanding its Hyperion data center campus in Richland Parish, Louisiana, to 5 GW with a USD 50 billion investment, while Pure Data Centres announced a 550 MW AI campus (SJK01) in Seinaejoki, Finland, with Phase 1 investment stated at over EUR 1.5 billion. Projects like these increase opportunities for accelerator platforms that can be deployed in repeatable rack templates and integrated with liquid cooling and high-speed interconnects.
The accelerator roadmap is also broadening beyond standalone devices toward platform-led systems and co-designed supply chains. NVIDIA announced in May 2026 that its Vera Rubin platform is ramping into full production for agentic AI factories, paired with networking elements including Spectrum-class Ethernet switching and photonics-oriented upgrades. This supports opportunities in interconnect, optical modules, and validated system architectures. AMD highlighted rack-scale directionality through its Helios platform plans and disclosed a commitment of over USD 10 billion to Taiwan ecosystem partners to support production. Separately, Foxconn and Intel announced a partnership in June 2026 to manufacture rack-scale AI infrastructure, including CPU-dense variants and custom silicon development for inference-heavy workloads. These moves support opportunities for vendors and integrators that can package accelerators with memory, networking, and software into deployable building blocks for hybrid, edge, and sovereign-cloud environments where compliance, power density, and supply assurance are purchase criteria.
Recent Industry Developments in Data Center Accelerator Market
- May 2026: NVIDIA announced that its Vera Rubin platform is ramping into full production for agentic AI factories, including the Vera Rubin NVL72 system, Vera CPU, and Spectrum-6 SPX Ethernet switches. The announcement signals a platform-level approach where compute, networking, and system architecture are delivered as an integrated stack. It raises the bar for competitors and broadens demand for validated rack-scale deployments.
- September 2025: NVIDIA and Intel announced a collaboration to jointly develop custom products, including Intel-built NVIDIA-custom x86 CPUs that utilize NVIDIA NVLink technology. The partnership links NVIDIA system-scale interconnect strengths with Intel x86 manufacturing and platform reach. It reinforces heterogeneous designs that pair CPUs and accelerators more tightly inside data center nodes.
- September 2024: Intel launched Xeon 6 processors and Gaudi 3 AI accelerators for data center AI workloads. Expanding the Xeon and Gaudi roadmap increases buyer optionality for training and inference stacks. This is especially relevant where procurement teams want alternatives to GPU-only configurations and tighter CPU-accelerator platform alignment.
Data Center Accelerator Market Report Scope and Research Methodology
Market Definition and Coverage
This market covers hardware accelerators deployed inside data centers to speed up compute-heavy workloads, especially AI training, AI inference, and high-performance computing. The sizing is captured in revenue terms for accelerator processors and related accelerator solutions sold into data center environments.
Scope exclusions: We exclude general-purpose servers without accelerator attach, software-only AI frameworks, and data center construction services.
Segments Covered in This Report
- By Processor Type
- CPU
- GPU
- FPGA
- ASIC
- By Application
- High-Performance Computing
- Artificial Intelligence Training
- Artificial Intelligence Inference
- Other Workloads
- By Deployment Model
- On-Premise/ Enterprise/Edge
- Colocation
- Public Cloud
- By End-user Industry
- IT and Telecom
- BFSI
- Healthcare and Life Sciences
- Government and Defense
- Media and Entertainment
- Others End Users
- By Geography
- North America
- United States
- Mexico
- Canada
- South America
- Brazil
- Rest of South America
- Europe
- Germany
- United Kingdom
- France
- Russia
- Rest of Europe
- Asia-Pacific
- China
- Japan
- India
- South Korea
- Rest of Asia-Pacific
- Middle East and Africa
- Middle East
- Saudi Arabia
- UAE
- Turkey
- Africa
- South Africa
- Rest of Africa
- Middle East
- North America
Data Sources, Market Sizing, and Validation
Desk Research
Desk research was used to set the boundaries and collect anchor data points that can be checked against our model. We referenced public sources such as IT hardware trade statistics from the US International Trade Commission, national statistics releases for ICT and industrial output (for example, US Census Bureau and Eurostat), and energy and data center related publications from agencies such as the International Energy Agency.
We also used technical and adoption signals from peer-reviewed journals and standards bodies (such as IEEE publications) to understand how accelerator demand shifts between AI training, inference, and HPC. On the commercial side, company filings, earnings call transcripts, investor presentations, and reputable press coverage were reviewed to map shipment commentary, supply constraints (like HBM availability), and pricing direction. Patent databases and an import and export shipment-level database were used selectively to sanity-check technology intensity and cross-border hardware movement. These examples are not exhaustive, and many other public sources were also used for data collection, validation, and research clarification.
Primary Interviews and Surveys
Primary work focused on validating what is actually being deployed in data centers, and how purchasing decisions shift by workload and deployment model. We spoke with stakeholders across accelerator supply chains, data center operators, and system integrators across APAC, EMEA, and the Americas. The input then helped us refine adoption assumptions, average selling price trends, and near-term constraint impacts.
Distribution of primary research fieldwork respondents
| Company type | Respondent position | Region |
|---|---|---|
| Top tier: 31% | CXOs: 19% | APAC: 43% |
| Mid tier: 49% | Functional/Unit leaders: 30% | EMEA: 31% |
| Smaller Players: 20% | Managers: 51% | Americas: 26% |
Market-Sizing & Forecasting
Sizing starts from a top-down demand pool build that links data center compute growth to accelerator attach and mix by workload, followed by region splits using publicly visible capacity and investment signals. Once that structure is set, we run selective bottom-up checks, such as sampled ASP by accelerator class multiplied by implied unit volumes from channel checks, and supplier-side rollups where disclosure is available.
A few inputs that matter in this market are accelerator mix shifts (GPU versus FPGA versus ASIC), the share of AI training versus inference in deployed clusters, accelerator attach rates in public cloud and colocation builds, HBM and packaging availability that can cap shipments in a given year, and power and cooling readiness that can delay deployments. Forecasting is run using scenario analysis supported by a multivariate regression view, where adoption and pricing are guided by the same drivers above and then pressure-tested with primary feedback. Where bottom-up signals are incomplete, gaps are handled by using range-based ASPs and conservative attach assumptions, which are then rechecked against macro compute and data center expansion indicators.
Data Validation & Update Cycle
Outputs are checked through triangulation across independent signals, so a single data series does not steer the total. We run variance checks by region and by workload, and then investigate outliers like abrupt price jumps or unit growth that conflicts with supply constraint commentary.
Before sign-off, the model is reviewed in steps by another analyst, and follow-up calls are triggered when primary inputs disagree with desk findings or when the implied shipment and revenue pattern looks inconsistent. Reports are refreshed annually, and interim updates are made when material events occur, such as major platform launches, supply shocks, or demand shifts from hyperscale capex changes. Right before delivery, a final pass is done so clients receive the latest updated view.
Mordor Intelligence's Data Center Accelerator Market Estimate Compared With Other Published Estimates
Published market sizes for data center accelerators can look far apart because the category gets defined differently, and the year used for the headline number is not always aligned. The way firms treat CPU-related acceleration, cloud versus enterprise deployments, and pricing inflation assumptions also creates visible gaps.
The benchmark table shows a spread that mainly comes from scope and pricing logic. In Mordor Intelligence's model, the value is tied to data center accelerator processors and solutions across CPU, GPU, FPGA, and ASIC, and it is segmented by workloads such as AI training, AI inference, and HPC rather than counting adjacent server revenue. Some external estimates also lean on aggressive near-term ASP progression and earlier ramp assumptions for constrained components, which can push the current-year figure upward even before deployments fully materialize.
Benchmark comparison
| Source | Market Size | Gaps in Research Methodology |
|---|---|---|
| Mordor Intelligence | USD 14.69 B (2026) | |
| Market Research Publisher A | USD 17.67 B (2024) | Uses a different headline year and commonly applies a faster price and volume ramp into the near term, with cloud data center revenue treatment that can pull in adjacent platform value beyond accelerator-focused revenue. |
| Industry Research Publisher B | USD 8.10 B (2023) | Older reference year and narrower capture of accelerator deployments can understate the step-change from AI training demand, and the model visibility into mix shifts and constraint-led shipment deferrals is typically lighter. |
Taken together, the spread is explained by the year chosen for the headline value, what exactly is counted as an accelerator revenue line, and how quickly pricing and deployments are assumed to move. By keeping the variables traceable to workload demand, deployment models, and supply constraints, our estimate stays repeatable and easier to reconcile with real-world signals.
Key Questions Answered in the Report
How fast is demand for accelerators expected to grow through 2032?
The Data Center Accelerator market is projected to rise at a 13.96% CAGR, more than doubling from USD 12.89 billion in 2025 to USD 32.13 billion by 2032.
Which processor segment will gain the most share by 2032?
ASIC-based accelerators are forecast to post a 15.42% CAGR, narrowing the gap with GPUs for inference-heavy workloads.
Why are enterprises adopting hybrid and edge deployments?
Latency-sensitive 5G, autonomous-vehicle, and industrial-IoT workloads require local inference, driving a 15.72% CAGR for hybrid-edge installations.
What is the biggest restraint facing accelerator suppliers today?
Shortages of advanced packaging substrates such as ABF and CoWoS limit near-term production capacity, dampening shipment growth by an estimated 2.1 percentage points.
Which industry vertical shows the fastest spending growth?
Healthcare and life sciences will lead with a 14.62% CAGR as genomics, drug-discovery, and diagnostic-imaging workflows demand specialized compute.
- Artificial Intelligence (AI) Data Center Market AI facilities across all regions, split by facility type, component and tier.
- Data Center Server Market Servers across all regions, split by tier, facility size and facility type.
- Data Center Cooling Market Global cooling demand, split by cooling technology, cooling component and facility type.
- North America Data Center GPU Market GPUs in North America, split by deployment type, gpu type and interconnect.
- AI Data Center GPU Market AI accelerators across all regions, split by deployment mode, gpu type and interconnect.
- United States Data Center GPU Market GPUs in the US, split by deployment type, gpu type and interconnect.
- Data Center Processor Market Global processors demand, split by processor type, application and deployment model.
- Denmark Data Center Storage Market Storage demand across Denmark, covering facility size and tier.
- North America Data Center Server Market North America servers, split by data-center tier, form factor and application / workload.
- Poland Data Center Networking Market Poland networking, split by component, end-user and data-center type.
- China Data Center Processor Market China's processors, split by facility size and tier.
- Data Center Colocation Market Colocation across the global market, covering solution type, tier and facility size.