
Dallas Data Center Market Size and Share
Market Overview
| Study Period | 2020 - 2031 |
|---|---|
| Forecast Data Period | 2026 - 2031 |
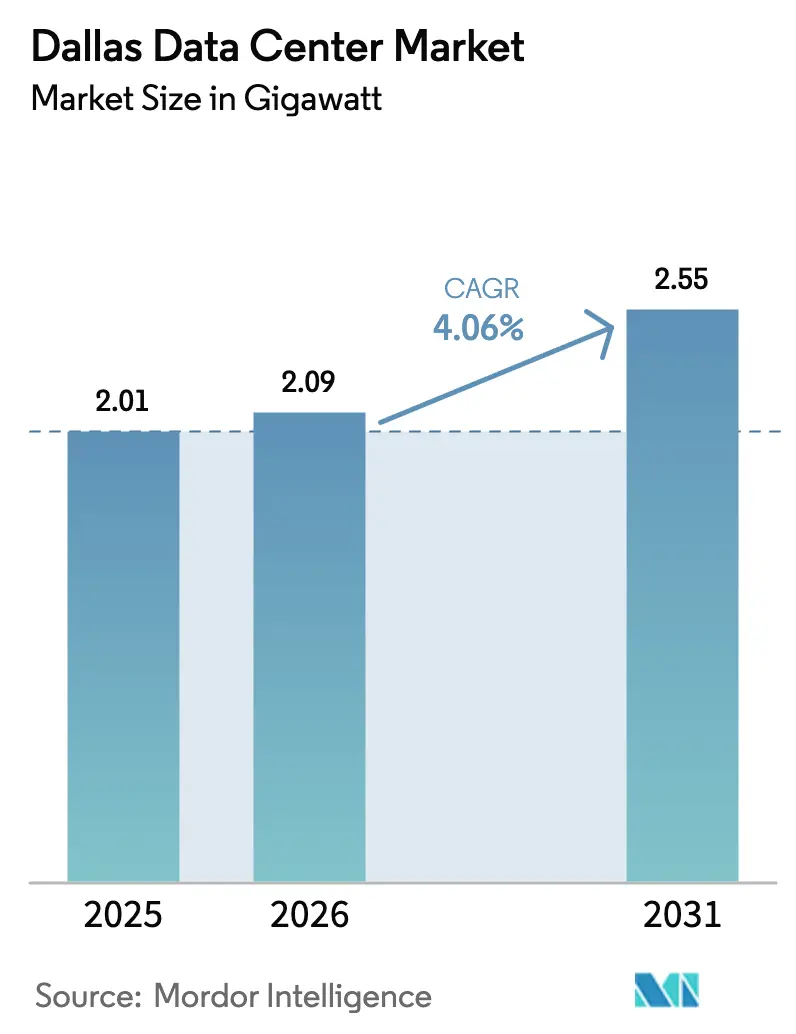
| Base Year Market Size (2025) | 2.01 gigawatt |
| Market Volume (2026) | 2.09 gigawatt |
| Market Volume (2031) | 2.55 gigawatt |
| Growth Rate (2026 - 2031) | 4.06% CAGR |
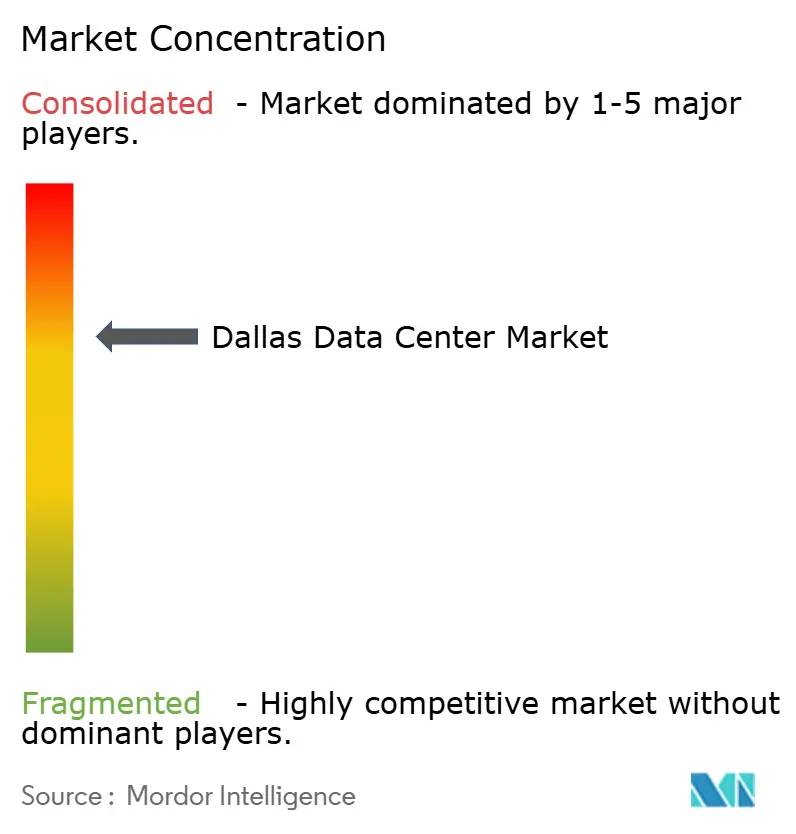
| Market Concentration | Medium |
Major Players *Disclaimer: Major Players sorted in no particular order Image © Mordor Intelligence. Reuse requires attribution under CC BY 4.0. | |
Dallas Data Center Market Analysis by Mordor Intelligence
The Dallas data center market size was valued at 2.01 GW in 2025 and estimated to grow from 2.09 GW in 2026 to reach 2.55 GW by 2031, at a CAGR of 4.06% during the forecast period (2026-2031). Steady growth highlights a maturing landscape in which hyperscale operators co-locate artificial-intelligence workloads with dense fiber routes while adopting behind-the-meter generation to navigate Electric Reliability Council of Texas (ERCOT) constraints. Property-tax abatements under the Jobs, Energy, Technology, and Innovation Act (JETI) continue to sharpen the Dallas area’s cost advantage, and cheap wind-energy power-purchase agreements (PPAs) reduce operating expenses for facilities aligned with sustainability mandates. Competitive intensity is rising as cloud providers bank large land parcels across the metroplex, yet grid volatility and long-term water scarcity compel operators to adopt advanced liquid- and air-cooling technologies to sustain uptime.
Key Report Takeaways
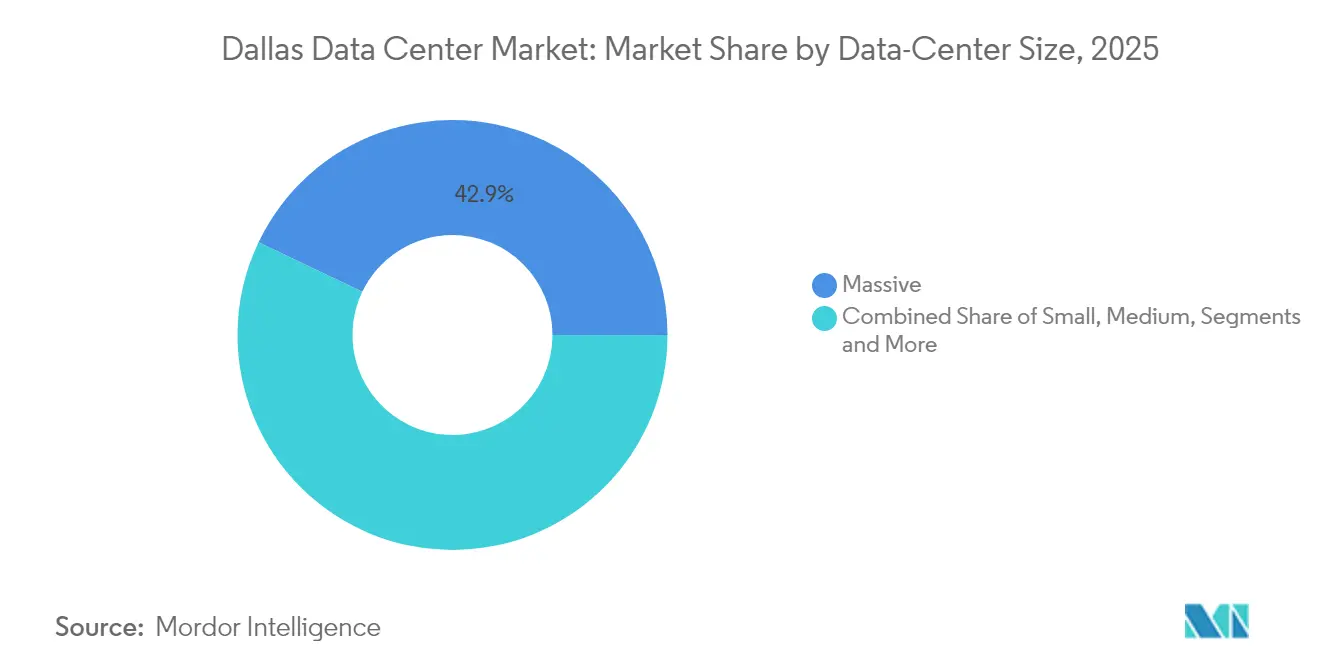
- By data-center size, Massive facilities retained 42.90% of the Dallas data center market share in 2025, while the Mega segment is projected to expand at a 7.35% CAGR through 2031.
- By tier type, Tier 3 held 53.60% of the Dallas data center market size in 2025, whereas Tier 4 infrastructure is poised for the fastest 8.23% CAGR during 2026–2031.
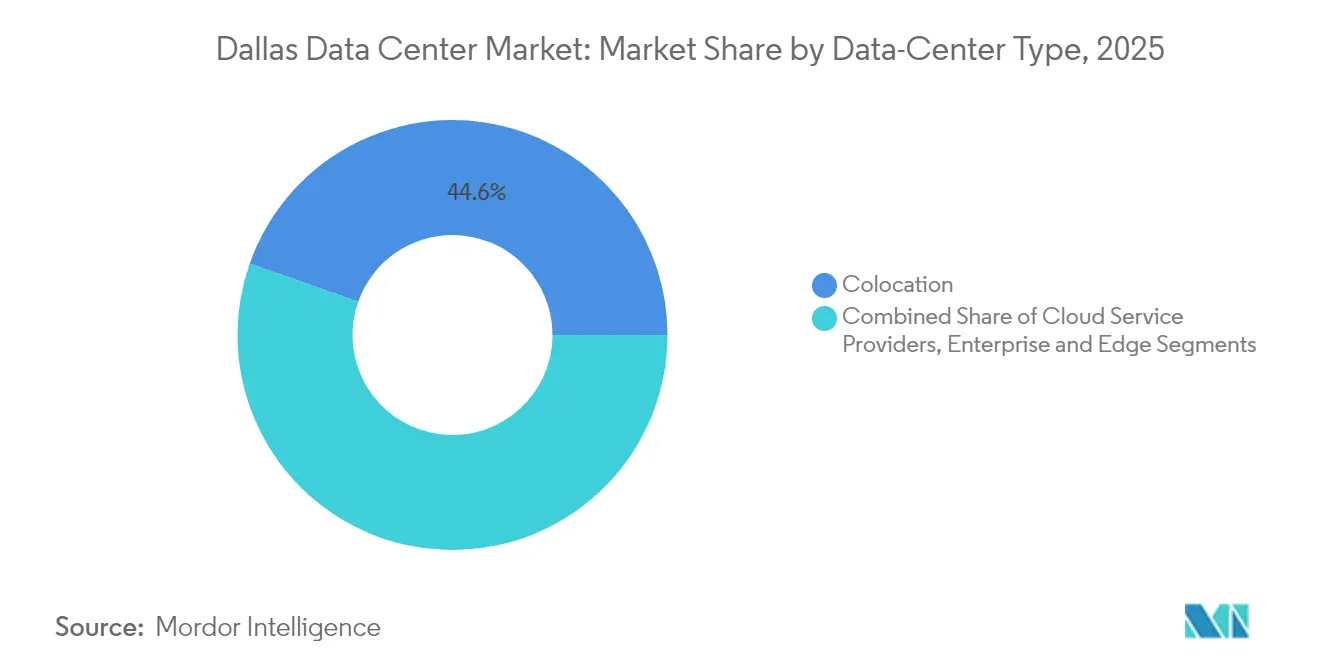
- By data-center type, Colocation services commanded 44.60% of 2025 revenue, yet Cloud Service Providers (CSPs) are forecast to grow at a 6.18% CAGR through 2031.
Note: Market size and forecast figures in this report are generated using Mordor Intelligence’s proprietary estimation framework, updated with the latest available data and insights as of 2026.
Dallas Data Center Market Trends and Insights
Drivers Impact Analysis*
| Driver | (~) % Impact on CAGR Forecast | Geographic Relevance | Impact Timeline |
|---|---|---|---|
| Hyperscaler migration from Dallas & Houston corridors | 1.2% | Dallas-Fort Worth metroplex, spillover to Austin | Medium term (2-4 years) |
| Enterprise cloud off-load from "Silicon Hills" semiconductor expansion | 0.8% | Central Texas, concentrated in Travis Williamson counties | Long term (≥ 4 years) |
| Texas sales- property-tax abatements for mission-critical facilities | 0.6% | Statewide, with highest uptake in Dallas, Austin, San Antonio | Short term (≤ 2 years) |
| Cheap renewable PPAs via ERCOT's congestion-zone reforms | 0.9% | West Texas wind zones connecting to Dallas load centers | Medium term (2-4 years) |
| Increasing edge-compute dem from autonomous-vehicle testing cluster | 0.4% | Dallas-Fort Worth urban core, I-35 corridor | Long term (≥ 4 years) |
| Rapid 5G densification raising micro-edge colocation needs | 0.3% | Metropolitan Dallas, suburban expansion zones | Medium term (2-4 years) |
| Source: Mordor Intelligence | |||
Hyperscaler migration from Dallas & Houston corridors
Hyperscale operators now concentrate deployment in the Dallas data center market to reduce latency across national backbones to leverage richer carrier diversity than Houston offers. Google has assembled more than 2 million ft² across Midlothian Red Oak campuses, while Microsoft is progressing with a four-facility Irving complex.[1]NBC 5 DFW, “Billion-dollar Google data center project comes to Midlothian,” nbcdfw.com This consolidation accelerated after Winter Storm Uri, prompting operators to favor regions with multi-fuel power portfolios stronger transmission interconnections. Subsequent l-banking around substations outside central Dallas indicates a move toward self-generation onsite energy-storage models that insulate workloads from curtailment events.
Enterprise cloud off-load from semiconductor build-out
Texas Instruments’ USD 30 billion Sherman fabrication plant has catalyzed a wave of semiconductor projects in Central Texas, those factories require ultra-low-latency cloud services for process controls.[2]Texas Instruments, “Sherman Fab Expansion Overview,” ti.com Fabricators now contract for dedicated colocation halls within 50 miles of production lines, anchoring new dem along the I-35 corridor between Dallas. AI-enabled manufacturing further multiplies data volumes, making proximity-based capacity a strategic necessity through 2030. Operators that can pair flexible power with sub-5-millisecond latency corridors st to capture long-duration enterprise contracts.
Texas sales- property-tax abatements
JETI’s 50% property-tax relief equipment-sales-tax exemptions slash total project costs up to 20% versus competing states, provided investors spend at least USD 200 million create 20 high-wage jobs.[3]Texas Comptroller, “Jobs, Energy, Technology, Innovation Act Overview,” comptroller.texas.gov Municipalities frequently add local incentives, as seen when Fort Worth approved abatements for ACS Group’s USD 2.1 billion campus, projecting USD 58 million in net new revenue over 10 years . These policies deliver near-term boosts to build pipelines while strengthening Dallas’s sting in site-selection models.
Cheap renewable PPAs via ERCOT reforms
ERCOT congestion-zone changes have unleashed low-cost wind and solar flows from West Texas, enabling PPAs at USD 20–30 per MWh against conventional rates nearer USD 50. Google signed 375 MW of solar PPAs, Digital Realty committed to 70% renewable supply for its Dallas portfolio. Direct contracts bypass utility riders, lowering opex advancing corporate net-zero goals. Mid-sized operators such as Element Critical now replicate this model to remain price-competitive, underscoring renewables as both cost lever customer acquisition tool.
Restraints Impact Analysis*
| Restraint | (~) % Impact on CAGR Forecast | Geographic Relevance | Impact Timeline |
|---|---|---|---|
| Power-grid volatility and curtailment risk | -1.1% | ERCOT service territory, acute in Dallas load zone | Short term (≤ 2 years) |
| Shrinking water table and cooling-water moratoriums | -0.7% | North Central Texas, Edwards Aquifer dependent areas | Medium term (2-4 years) |
| Escalating Williamson- and Travis-County l valuations | -0.5% | Austin-adjacent counties, spillover to Dallas suburbs | Long term (≥ 4 years) |
| Specialized workforce shortage in critical-facility OandM | -0.4% | Regional, concentrated in technical skill gaps | Medium term (2-4 years) |
| Source: Mordor Intelligence | |||
Power-grid volatility and curtailment risk
Peak ERCOT dem could rise 78% by 2030, much of it from the Dallas data center market, raising reserve-margin requirements forcing operators into expensive dem response or onsite generation. Oncor reports 59 GW of data-center load in interconnection queues, foreshadowing longer lead times for feeder upgrades oncor.com. Hyperscalers answer with dedicated gas turbines, fuel cells, battery arrays that keep AI training clusters online when ERCOT issues conservation notices, but smaller providers face capital hurdles that may slow new-build schedules.
Shrinking water table and cooling-water moratoriums
AI clusters can require up to 5 million gal per day of make-up water for evaporative cooling, a consumption rate that strains North Texas aquifers during drought cycles kvue.com. Municipal moratoriums now limit new connections in certain suburbs, compelling operators to shift to closed-loop liquid cooling, direct-to-chip designs, or air-cooled heat exchangers. Microsoft pledges to achieve water-positive operations by 2030, deploying zero-water cooling prototypes that Dallas developers view as a near-term blueprint. Facilities able to cut water intensity can expedite permitting reduce operating costs as utility surcharges rise.
*Our forecasts treat driver/restraint impacts as directional, not additive. The impact forecasts reflect baseline growth, mix effects, and variable interactions.
Segment Analysis
By Data-Center Size: Mega Facilities Drive Next-Generation Capacity
Mega campuses typified by 250–1,000 MW footprints are on pace to lift the Dallas data center market size for large-format builds at a 7.35% CAGR, supported by pledges from Crusoe, DataBank, hyperscale clouds. The segment’s rise follows economic logic: GPU clusters achieve superior power-utilization efficiency simpler network topologies when aggregated at gigawatt scale. Mega-site developers routinely secure l tracts exceeding 500 acres near dual 345-kV transmission loops, then layer in substation upgrades months before ground-breaking to compress energization timelines. Extensive renewable PPAs hedge exposure to ERCOT real-time pricing spikes, giving Mega operators an opex edge that attracts high-density AI tenants.
Massive facilities (100–250 MW) remain the Dallas data center market’s largest cohort with a 42.90% share in 2025 continue to anchor cloud-on-ramp hubs financial-services clusters. Their multi-tenant halls accommodate workloads that cannot tolerate the latency introduced by edge nodes yet do not justify mega-scale capex. Small medium white-space deployments, meanwhile, supply disaster-recovery geo-redundancy roles but face flat dem as enterprises migrate high-compute tasks into hyperscale core regions. Consolidation pressures will likely accelerate acquisitions of older small facilities by REITs seeking bolt-on capacity near fiber corridors.


By Tier Type: Tier 4 Infrastructure Emerges for Mission-Critical AI
Tier 3 platforms secured 53.60% of the Dallas data center market share in 2025, anchored by legacy enterprise tenants that value N+1 redundancy for predictable workloads. New AI models, however, do not tolerate unplanned power events that can corrupt multi-week training runs, propelling Tier 4 dem at an 8.23% CAGR. Tier 4 blueprints deploy 2N power chains, inter-feeds, concurrently maintainable liquid-cooling systems to sustain 99.995% uptime. Edge-case applications such as real-time financial transaction monitoring genomic sequencing also lean toward Tier 4 halls to preserve deterministic latency.
Tier 2 Tier 1 footprints, typically located in light-industrial parks, cater to cost-sensitive back-up, archival, or development workloads. Their future hinges on retrofits that improve energy-use intensity cooling density without inflating lease rates. Many operators repurpose these buildings as edge nodes that backhaul latency-critical packets to Tier 4 cores, leveraging existing permits while circumventing new-build hurdles.
By Data-Center Type: Cloud Service Providers Accelerate Expansion
Colocation services delivered 44.60% of 2025 revenue continue to anchor interconnection ecosystems that attract regional enterprises. Digital Realty’s USD 1.9 billion Garl expansion illustrates the scale at which carrier-neutral llords add wholesale suites meet-me rooms to capture inbound cloud on-ramps. CSP-owned campuses, however, are projected to post a 6.18% CAGR through 2031 as hyperscalers construct fully vertically integrated stacks that optimize everything from rack-level power to firmware, thereby sidestepping colocation’s design compromises. Google’s Midlothian roll-out Microsoft’s Irving platform exemplify this “build-to-own” trajectory.
Enterprise, modular, edge nodes remain relevant in serving 5G densification, autonomous-vehicle telemetry, content-delivery pop-ups. DataBank’s rooftop micro-colocation units reach within 5 miles of consumer clusters, shaving transport latency to sub-10 milliseconds. Such deployments open new revenue avenues yet still funnel bulk storage AI training into hyper-dense CSP centers, reinforcing Dallas’s role as region-wide compute anchor.
Geography Analysis
Dallas proper continues to host the densest fiber meshes, yet l constraints push new hyperscale projects toward suburbs like Garl, Irving, Plano. Suburban parcels supply larger footprints, easier zoning, proximity to 138-kV feeders, allowing rapid energization. The corridor stretching southward through Red Oak Midlothian now attracts mega-facility commitments because of access to dual 345-kV lines room for multi-building campuses. Local municipalities fast-track permitting when projects embed renewable micro-grids or advanced water-recovery systems, positioning these outer rings as prime expansion zones for the Dallas data center market.
Northward, cities such as Allen McKinney win smaller edge-oriented deployments that complement 5G densification the region’s autonomous-vehicle testing cluster. These nodes backhaul heavier compute tasks to Garl or Plano cores, but they reduce round-trip latency enough to satisfy V2X real-time analytics workloads. State highways that follow the I-35 US-75 spines supply redundant dark-fiber routes, giving operators flexibility in routing traffic when congestion or outages strike primary exchanges in downtown Dallas.
Further afield, Abilene Sherman have emerged as greenfield destinations for giga-scale AI clusters seeking cheap wind-energy PPAs vast l banks. While 150 miles from Dallas, these campuses interconnect through long-haul fiber that terminates at Equinix’s Infomart carrier hotel, maintaining network consistency with metro deployments. Their significance will grow as ERCOT completes transmission-line upgrades linking Panhle renewable zones to North Texas load centers, thereby embedding resilience into long-range power flows feeding the Dallas data center market.
Regulatory Landscape
The Dallas data center market operates within Texas and federal frameworks that are tightening around large-load interconnections and how transmission-upgrade costs are allocated. In June 2025, Texas Senate Bill 6 formalized ERCOT's Large Load Interconnection Study (LLIS) process, directing the Public Utility Commission of Texas (PUCT) to determine reasonable shares of transmission-upgrade costs attributable to large loads, with implementation rules progressing during 2026.
Policy focus intensified in June 2026 when Governor Greg Abbott directed the PUCT and ERCOT to deliver recommendations on data center infrastructure costs, electric reliability, and potential legislative changes by July 17, 2026, ahead of the Texas Legislature convening in January 2027. Proposals under discussion include changes to data center tax exemptions, mandatory reporting of electric and water usage, and water-efficient cooling requirements, raising the value of compliant power and water strategies in municipal permitting and site selection across the Dallas-Fort Worth metroplex.
Value Chain Analysis
The Dallas data center value chain starts with site and land banking near substations, then moves through utility and interconnection work, design and EPC delivery, and finally to operations supported by power procurement, cooling systems, and network interconnection (including carrier hotels such as Infomart). Oncor remains a pivotal infrastructure node for grid-connected builds in the metroplex, and the interconnection study and administrative pipeline has become a key gating step for time-to-power in Texas.
As a result, parts of the chain are shifting toward behind-the-meter (BTM) models. Developers increasingly pair campuses with private, dispatchable generation and storage to reduce exposure to ERCOT queue delays and curtailment risk. Financing mechanisms tied to dispatchable capacity, including the Texas Energy Fund (TEF), are gaining relevance as new gas generation is used to anchor data center campuses, which changes procurement priorities toward integrated power, cooling, and energy-management packages rather than utility-only delivery.
Competitive Landscape
Competition in the Dallas data center industry now hinges on power-cost engineering, density-per-rack, and cooling innovation rather than basic square-footage growth. Digital Realty defends leadership through its Infomart hub, Garl campus, citing 300+ carriers' cloud on-ramps. QTS CyrusOne accelerates brownfield conversions in South Dallas-Fort Worth, racing to deliver liquid-cooling pods rated at 70 kW per rack that appeal to GPU cluster operators. Meanwhile, Aligned Data Centers markets its DeltaCube modular heat-exchanger that cuts water use by 80% supports 50 kW racks without chilled water, providing a differentiator in drought-prone micro-markets.
Hyperscale clouds intensify pressure by scooping up farml before permits materialize, locking out competitors from substations with limited spare capacity. Google’s USD 1 billion Midlothian outlay Oracle’s USD 488 million l purchase in Abilene exemplify this strategic l grab. These self-developments bypass REIT middlemen, allowing clouds to dictate PPA structures sustainability metrics that align with corporate transparency goals. Traditional colocation providers respond by bolting advanced cooling retrofits onto existing halls, but retrofit lead times tenant disruptions create strategic risk.
Edge-focused specialists such as DataBank, DartPoints, Vapor IO carve out latency-sensitive niches by integrating tower-based micro data centers with fiber conduits along interstate corridors. This white-space complements, rather than cannibalizes, the mega-scale surge, enabling a stratified ecosystem in which micro nodes service real-time applications while AI model training resides in giga campuses. The result is a moderately concentrated arena where the top five llords capture a slight majority of capacity, yet opportunity remains for innovators that solve water, power, or latency challenges unique to the Dallas data center market.
Dallas Data Center Industry Leaders
Digital Realty Trust, Inc.
CyrusOne LLC
QTS Realty Trust Inc.
DataBank Ltd.
Aligned Data Centers
- *Disclaimer: Major Players sorted in no particular order

Market Opportunities and Future Outlook
Large, financeable campus pipelines in peripheral Dallas submarkets create near-term whitespace for suppliers of high-density capacity, liquid cooling, and power-resilience solutions. DataBank is developing a 480 MW campus in Red Oak (Ellis County), and in April 2026 secured USD 2.0 billion in construction financing for the first three facilities (DFW9, DFW10, and DFW11), totaling 180 MW, which supports continued EPC delivery, electrical gear procurement, and advanced cooling across South Dallas growth corridors.
Regulatory and grid-process changes in Texas are also driving opportunity around time-to-power strategies, including behind-the-meter generation, storage integration, and structured procurement for dispatchable supply. QTS filings for its Wilmer/Lancaster campus expansion, including DFW2 DC2 (USD 300 million, completion June 2026) and additional planned buildings, and CyrusOne's planned DFW7 development in Fort Worth (estimated USD 200 million) point to ongoing expansion beyond the traditional Dallas core. That broadens demand for transmission-adjacent land development, substation-ready site preparation, and water-efficient cooling retrofits tied to emerging reporting and water-use scrutiny.
Recent Industry Developments
- July 2026: Digital Realty and Mitsubishi Corporation formed a joint venture to finance two pre-leased data centers in the Dallas metro area, with development costs reaching up to $800 million. The joint venture expands funding for Dallas capacity and strengthens financing for hyperscale builds. The arrangement diversifies capital sources and accelerates the pace of large scale development in the metroplex.
- July 2026: QTS Realty Trust Inc. filed with the Texas Department of Licensing and Regulation to develop a 363,500 square foot building (DC7) at its DFW2 campus in Lancaster, with construction planned for September 2026. The filing signals near term supply addition at the Dallas campus. The project broadens QTSs Dallas footprint and enhances deployment agility for hyperscale customers.
- April 2026: DataBank Ltd. announced $2.0B in construction financing for the first three data centers (DFW9, DFW10, DFW11) at its 480MW Red Oak campus. The financing enables rapid buildout in South Dallas. The move reinforces the Red Oak campus development and strengthens the financing stack for large scale capacity expansion.


Research Methodology Framework and Report Scope
Market Definition and Coverage
For this study, the Dallas data center market is defined as data center capacity and build out activity located in the Dallas metro area. It covers facilities used for colocation, cloud, enterprise, modular, and edge deployments, measured through power capacity that reflects how sites are planned, built, and leased.
Scope exclusions: This sizing excludes small server rooms inside standard office buildings that are not operated as dedicated data center facilities.
Segmentation Overview
- By Data Center Size
- Small
- Medium
- Large
- Massive
- Mega
- By Tier Type
- Tier 1 and 2
- Tier 3
- Tier 4
- By Data Center Type
- Cloud Service Providers (CSPs)
- Enterprise, Modular and Edge
- Colocation
- Utilized
- Colocation Type
- Retail
- Wholesale
- Hyperscale
- End User
- Cloud and IT
- Telecom
- Media and Entertainment
- Government
- BFSI
- Manufacturing
- E-Commerce
- Other End User
- Colocation Type
- Utilized
Data Sources, Market Sizing, and Validation
Desk Research
Desk research was used to set the starting structure for supply, demand, and constraints in the Dallas metro, and then to set realistic ranges for the main model inputs. Public sources such as the U.S. Energy Information Administration, the U.S. Census Bureau, Federal Reserve Economic Data (FRED), and the U.S. Environmental Protection Agency helped us ground power, construction, and operating context in official time series.
We also reviewed materials like utility and grid planning publications in Texas, planning and permitting information made available by local authorities, and technical references from IEEE and ASHRAE that explain typical power and cooling assumptions used in facility design. In addition, company filings, investor presentations, reputable press coverage, and paid subscriptions focused on company financials and intelligence, patents, and import export shipment records were used selectively to validate major build plans and equipment lead time narratives. The desk research sources listed here are illustrative, and many other public and paid sources were also consulted for data collection, cross checks, and clarification.
Primary Interviews and Surveys
Primary work focused on validating what is actually being delivered and leased in the Dallas area, and what is being delayed due to power and interconnection timing. We spoke with a mix of operators, developers, equipment ecosystem participants, and enterprise users, and those inputs were used to test assumptions on usable MW, commissioning timelines, and the split between retail and wholesale demand.
Distribution of primary research fieldwork respondents
| Company type | Respondent position | Region |
|---|---|---|
| Top tier: 31% | CXOs: 15% | APAC: 52% |
| Mid tier: 49% | Functional/Unit leaders: 40% | EMEA: 29% |
| Smaller Players: 20% | Managers: 45% | Americas: 19% |
Market-Sizing & Forecasting
Sizing starts with a top-down capacity build, where announced and under-development projects are translated into expected delivered MW by year, and then aligned to utilization and preleasing patterns shared by industry participants. Once that demand pool is structured, the totals are corroborated using selective bottom-up checks like sampled site counts by submarket, typical MW per build type, and sanity checks on absorption versus delivered power blocks.
A few Dallas-specific inputs are treated as core model drivers, such as existing IT load and additions under construction, typical prelease rates for large halls, utility interconnection and energization timelines, and the shift toward higher-density racks that can change usable MW per square foot. We also track signals around new land parcels, transformer and switchgear lead times, and the pace of wholesale leasing because these usually explain year-to-year moves better than broad macro indicators.
For forecasting, scenario analysis is used so that power availability and commissioning timelines can be flexed without breaking the overall model. Where bottom-up inputs are incomplete for smaller facilities, gaps are filled using ranges from primary feedback on average MW per site and typical delivery cadence, and then results are rechecked against the pipeline and absorption logic.
Data Validation & Update Cycle
Model outputs are validated through triangulation across independent signals, and then major variances are investigated before numbers are finalized. Checks include comparing implied MW additions against known construction pipelines, reconciling implied absorption with reported preleasing behavior, and reviewing year over year shifts that look too steep given grid and equipment constraints.
A multi-step review is followed, with assumptions reviewed by another analyst and recontact triggers used when a key input changes, such as a major delay in energization, a new large campus announcement, or a visible shift in pricing and leasing terms. Reports refresh annually, with interim updates for material events, and a final pre-delivery pass is done so clients receive the latest view available at the time of publication.
Mordor Intelligence's Dallas Data Center Market Size Measured Against Other Published Estimates
Published market numbers for Dallas data centers often do not line up because the underlying unit is not consistent, and coverage can shift between installed inventory, IT load, and total planned pipeline. On top of that, some sources describe only colocation, while others blend colocation with hyperscale and enterprise capacity.
Retail colocation cabinets and cross-connect heavy views are sometimes presented as the market, which can pull totals away from capacity-based sizing. Another driver is timing, since a report that counts announced campuses early will look larger than one that waits for power secured and commissioning milestones, and currency timing can also move headline values.
Benchmark comparison
| Source | Market Size | Gaps in Research Methodology |
|---|---|---|
| Mordor Intelligence | USD 2.01 B (2025) | |
| Real Estate Advisory A | USD 0.59 B (2024) | Reported as existing colocation inventory in MW, which captures only a subset of facility types and does not map directly to a full market value figure. |
| Market Analytics Publisher B | USD 2.39 B (2024) | Uses total IT capacity as the headline metric and can include a broader set of hyperscale and in-development capacity, which tends to pull forward future supply into the current snapshot. |
Retail-only colocation inventory sits outside Mordor Intelligence's scope when it is reported without enterprise and cloud capacity, which helps explain why some MW snapshots look smaller than the 2025 value shown here. Overall, the spread is mainly explained by what is being counted (inventory versus total IT capacity versus broader facility coverage) and by whether planned capacity is recognized before it is energized, and these differences can be checked with repeatable, practical steps.


Key Questions Answered in the Report
What is the current size of the Dallas data center market?
The Dallas data center market size at 2.09 GW in 2026 is projected to reach 2.55 GW by 2031.
Which data-center size segment is growing the fastest?
Mega facilities, defined as campuses above 250 MW, are forecast to exp at a 7.35% CAGR between 2026 2031 within the Dallas data center market.
Why are hyperscale clouds investing directly in l around Dallas?
L banking allows clouds to secure access to 345-kV transmission, renewable PPAs, favorable tax abatements before grid congestion tightens further
How is ERCOT grid volatility influencing design choices?
Operators add onsite gas turbines, battery storage, liquid cooling to protect AI clusters from curtailment events that have become more frequent in the Dallas load zone.
What sustainability strategies are data-center builders adopting?
Developers increasingly pair West Texas wind PPAs with zero-water or closed-loop liquid-cooling systems to reduce both carbon water footprints.
Which tier classification is gaining traction for AI workloads?
Tier 4 halls are becoming stard for AI training clusters because they deliver 99.995% availability redundant liquid-cooling paths.
Page last updated on:






