| Study Period | 2017 - 2030 |
| Base Year For Estimation | 2024 |
| Forecast Data Period | 2025 - 2030 |
| Market Size (2025) | USD 35.53 Billion |
| Market Size (2030) | USD 59.8 Billion |
| CAGR (2025 - 2030) | 10.97 % |
| Market Concentration | Low |
Major Players*Disclaimer: Major Players sorted in no particular order |

Dairy Alternatives Market Analysis
The Dairy Alternatives Market size is estimated at 35.53 billion USD in 2025, and is expected to reach 59.8 billion USD by 2030, growing at a CAGR of 10.97% during the forecast period (2025-2030).
The dairy alternatives market is experiencing a significant transformation driven by evolving consumer preferences and lifestyle choices. A remarkable shift in consumer behavior is evident as over 65% of global consumers reported consuming dairy alternatives in 2022, indicating a strong mainstream acceptance of these products. This transformation is further supported by the increasing adoption of flexitarian diets, with many consumers incorporating plant-based options into their regular dietary routines. The industry has responded to this demand by expanding product portfolios and improving taste profiles, texture, and nutritional content of dairy alternatives to match or exceed their traditional dairy counterparts.
The distribution landscape for the dairy alternatives market has evolved significantly, with retail channels adapting to changing consumer purchasing patterns. Supermarkets and hypermarkets continue to dominate the sales channels, accounting for more than 60% of overall sales worldwide in 2022, offering consumers the convenience of comparing products and making informed purchasing decisions. The e-commerce sector has emerged as a crucial distribution channel, with retailers increasingly partnering with online platforms to enhance their digital presence. Major retailers are implementing multichannel strategies, with companies like Morrisons, Booths, and Co-op expanding their reach through partnerships with Amazon Fresh and offering same-day delivery services.
Production capabilities and raw material sourcing have become critical factors in meeting the growing demand for dairy alternatives. Japan's significant production capacity is exemplified by its utilization of approximately 67.8 thousand metric tons of soybeans for soy milk production, resulting in 123 thousand kiloliters of soy milk. The United States has established itself as a key player in the raw material supply chain, producing around 2,002,742 tons of almonds annually, which has been instrumental in supporting the growing almond milk segment. This robust supply chain infrastructure has enabled manufacturers to maintain consistent product quality and meet increasing consumer demand.
Innovation in product development continues to drive market expansion, with manufacturers focusing on clean label products and improved nutritional profiles. Companies are investing in research and development to create new formulations that better mimic the taste and texture of traditional dairy products while maintaining their plant-based integrity. The industry has seen a particular focus on developing specialized products for different consumption occasions, from barista-style plant-based milk for coffee shops to protein-enriched varieties for health-conscious consumers. This innovation trend is supported by technological advancements in processing methods and ingredient optimization, leading to improved product stability and sensory characteristics.
Global Dairy Alternatives Market Trends
The increasing vegan population, lactose intolerance, and growing awareness about the health and environmental benefits of dairy alternatives are driving the consumption of different types of dairy alternative products worldwide.
- The consumption of different types of dairy alternative products is increasing worldwide due to a significant increase in the vegan population, coupled with a growing lactose-intolerant population. Even vegan exhibitions/trade shows and music festivals are being conducted in different countries to promote a vegan lifestyle. For example, Australia has the third-highest percentage of vegans per capita globally. As of 2022, 2.5 million were vegans and vegetarians in the country.
- Plant-based milk is the largest consumed category among all dairy alternatives worldwide. Soy milk, almond milk, and oat milk were highly popular and collectively registered more than 70% share in the overall plant milk consumption in 2022. This was due to the increasing prevalence of milk allergies driving demand for plant-based milk worldwide. For example, soy milk is a rich source of vitamins, proteins, and potassium and has a lower calorie content than cow milk. Due to its high nutrient content, it is considered an ideal substitute for dairy products.
- There is a huge demand for non-dairy cheese varieties, such as plant-based cheese, especially sliced cheese, with great sales value in several countries. Spanish and German consumers reveal the highest readiness to eat plant-based cheese instead of conventional ones. For instance, German consumers prefer plant-based cream cheese (32%), sliced cheese (32%), and plant-based mozzarella (31%) available in supermarkets. With the growing demand for new plant-based dairy innovations, the consumption of dairy alternatives is anticipated to increase further during the forecast period.

Understand The Key Trends Shaping This Market
Download PDF
OTHER KEY INDUSTRY TRENDS COVERED IN THE REPORT
- The increasing consumer preference for vegan food, coupled with manufacturers' focus on new product innovations, has led to an increase in production of raw materials for dairy alternatives, such as soybeans, coconut, oats, almonds, and cashew nuts.
Segment Analysis: Category
Non-Dairy Milk Segment in Global Dairy Alternatives Market
Non-dairy milk dominates the global dairy alternatives market, accounting for approximately 51% of the market share in 2024. The segment's strong position is driven by increasing consumer preference for dairy-free milk alternatives like soy milk, almond milk, and oat milk. Soy milk leads the plant-based milk category due to its high protein content and nutritional benefits, while almond milk and oat milk are gaining popularity due to their taste profiles and sustainability credentials. The growth is particularly notable in the Asia-Pacific and North American regions, where rising health consciousness and lactose intolerance among consumers are driving adoption. Major retailers and coffee chains are expanding their plant-based milk offerings, making these products more accessible to mainstream consumers.
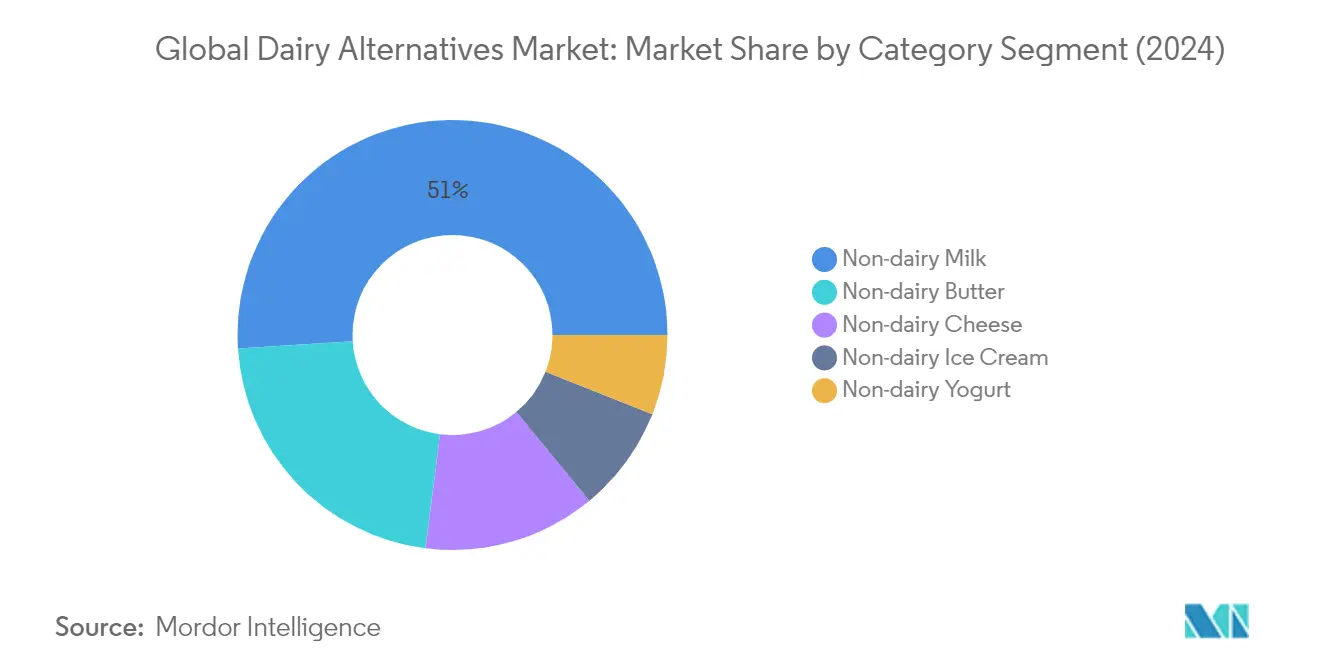
Non-Dairy Cheese Segment in Global Dairy Alternatives Market
The non-dairy cheese segment is emerging as the fastest-growing category in the dairy alternatives products market, projected to grow at approximately 22% annually from 2024 to 2029. This remarkable growth is fueled by continuous product innovations and improvements in taste and texture profiles that more closely mimic traditional dairy cheese. Manufacturers are introducing various formats, including slices, shreds, blocks, and spreads, to cater to different culinary applications. The segment's expansion is particularly strong in Europe and North America, where around 67% of consumers in countries like Belgium and the United Kingdom show high penetration rates for plant-based cheese consumption. The growth is further supported by increasing flexitarian consumers and rising awareness about the environmental impact of traditional dairy production.
Remaining Segments in Dairy Alternatives Market
The dairy alternatives market also encompasses non-dairy butter, non-dairy ice cream, and non-dairy yogurt segments, each serving distinct consumer needs and preferences. Non-dairy butter alternatives are gaining traction due to their lower saturated fat content and environmental benefits compared to traditional dairy butter. The non-dairy ice cream segment is experiencing growth driven by innovative flavors and improved textures, particularly appealing to health-conscious consumers and those with dietary restrictions. Non-dairy yogurt alternatives are expanding their presence through various flavors and formats, including Greek-style variants and probiotic-enriched options, catering to the growing demand for functional food products.
Segment Analysis: Distribution Channel
Off-Trade Segment in Global Dairy Alternatives Market
The off-trade distribution channel dominates the global dairy alternatives market, with supermarkets and hypermarkets being the primary sales channels. In 2024, the off-trade segment is expected to account for approximately 90% of the total market value. This significant market share can be attributed to the widespread network of retail stores, easy accessibility, and the ability to offer a diverse range of dairy substitutes under one roof. Within the off-trade segment, supermarkets and hypermarkets hold the largest share at around 60% of sales, as these stores provide consumers with various benefits, including bulk purchase options, seasonal discounts, and dedicated sections for dairy-free products that enhance the shopping experience.
Online Retail Segment in Global Dairy Alternatives Market
The online retail channel is emerging as the fastest-growing segment in the dairy alternatives market, projected to experience robust growth between 2024 and 2029. This channel's rapid expansion is driven by increasing smartphone penetration, widespread internet accessibility, and evolving consumer preferences for convenient shopping options. The growth is particularly pronounced in regions with high e-commerce adoption rates, such as North America and Europe, where around 68% of individuals ordered food products online in 2024. Online retailers are strengthening their position by offering exclusive deals, subscription services, and enhanced delivery options, while also providing detailed product information and customer reviews that help consumers make informed purchasing decisions.
Remaining Segments in Distribution Channel
The remaining distribution channels include on-trade establishments, convenience stores, and specialist retailers, each serving distinct consumer needs in the dairy alternatives market. The on-trade segment, comprising restaurants, cafes, and food service outlets, plays a crucial role in introducing consumers to dairy-free products through beverages and prepared foods. Convenience stores offer accessibility and quick purchase options for consumers seeking dairy alternatives during non-traditional shopping hours, while specialist retailers provide a curated selection of premium and niche dairy substitutes, often catering to specific dietary requirements and preferences.
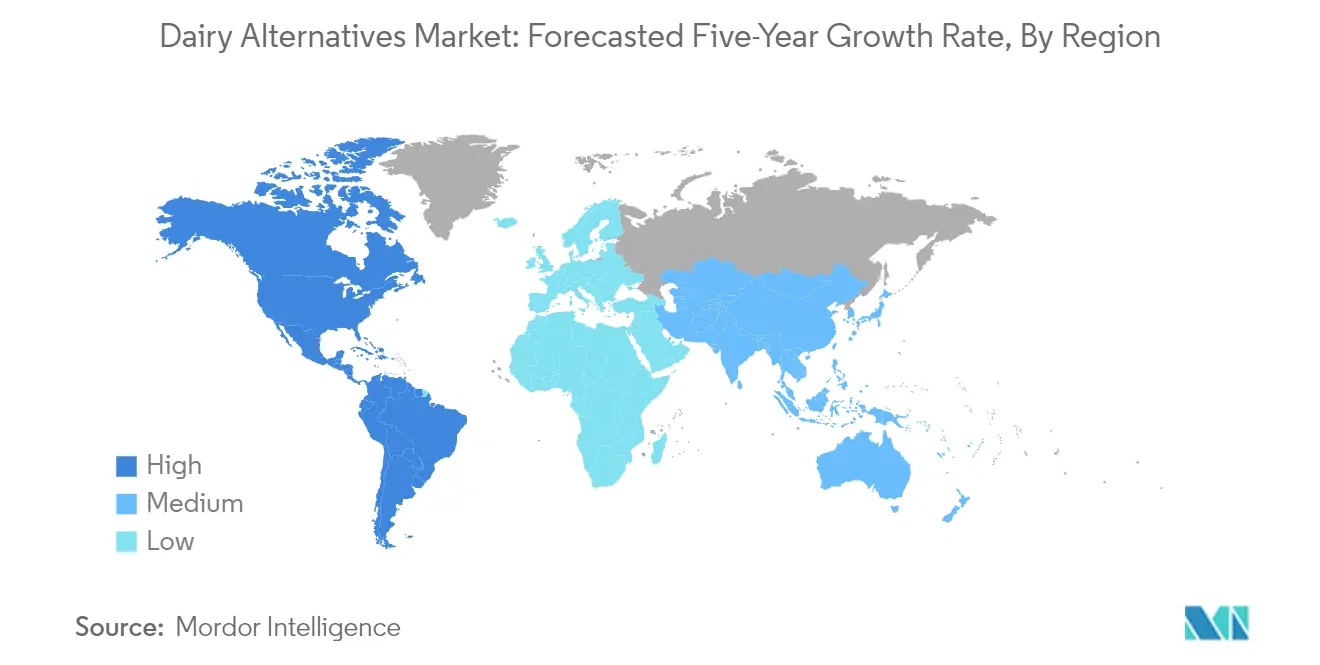
Dairy Alternatives Market Geography Segment Analysis
Dairy Alternatives Market in Africa
The African dairy alternatives market is experiencing significant growth driven by increasing health consciousness and the rising adoption of plant-based diets. The region's market dynamics are primarily shaped by countries like Egypt, Nigeria, and South Africa, each contributing uniquely to the market's development. The growth is supported by various factors, including the rising prevalence of lactose intolerance, a growing vegan population, and increasing consumer awareness about the health benefits of dairy alternatives.
Dairy Alternatives Market in South Africa
South Africa dominates the African dairy alternatives market, holding approximately 40% market share in 2024. The country's market leadership is driven by strong distribution networks and an increasing consumer preference for plant-based products. The market is characterized by a robust retail infrastructure and growing health consciousness among consumers. South African consumers are increasingly adopting dairy alternatives due to rising awareness about lactose intolerance and the health benefits associated with plant-based products. The country has also seen significant investments in product innovation and marketing campaigns promoting dairy alternatives.
Dairy Alternatives Market in Nigeria
Nigeria represents the fastest-growing market for dairy alternatives in Africa, with an expected growth rate of approximately 8% during 2024-2029. The growth is primarily driven by increasing urbanization and rising disposable income levels. Nigerian consumers are showing increasing interest in plant-based alternatives, particularly among the younger population. The country's market is witnessing the rapid expansion of modern retail formats and improving distribution networks, which is facilitating better access to dairy alternative products. The market is also benefiting from increasing awareness about lactose intolerance and the health benefits associated with plant-based diets.
Dairy Alternatives Market in Asia-Pacific
The Asia-Pacific region represents a significant market for dairy alternatives, with diverse consumer preferences and consumption patterns across different countries. The market encompasses major economies like China, Japan, and South Korea, as well as emerging markets such as India, Indonesia, and Malaysia. The region's growth is driven by factors such as increasing health consciousness, rising disposable incomes, and growing awareness about lactose intolerance. The market is also benefiting from strong distribution networks and innovative product launches.
Dairy Alternatives Market in China
China leads the Asia-Pacific dairy alternatives market, commanding approximately 45% market share in 2024. The country's dominance is attributed to its large consumer base and well-established distribution networks. Chinese consumers are increasingly adopting dairy alternatives due to high lactose intolerance rates and growing health consciousness. The market is characterized by a strong presence of both international and domestic players, offering a wide range of plant-based products. The country's robust e-commerce infrastructure has also played a crucial role in market growth.
Dairy Alternatives Market in India
India emerges as the fastest-growing market in the Asia-Pacific region, with an expected growth rate of approximately 10% during 2024-2029. The growth is driven by increasing urbanization, rising health consciousness, and a growing vegan population. Indian consumers are increasingly adopting dairy alternatives due to rising awareness about health benefits and environmental concerns. The market is witnessing significant investments in product innovation and marketing initiatives. The country's strong traditional vegetarian culture provides a favorable environment for the growth of dairy alternatives.
Dairy Alternatives Market in Europe
The European dairy alternatives market demonstrates strong growth potential, supported by increasing consumer awareness about health and sustainability. The region encompasses major markets including Germany, France, the UK, and Italy, as well as emerging markets like Russia and Turkey. Consumer preferences vary significantly across different countries, influencing product development and marketing strategies. The market is characterized by a strong presence of established players and continuous product innovations.
Dairy Alternatives Market in Germany
Germany maintains its position as the largest market for dairy alternatives in Europe. The country's market leadership is attributed to high consumer awareness about plant-based products and strong retail infrastructure. German consumers show a strong preference for organic and sustainable products, driving market growth. The country has a well-developed distribution network and a strong presence of both domestic and international players.
Dairy Alternatives Market in Russia
Russia emerges as the fastest-growing market for dairy alternatives in Europe. The growth is driven by increasing health consciousness and rising adoption of plant-based diets. Russian consumers are showing increasing interest in dairy alternatives, particularly in urban areas. The market is witnessing significant investments in product development and marketing initiatives. The country's improving retail infrastructure and distribution networks are supporting market growth.
Dairy Alternatives Market in Middle East
The Middle Eastern dairy alternatives market shows promising growth potential, with increasing consumer awareness about health benefits and rising adoption of plant-based diets. The region encompasses various markets including Saudi Arabia, UAE, Iran, Kuwait, Bahrain, Qatar, and Oman. Saudi Arabia leads the market in terms of size, while Iran demonstrates the fastest growth rate. The market is characterized by a strong presence of international brands and growing domestic production capabilities. Consumer preferences are increasingly shifting towards healthier alternatives, supported by rising health consciousness and growing awareness about lactose intolerance.
Dairy Alternatives Market in North America
The North American dairy alternatives market demonstrates robust growth, driven by increasing consumer preference for plant-based products and rising health consciousness. The region, comprising the United States, Canada, and Mexico, shows diverse consumer preferences and consumption patterns. The US dairy alternatives market leads the market in terms of size, while Mexico shows the fastest growth rate. The market is characterized by a strong presence of established players, continuous product innovations, and well-developed distribution networks. Consumer awareness about health benefits and environmental sustainability continues to drive market growth across the region.
Dairy Alternatives Market in South America
The South American dairy alternatives market shows significant growth potential, driven by increasing health consciousness and rising adoption of plant-based diets. The region, primarily represented by Brazil and Argentina, demonstrates evolving consumer preferences and growing awareness about dairy alternatives. Brazil leads the market in terms of size, while Argentina shows the fastest growth rate. The market is characterized by increasing investments in product development and marketing initiatives. Consumer awareness about health benefits and environmental sustainability continues to drive market growth, supported by improving distribution networks and retail infrastructure.
Get Analysis on Important Geographic Markets
Download PDF
Dairy Alternatives Industry Overview
Top Companies in Dairy Alternatives Market
The dairy alternatives market is characterized by continuous product innovation and strategic expansion initiatives by leading players like Danone SA, Hebei Yangyuan Zhihui Beverage Co. Ltd, Blue Diamond Growers, and Oatly Group AB. Companies are focusing on developing new plant-based formulations, particularly in milk alternatives like oat, almond, and soy varieties, while also expanding into adjacent categories like non-dairy cheese and yogurt. Operational agility is demonstrated through investments in dedicated manufacturing facilities and R&D centers to support product development and meet growing consumer demand. Strategic moves include partnerships with foodservice operators and retail chains to enhance distribution networks, while geographical expansion is pursued through both organic growth and acquisitions. Companies are particularly targeting emerging markets in Asia-Pacific and establishing regional production facilities to better serve local markets and optimize supply chains.
Global Leaders Dominate Fragmented Market Structure
The dairy alternatives market exhibits a fragmented competitive structure with a mix of global conglomerates and specialized plant-based manufacturers. Large multinational companies like Danone SA leverage their extensive distribution networks and brand portfolios to maintain market leadership, while regional players such as Hebei Yangyuan focus on dominating specific geographical markets through deep local market understanding and tailored product offerings. The market is witnessing increased participation from both established dairy companies diversifying into plant-based alternatives and pure-play alternative protein companies.
The industry is experiencing active merger and acquisition activity as companies seek to expand their plant-based portfolios and geographical presence. Large players are acquiring innovative start-ups to gain access to new technologies and product formulations, while also establishing strategic partnerships to strengthen their market position. Cross-border acquisitions are becoming more common as companies aim to establish a presence in high-growth markets, particularly in Asia-Pacific and Europe, where consumer demand for dairy alternatives is rapidly growing.
Innovation and Distribution Key to Growth
Success in the dairy and dairy alternatives market increasingly depends on companies' ability to innovate across product formulations, packaging, and marketing strategies. Manufacturers need to focus on improving taste profiles and nutritional content while maintaining clean label credentials to meet evolving consumer preferences. Building strong relationships with retailers and foodservice operators is crucial for market penetration, as is developing efficient cold chain logistics capabilities. Companies must also invest in sustainability initiatives and transparent supply chains to address growing environmental concerns among consumers.
Future market success will require companies to navigate potential regulatory changes regarding labeling and nutritional claims while maintaining product differentiation in an increasingly crowded market. Manufacturers need to develop strategies to address price sensitivity while maintaining margins, particularly as raw material costs fluctuate. Building direct-to-consumer channels and establishing a strong online presence will become increasingly important for market success. Companies must also focus on educational marketing to increase consumer awareness about the benefits of dairy alternatives and expand the overall market size while maintaining their competitive position.
Dairy Alternatives Market Leaders
-
Blue Diamond Growers
-
Danone SA
-
Hebei Yangyuan Zhihui Beverage Co. Ltd
-
Oatly Group AB
-
Saputo Inc.
- *Disclaimer: Major Players sorted in no particular order

Need More Details on Market Players and Competitors?
Download PDF
Dairy Alternatives Market News
- November 2022: Oatly Group AB announced that it would release a new range of oat-based yogurt. The new range comes in four flavors: strawberry, blueberry, plain, and Greek style.
- October 2022: Sheese launched two new vegan cheese products in the United Kingdom, namely, Sheese Italiano and Sheese Mighty Melter.
- October 2022: Vitasoy International Holdings Ltd planned to expand its dairy alternative business by acquiring the shares from its joint venture Bega Cheese subsidiary National Food Holdings Ltd.
Free With This Report
We provide a comprehensive and exhaustive set of data pointers for global, regional, and country-level metrics that illustrate the fundamentals of the dairy alternatives industry. With the help of 45+ free charts, clients can access in-depth market analysis based on per capita consumption numbers and production data of raw materials for dairy alternatives, through granular level segmental information supported by a repository of market data, trends, and expert analysis. Data and analysis on dairy alternative products, categories of dairy alternative products, product types, etc., are available in the form of comprehensive reports as well as excel based data worksheets.


Dairy Alternatives Market Report - Table of Contents
1. EXECUTIVE SUMMARY & KEY FINDINGS
2. REPORT OFFERS
3. INTRODUCTION
- 3.1 Study Assumptions & Market Definition
- 3.2 Scope of the Study
- 3.3 Research Methodology
4. KEY INDUSTRY TRENDS
- 4.1 Per Capita Consumption
-
4.2 Raw Material/commodity Production
- 4.2.1 Dairy Alternative - Raw Material Production
-
4.3 Regulatory Framework
- 4.3.1 Australia
- 4.3.2 Canada
- 4.3.3 China
- 4.3.4 Egypt
- 4.3.5 France
- 4.3.6 Germany
- 4.3.7 India
- 4.3.8 Italy
- 4.3.9 Japan
- 4.3.10 Mexico
- 4.3.11 Saudi Arabia
- 4.3.12 South Africa
- 4.3.13 South Korea
- 4.3.14 United Arab Emirates
- 4.3.15 United Kingdom
- 4.3.16 United States
- 4.4 Value Chain & Distribution Channel Analysis
5. MARKET SEGMENTATION (includes market size in Value in USD and Volume, Forecasts up to 2030 and analysis of growth prospects)
-
5.1 Category
- 5.1.1 Non-Dairy Butter
- 5.1.2 Non-Dairy Cheese
- 5.1.3 Non-Dairy Ice Cream
- 5.1.4 Non-Dairy Milk
- 5.1.4.1 By Product Type
- 5.1.4.1.1 Almond Milk
- 5.1.4.1.2 Cashew Milk
- 5.1.4.1.3 Coconut Milk
- 5.1.4.1.4 Hazelnut Milk
- 5.1.4.1.5 Hemp Milk
- 5.1.4.1.6 Oat Milk
- 5.1.4.1.7 Soy Milk
- 5.1.5 Non-Dairy Yogurt
-
5.2 Distribution Channel
- 5.2.1 Off-Trade
- 5.2.1.1 Convenience Stores
- 5.2.1.2 Online Retail
- 5.2.1.3 Specialist Retailers
- 5.2.1.4 Supermarkets and Hypermarkets
- 5.2.1.5 Others (Warehouse clubs, gas stations, etc.)
- 5.2.2 On-Trade
-
5.3 Region
- 5.3.1 Africa
- 5.3.1.1 By Category
- 5.3.1.2 By Distribution Channel
- 5.3.1.3 By Country
- 5.3.1.3.1 Egypt
- 5.3.1.3.2 Nigeria
- 5.3.1.3.3 South Africa
- 5.3.1.3.4 Rest of Africa
- 5.3.2 Asia-Pacific
- 5.3.2.1 By Category
- 5.3.2.2 By Distribution Channel
- 5.3.2.3 By Country
- 5.3.2.3.1 Australia
- 5.3.2.3.2 China
- 5.3.2.3.3 India
- 5.3.2.3.4 Indonesia
- 5.3.2.3.5 Japan
- 5.3.2.3.6 Malaysia
- 5.3.2.3.7 New Zealand
- 5.3.2.3.8 Pakistan
- 5.3.2.3.9 South Korea
- 5.3.2.3.10 Rest of Asia Pacific
- 5.3.3 Europe
- 5.3.3.1 By Category
- 5.3.3.2 By Distribution Channel
- 5.3.3.3 By Country
- 5.3.3.3.1 Belgium
- 5.3.3.3.2 France
- 5.3.3.3.3 Germany
- 5.3.3.3.4 Italy
- 5.3.3.3.5 Netherlands
- 5.3.3.3.6 Russia
- 5.3.3.3.7 Spain
- 5.3.3.3.8 Turkey
- 5.3.3.3.9 United Kingdom
- 5.3.3.3.10 Rest of Europe
- 5.3.4 Middle East
- 5.3.4.1 By Category
- 5.3.4.2 By Distribution Channel
- 5.3.4.3 By Country
- 5.3.4.3.1 Bahrain
- 5.3.4.3.2 Iran
- 5.3.4.3.3 Kuwait
- 5.3.4.3.4 Oman
- 5.3.4.3.5 Qatar
- 5.3.4.3.6 Saudi Arabia
- 5.3.4.3.7 United Arab Emirates
- 5.3.4.3.8 Rest of Middle East
- 5.3.5 North America
- 5.3.5.1 By Category
- 5.3.5.2 By Distribution Channel
- 5.3.5.3 By Country
- 5.3.5.3.1 Canada
- 5.3.5.3.2 Mexico
- 5.3.5.3.3 United States
- 5.3.5.3.4 Rest of North America
- 5.3.6 South America
- 5.3.6.1 By Category
- 5.3.6.2 By Distribution Channel
- 5.3.6.3 By Country
- 5.3.6.3.1 Argentina
- 5.3.6.3.2 Brazil
- 5.3.6.3.3 Rest of South America
6. COMPETITIVE LANDSCAPE
- 6.1 Key Strategic Moves
- 6.2 Market Share Analysis
- 6.3 Company Landscape
-
6.4 Company Profiles (includes Global Level Overview, Market Level Overview, Core Business Segments, Financials, Headcount, Key Information, Market Rank, Market Share, Products and Services, and Analysis of Recent Developments).
- 6.4.1 Blue Diamond Growers
- 6.4.2 Califia Farms LLC
- 6.4.3 Danone SA
- 6.4.4 Hebei Yangyuan Zhihui Beverage Co. Ltd
- 6.4.5 Oatly Group AB
- 6.4.6 Otsuka Holdings Co. Ltd
- 6.4.7 Sahmyook Foods
- 6.4.8 Saputo Inc.
- 6.4.9 The Hain Celestial Group Inc.
- 6.4.10 VBites Foods Ltd
- 6.4.11 Vitasoy International Holdings Ltd
7. KEY STRATEGIC QUESTIONS FOR DAIRY AND DAIRY ALTERNATIVE CEOS
8. APPENDIX
-
8.1 Global Overview
- 8.1.1 Overview
- 8.1.2 Porter’s Five Forces Framework
- 8.1.3 Global Value Chain Analysis
- 8.1.4 Market Dynamics (DROs)
- 8.2 Sources & References
- 8.3 List of Tables & Figures
- 8.4 Primary Insights
- 8.5 Data Pack
- 8.6 Glossary of Terms
You Can Purchase Parts Of This Report. Check Out Prices For Specific Sections
Get Price Break-up Now
List of Tables & Figures
- Figure 1:
- PER CAPITA CONSUMPTION OF DAIRY ALTERNATIVES, KG, GLOBAL, 2017 - 2029
- Figure 2:
- PRODUCTION VOLUME OF GLOBAL DAIRY ALTERNATIVES MARKET - RAW MATERIAL, METRIC TONNES, GLOBAL, 2017 - 2021
- Figure 3:
- VOLUME OF DAIRY ALTERNATIVES, METRIC TONNES, BY GLOBAL, 2017 - 2029
- Figure 4:
- VALUE OF DAIRY ALTERNATIVES, USD MN, BY GLOBAL, 2017 - 2029
- Figure 5:
- VOLUME OF DAIRY ALTERNATIVES MARKET BY CATEGORY, METRIC TONNES, GLOBAL, 2017 - 2029
- Figure 6:
- VALUE OF DAIRY ALTERNATIVES MARKET BY CATEGORY, USD MN, GLOBAL, 2017 - 2029
- Figure 7:
- VOLUME SHARE OF DAIRY ALTERNATIVES MARKET, BY CATEGORY , %, GLOBAL, 2017 VS 2023 VS 2029
- Figure 8:
- VALUE SHARE OF DAIRY ALTERNATIVES MARKET, BY CATEGORY , %, GLOBAL, 2017 VS 2023 VS 2029
- Figure 9:
- VOLUME OF MILK MARKET BY PRODUCT TYPE, METRIC TONNES, GLOBAL, 2017 - 2029
- Figure 10:
- VALUE OF MILK MARKET BY PRODUCT TYPE, USD MN, GLOBAL, 2017 - 2029
- Figure 11:
- VOLUME SHARE OF MILK MARKET BY PRODUCT TYPE, %, GLOBAL, 2017 VS 2023 VS 2029
- Figure 12:
- VALUE SHARE OF MILK MARKET BY PRODUCT TYPE, %, GLOBAL, 2017 VS 2023 VS 2029
- Figure 13:
- VOLUME OF NON-DAIRY BUTTER MARKET, METRIC TONNES, GLOBAL, 2017 - 2029
- Figure 14:
- VALUE OF NON-DAIRY BUTTER MARKET, USD MN, GLOBAL, 2017 - 2029
- Figure 15:
- VALUE SHARE OF NON-DAIRY BUTTER MARKET, BY DISTRIBUTION CHANNEL, %, GLOBAL, 2022 VS 2029
- Figure 16:
- VOLUME OF NON-DAIRY CHEESE MARKET, METRIC TONNES, GLOBAL, 2017 - 2029
- Figure 17:
- VALUE OF NON-DAIRY CHEESE MARKET, USD MN, GLOBAL, 2017 - 2029
- Figure 18:
- VALUE SHARE OF NON-DAIRY CHEESE MARKET, BY DISTRIBUTION CHANNEL, %, GLOBAL, 2022 VS 2029
- Figure 19:
- VOLUME OF NON-DAIRY ICE CREAM MARKET, METRIC TONNES, GLOBAL, 2017 - 2029
- Figure 20:
- VALUE OF NON-DAIRY ICE CREAM MARKET, USD MN, GLOBAL, 2017 - 2029
- Figure 21:
- VALUE SHARE OF NON-DAIRY ICE CREAM MARKET, BY DISTRIBUTION CHANNEL, %, GLOBAL, 2022 VS 2029
- Figure 22:
- VOLUME OF NON-DAIRY MILK MARKET BY PRODUCT TYPE, METRIC TONNES, GLOBAL, 2017 - 2029
- Figure 23:
- VALUE OF NON-DAIRY MILK MARKET BY PRODUCT TYPE, USD MN, GLOBAL, 2017 - 2029
- Figure 24:
- VOLUME SHARE OF NON-DAIRY MILK MARKET BY PRODUCT TYPE, %, GLOBAL, 2017 VS 2023 VS 2029
- Figure 25:
- VALUE SHARE OF NON-DAIRY MILK MARKET BY PRODUCT TYPE, %, GLOBAL, 2017 VS 2023 VS 2029
- Figure 26:
- VOLUME OF ALMOND MILK MARKET, METRIC TONNES, GLOBAL, 2017 - 2029
- Figure 27:
- VALUE OF ALMOND MILK MARKET, USD MN, GLOBAL, 2017 - 2029
- Figure 28:
- VALUE SHARE OF ALMOND MILK MARKET, BY DISTRIBUTION CHANNEL, %, GLOBAL, 2022 VS 2029
- Figure 29:
- VOLUME OF CASHEW MILK MARKET, METRIC TONNES, GLOBAL, 2017 - 2029
- Figure 30:
- VALUE OF CASHEW MILK MARKET, USD MN, GLOBAL, 2017 - 2029
- Figure 31:
- VALUE SHARE OF CASHEW MILK MARKET, BY DISTRIBUTION CHANNEL, %, GLOBAL, 2022 VS 2029
- Figure 32:
- VOLUME OF COCONUT MILK MARKET, METRIC TONNES, GLOBAL, 2017 - 2029
- Figure 33:
- VALUE OF COCONUT MILK MARKET, USD MN, GLOBAL, 2017 - 2029
- Figure 34:
- VALUE SHARE OF COCONUT MILK MARKET, BY DISTRIBUTION CHANNEL, %, GLOBAL, 2022 VS 2029
- Figure 35:
- VOLUME OF HAZELNUT MILK MARKET, METRIC TONNES, GLOBAL, 2017 - 2029
- Figure 36:
- VALUE OF HAZELNUT MILK MARKET, USD MN, GLOBAL, 2017 - 2029
- Figure 37:
- VALUE SHARE OF HAZELNUT MILK MARKET, BY DISTRIBUTION CHANNEL, %, GLOBAL, 2022 VS 2029
- Figure 38:
- VOLUME OF HEMP MILK MARKET, METRIC TONNES, GLOBAL, 2017 - 2029
- Figure 39:
- VALUE OF HEMP MILK MARKET, USD MN, GLOBAL, 2017 - 2029
- Figure 40:
- VALUE SHARE OF HEMP MILK MARKET, BY DISTRIBUTION CHANNEL, %, GLOBAL, 2022 VS 2029
- Figure 41:
- VOLUME OF OAT MILK MARKET, METRIC TONNES, GLOBAL, 2017 - 2029
- Figure 42:
- VALUE OF OAT MILK MARKET, USD MN, GLOBAL, 2017 - 2029
- Figure 43:
- VALUE SHARE OF OAT MILK MARKET, BY DISTRIBUTION CHANNEL, %, GLOBAL, 2022 VS 2029
- Figure 44:
- VOLUME OF SOY MILK MARKET, METRIC TONNES, GLOBAL, 2017 - 2029
- Figure 45:
- VALUE OF SOY MILK MARKET, USD MN, GLOBAL, 2017 - 2029
- Figure 46:
- VALUE SHARE OF SOY MILK MARKET, BY DISTRIBUTION CHANNEL, %, GLOBAL, 2022 VS 2029
- Figure 47:
- VOLUME OF NON-DAIRY YOGURT MARKET, METRIC TONNES, GLOBAL, 2017 - 2029
- Figure 48:
- VALUE OF NON-DAIRY YOGURT MARKET, USD MN, GLOBAL, 2017 - 2029
- Figure 49:
- VALUE SHARE OF NON-DAIRY YOGURT MARKET, BY DISTRIBUTION CHANNEL, %, GLOBAL, 2022 VS 2029
- Figure 50:
- VOLUME OF DAIRY ALTERNATIVES MARKET BY DISTRIBUTION CHANNEL, METRIC TONNES, GLOBAL, 2017 - 2029
- Figure 51:
- VALUE OF DAIRY ALTERNATIVES MARKET BY DISTRIBUTION CHANNEL, USD MN, GLOBAL, 2017 - 2029
- Figure 52:
- VOLUME SHARE OF DAIRY ALTERNATIVES MARKET, BY DISTRIBUTION CHANNEL , %, GLOBAL, 2017 VS 2023 VS 2029
- Figure 53:
- VALUE SHARE OF DAIRY ALTERNATIVES MARKET, BY DISTRIBUTION CHANNEL , %, GLOBAL, 2017 VS 2023 VS 2029
- Figure 54:
- VOLUME OF DAIRY ALTERNATIVES MARKET BY SUB DISTRIBUTION CHANNELS, METRIC TONNES, GLOBAL, 2017 - 2029
- Figure 55:
- VALUE OF DAIRY ALTERNATIVES MARKET BY SUB DISTRIBUTION CHANNELS, USD MN, GLOBAL, 2017 - 2029
- Figure 56:
- VOLUME SHARE OF DAIRY ALTERNATIVES MARKET, BY SUB DISTRIBUTION CHANNELS , %, GLOBAL, 2017 VS 2023 VS 2029
- Figure 57:
- VALUE SHARE OF DAIRY ALTERNATIVES MARKET, BY SUB DISTRIBUTION CHANNELS , %, GLOBAL, 2017 VS 2023 VS 2029
- Figure 58:
- VOLUME OF DAIRY ALTERNATIVES MARKET SOLD VIA CONVENIENCE STORES, METRIC TONNES, GLOBAL, 2017 - 2029
- Figure 59:
- VALUE OF DAIRY ALTERNATIVES MARKET SOLD VIA CONVENIENCE STORES, USD MN, GLOBAL, 2017 - 2029
- Figure 60:
- VALUE SHARE OF DAIRY ALTERNATIVES MARKET, SOLD VIA CONVENIENCE STORES, BY CATEGORY , %, GLOBAL, 2022 VS 2029
- Figure 61:
- VOLUME OF DAIRY ALTERNATIVES MARKET SOLD VIA ONLINE RETAIL, METRIC TONNES, GLOBAL, 2017 - 2029
- Figure 62:
- VALUE OF DAIRY ALTERNATIVES MARKET SOLD VIA ONLINE RETAIL, USD MN, GLOBAL, 2017 - 2029
- Figure 63:
- VALUE SHARE OF DAIRY ALTERNATIVES MARKET, SOLD VIA ONLINE RETAIL, BY CATEGORY , %, GLOBAL, 2022 VS 2029
- Figure 64:
- VOLUME OF DAIRY ALTERNATIVES MARKET SOLD VIA SPECIALIST RETAILERS, METRIC TONNES, GLOBAL, 2017 - 2029
- Figure 65:
- VALUE OF DAIRY ALTERNATIVES MARKET SOLD VIA SPECIALIST RETAILERS, USD MN, GLOBAL, 2017 - 2029
- Figure 66:
- VALUE SHARE OF DAIRY ALTERNATIVES MARKET, SOLD VIA SPECIALIST RETAILERS, BY CATEGORY , %, GLOBAL, 2022 VS 2029
- Figure 67:
- VOLUME OF DAIRY ALTERNATIVES MARKET SOLD VIA SUPERMARKETS AND HYPERMARKETS, METRIC TONNES, GLOBAL, 2017 - 2029
- Figure 68:
- VALUE OF DAIRY ALTERNATIVES MARKET SOLD VIA SUPERMARKETS AND HYPERMARKETS, USD MN, GLOBAL, 2017 - 2029
- Figure 69:
- VALUE SHARE OF DAIRY ALTERNATIVES MARKET, SOLD VIA SUPERMARKETS AND HYPERMARKETS, BY CATEGORY , %, GLOBAL, 2022 VS 2029
- Figure 70:
- VOLUME OF DAIRY ALTERNATIVES MARKET SOLD VIA OTHERS (WAREHOUSE CLUBS, GAS STATIONS, ETC.), METRIC TONNES, GLOBAL, 2017 - 2029
- Figure 71:
- VALUE OF DAIRY ALTERNATIVES MARKET SOLD VIA OTHERS (WAREHOUSE CLUBS, GAS STATIONS, ETC.), USD MN, GLOBAL, 2017 - 2029
- Figure 72:
- VALUE SHARE OF DAIRY ALTERNATIVES MARKET, SOLD VIA OTHERS (WAREHOUSE CLUBS, GAS STATIONS, ETC.), BY CATEGORY , %, GLOBAL, 2022 VS 2029
- Figure 73:
- VOLUME OF DAIRY ALTERNATIVES MARKET SOLD VIA ON-TRADE, METRIC TONNES, GLOBAL, 2017 - 2029
- Figure 74:
- VALUE OF DAIRY ALTERNATIVES MARKET SOLD VIA ON-TRADE, USD MN, GLOBAL, 2017 - 2029
- Figure 75:
- VALUE SHARE OF DAIRY ALTERNATIVES MARKET, SOLD VIA ON-TRADE, BY CATEGORY , %, GLOBAL, 2022 VS 2029
- Figure 76:
- VOLUME OF DAIRY ALTERNATIVES MARKET BY REGION, METRIC TONNES, GLOBAL, 2017 - 2029
- Figure 77:
- VALUE OF DAIRY ALTERNATIVES MARKET BY REGION, USD MN, GLOBAL, 2017 - 2029
- Figure 78:
- VOLUME SHARE OF DAIRY ALTERNATIVES MARKET, BY REGION , %, GLOBAL, 2017 VS 2023 VS 2029
- Figure 79:
- VALUE SHARE OF DAIRY ALTERNATIVES MARKET, BY REGION , %, GLOBAL, 2017 VS 2023 VS 2029
- Figure 80:
- VOLUME OF DAIRY ALTERNATIVES MARKET BY CATEGORY, METRIC TONNES, AFRICA, 2017 - 2029
- Figure 81:
- VALUE OF DAIRY ALTERNATIVES MARKET BY CATEGORY, USD MN, AFRICA, 2017 - 2029
- Figure 82:
- VOLUME SHARE OF DAIRY ALTERNATIVES MARKET, BY CATEGORY , %, AFRICA, 2017 VS 2023 VS 2029
- Figure 83:
- VALUE SHARE OF DAIRY ALTERNATIVES MARKET, BY CATEGORY , %, AFRICA, 2017 VS 2023 VS 2029
- Figure 84:
- VOLUME OF DAIRY ALTERNATIVES MARKET BY DISTRIBUTION CHANNEL, METRIC TONNES, AFRICA, 2017 - 2029
- Figure 85:
- VALUE OF DAIRY ALTERNATIVES MARKET BY DISTRIBUTION CHANNEL, USD MN, AFRICA, 2017 - 2029
- Figure 86:
- VOLUME SHARE OF DAIRY ALTERNATIVES MARKET, BY DISTRIBUTION CHANNEL , %, AFRICA, 2017 VS 2023 VS 2029
- Figure 87:
- VALUE SHARE OF DAIRY ALTERNATIVES MARKET, BY DISTRIBUTION CHANNEL , %, AFRICA, 2017 VS 2023 VS 2029
- Figure 88:
- VOLUME OF DAIRY ALTERNATIVES MARKET BY COUNTRY, METRIC TONNES, AFRICA, 2017 - 2029
- Figure 89:
- VALUE OF DAIRY ALTERNATIVES MARKET BY COUNTRY, USD MN, AFRICA, 2017 - 2029
- Figure 90:
- VOLUME SHARE OF DAIRY ALTERNATIVES MARKET, BY COUNTRY , %, AFRICA, 2017 VS 2023 VS 2029
- Figure 91:
- VALUE SHARE OF DAIRY ALTERNATIVES MARKET, BY COUNTRY , %, AFRICA, 2017 VS 2023 VS 2029
- Figure 92:
- VOLUME OF DAIRY ALTERNATIVES MARKET, METRIC TONNES, EGYPT, 2017 - 2029
- Figure 93:
- VALUE OF DAIRY ALTERNATIVES MARKET, USD MN, EGYPT, 2017 - 2029
- Figure 94:
- VALUE SHARE OF DAIRY ALTERNATIVES MARKET, BY CATEGORY , %, EGYPT, 2022 VS 2029
- Figure 95:
- VOLUME OF DAIRY ALTERNATIVES MARKET, METRIC TONNES, NIGERIA, 2017 - 2029
- Figure 96:
- VALUE OF DAIRY ALTERNATIVES MARKET, USD MN, NIGERIA, 2017 - 2029
- Figure 97:
- VALUE SHARE OF DAIRY ALTERNATIVES MARKET, BY CATEGORY , %, NIGERIA, 2022 VS 2029
- Figure 98:
- VOLUME OF DAIRY ALTERNATIVES MARKET, METRIC TONNES, SOUTH AFRICA, 2017 - 2029
- Figure 99:
- VALUE OF DAIRY ALTERNATIVES MARKET, USD MN, SOUTH AFRICA, 2017 - 2029
- Figure 100:
- VALUE SHARE OF DAIRY ALTERNATIVES MARKET, BY CATEGORY , %, SOUTH AFRICA, 2022 VS 2029
- Figure 101:
- VOLUME OF DAIRY ALTERNATIVES MARKET, METRIC TONNES, REST OF AFRICA, 2017 - 2029
- Figure 102:
- VALUE OF DAIRY ALTERNATIVES MARKET, USD MN, REST OF AFRICA, 2017 - 2029
- Figure 103:
- VALUE SHARE OF DAIRY ALTERNATIVES MARKET, BY CATEGORY , %, REST OF AFRICA, 2022 VS 2029
- Figure 104:
- VOLUME OF DAIRY ALTERNATIVES MARKET BY CATEGORY, METRIC TONNES, ASIA-PACIFIC, 2017 - 2029
- Figure 105:
- VALUE OF DAIRY ALTERNATIVES MARKET BY CATEGORY, USD MN, ASIA-PACIFIC, 2017 - 2029
- Figure 106:
- VOLUME SHARE OF DAIRY ALTERNATIVES MARKET, BY CATEGORY , %, ASIA-PACIFIC, 2017 VS 2023 VS 2029
- Figure 107:
- VALUE SHARE OF DAIRY ALTERNATIVES MARKET, BY CATEGORY , %, ASIA-PACIFIC, 2017 VS 2023 VS 2029
- Figure 108:
- VOLUME OF DAIRY ALTERNATIVES MARKET BY DISTRIBUTION CHANNEL, METRIC TONNES, ASIA-PACIFIC, 2017 - 2029
- Figure 109:
- VALUE OF DAIRY ALTERNATIVES MARKET BY DISTRIBUTION CHANNEL, USD MN, ASIA-PACIFIC, 2017 - 2029
- Figure 110:
- VOLUME SHARE OF DAIRY ALTERNATIVES MARKET, BY DISTRIBUTION CHANNEL , %, ASIA-PACIFIC, 2017 VS 2023 VS 2029
- Figure 111:
- VALUE SHARE OF DAIRY ALTERNATIVES MARKET, BY DISTRIBUTION CHANNEL , %, ASIA-PACIFIC, 2017 VS 2023 VS 2029
- Figure 112:
- VOLUME OF DAIRY ALTERNATIVES MARKET BY COUNTRY, METRIC TONNES, ASIA-PACIFIC, 2017 - 2029
- Figure 113:
- VALUE OF DAIRY ALTERNATIVES MARKET BY COUNTRY, USD MN, ASIA-PACIFIC, 2017 - 2029
- Figure 114:
- VOLUME SHARE OF DAIRY ALTERNATIVES MARKET, BY COUNTRY , %, ASIA-PACIFIC, 2017 VS 2023 VS 2029
- Figure 115:
- VALUE SHARE OF DAIRY ALTERNATIVES MARKET, BY COUNTRY , %, ASIA-PACIFIC, 2017 VS 2023 VS 2029
- Figure 116:
- VOLUME OF DAIRY ALTERNATIVES MARKET, METRIC TONNES, AUSTRALIA, 2017 - 2029
- Figure 117:
- VALUE OF DAIRY ALTERNATIVES MARKET, USD MN, AUSTRALIA, 2017 - 2029
- Figure 118:
- VALUE SHARE OF DAIRY ALTERNATIVES MARKET, BY CATEGORY , %, AUSTRALIA, 2022 VS 2029
- Figure 119:
- VOLUME OF DAIRY ALTERNATIVES MARKET, METRIC TONNES, CHINA, 2017 - 2029
- Figure 120:
- VALUE OF DAIRY ALTERNATIVES MARKET, USD MN, CHINA, 2017 - 2029
- Figure 121:
- VALUE SHARE OF DAIRY ALTERNATIVES MARKET, BY CATEGORY , %, CHINA, 2022 VS 2029
- Figure 122:
- VOLUME OF DAIRY ALTERNATIVES MARKET, METRIC TONNES, INDIA, 2017 - 2029
- Figure 123:
- VALUE OF DAIRY ALTERNATIVES MARKET, USD MN, INDIA, 2017 - 2029
- Figure 124:
- VALUE SHARE OF DAIRY ALTERNATIVES MARKET, BY CATEGORY , %, INDIA, 2022 VS 2029
- Figure 125:
- VOLUME OF DAIRY ALTERNATIVES MARKET, METRIC TONNES, INDONESIA, 2017 - 2029
- Figure 126:
- VALUE OF DAIRY ALTERNATIVES MARKET, USD MN, INDONESIA, 2017 - 2029
- Figure 127:
- VALUE SHARE OF DAIRY ALTERNATIVES MARKET, BY CATEGORY , %, INDONESIA, 2022 VS 2029
- Figure 128:
- VOLUME OF DAIRY ALTERNATIVES MARKET, METRIC TONNES, JAPAN, 2017 - 2029
- Figure 129:
- VALUE OF DAIRY ALTERNATIVES MARKET, USD MN, JAPAN, 2017 - 2029
- Figure 130:
- VALUE SHARE OF DAIRY ALTERNATIVES MARKET, BY CATEGORY , %, JAPAN, 2022 VS 2029
- Figure 131:
- VOLUME OF DAIRY ALTERNATIVES MARKET, METRIC TONNES, MALAYSIA, 2017 - 2029
- Figure 132:
- VALUE OF DAIRY ALTERNATIVES MARKET, USD MN, MALAYSIA, 2017 - 2029
- Figure 133:
- VALUE SHARE OF DAIRY ALTERNATIVES MARKET, BY CATEGORY , %, MALAYSIA, 2022 VS 2029
- Figure 134:
- VOLUME OF DAIRY ALTERNATIVES MARKET, METRIC TONNES, NEW ZEALAND, 2017 - 2029
- Figure 135:
- VALUE OF DAIRY ALTERNATIVES MARKET, USD MN, NEW ZEALAND, 2017 - 2029
- Figure 136:
- VALUE SHARE OF DAIRY ALTERNATIVES MARKET, BY CATEGORY , %, NEW ZEALAND, 2022 VS 2029
- Figure 137:
- VOLUME OF DAIRY ALTERNATIVES MARKET, METRIC TONNES, PAKISTAN, 2017 - 2029
- Figure 138:
- VALUE OF DAIRY ALTERNATIVES MARKET, USD MN, PAKISTAN, 2017 - 2029
- Figure 139:
- VALUE SHARE OF DAIRY ALTERNATIVES MARKET, BY CATEGORY , %, PAKISTAN, 2022 VS 2029
- Figure 140:
- VOLUME OF DAIRY ALTERNATIVES MARKET, METRIC TONNES, SOUTH KOREA, 2017 - 2029
- Figure 141:
- VALUE OF DAIRY ALTERNATIVES MARKET, USD MN, SOUTH KOREA, 2017 - 2029
- Figure 142:
- VALUE SHARE OF DAIRY ALTERNATIVES MARKET, BY CATEGORY , %, SOUTH KOREA, 2022 VS 2029
- Figure 143:
- VOLUME OF DAIRY ALTERNATIVES MARKET, METRIC TONNES, REST OF ASIA PACIFIC, 2017 - 2029
- Figure 144:
- VALUE OF DAIRY ALTERNATIVES MARKET, USD MN, REST OF ASIA PACIFIC, 2017 - 2029
- Figure 145:
- VALUE SHARE OF DAIRY ALTERNATIVES MARKET, BY CATEGORY , %, REST OF ASIA PACIFIC, 2022 VS 2029
- Figure 146:
- VOLUME OF DAIRY ALTERNATIVES MARKET BY CATEGORY, METRIC TONNES, EUROPE, 2017 - 2029
- Figure 147:
- VALUE OF DAIRY ALTERNATIVES MARKET BY CATEGORY, USD MN, EUROPE, 2017 - 2029
- Figure 148:
- VOLUME SHARE OF DAIRY ALTERNATIVES MARKET, BY CATEGORY , %, EUROPE, 2017 VS 2023 VS 2029
- Figure 149:
- VALUE SHARE OF DAIRY ALTERNATIVES MARKET, BY CATEGORY , %, EUROPE, 2017 VS 2023 VS 2029
- Figure 150:
- VOLUME OF DAIRY ALTERNATIVES MARKET BY DISTRIBUTION CHANNEL, METRIC TONNES, EUROPE, 2017 - 2029
- Figure 151:
- VALUE OF DAIRY ALTERNATIVES MARKET BY DISTRIBUTION CHANNEL, USD MN, EUROPE, 2017 - 2029
- Figure 152:
- VOLUME SHARE OF DAIRY ALTERNATIVES MARKET, BY DISTRIBUTION CHANNEL , %, EUROPE, 2017 VS 2023 VS 2029
- Figure 153:
- VALUE SHARE OF DAIRY ALTERNATIVES MARKET, BY DISTRIBUTION CHANNEL , %, EUROPE, 2017 VS 2023 VS 2029
- Figure 154:
- VOLUME OF DAIRY ALTERNATIVES MARKET BY COUNTRY, METRIC TONNES, EUROPE, 2017 - 2029
- Figure 155:
- VALUE OF DAIRY ALTERNATIVES MARKET BY COUNTRY, USD MN, EUROPE, 2017 - 2029
- Figure 156:
- VOLUME SHARE OF DAIRY ALTERNATIVES MARKET, BY COUNTRY , %, EUROPE, 2017 VS 2023 VS 2029
- Figure 157:
- VALUE SHARE OF DAIRY ALTERNATIVES MARKET, BY COUNTRY , %, EUROPE, 2017 VS 2023 VS 2029
- Figure 158:
- VOLUME OF DAIRY ALTERNATIVES MARKET, METRIC TONNES, BELGIUM, 2017 - 2029
- Figure 159:
- VALUE OF DAIRY ALTERNATIVES MARKET, USD MN, BELGIUM, 2017 - 2029
- Figure 160:
- VALUE SHARE OF DAIRY ALTERNATIVES MARKET, BY CATEGORY , %, BELGIUM, 2022 VS 2029
- Figure 161:
- VOLUME OF DAIRY ALTERNATIVES MARKET, METRIC TONNES, FRANCE, 2017 - 2029
- Figure 162:
- VALUE OF DAIRY ALTERNATIVES MARKET, USD MN, FRANCE, 2017 - 2029
- Figure 163:
- VALUE SHARE OF DAIRY ALTERNATIVES MARKET, BY CATEGORY , %, FRANCE, 2022 VS 2029
- Figure 164:
- VOLUME OF DAIRY ALTERNATIVES MARKET, METRIC TONNES, GERMANY, 2017 - 2029
- Figure 165:
- VALUE OF DAIRY ALTERNATIVES MARKET, USD MN, GERMANY, 2017 - 2029
- Figure 166:
- VALUE SHARE OF DAIRY ALTERNATIVES MARKET, BY CATEGORY , %, GERMANY, 2022 VS 2029
- Figure 167:
- VOLUME OF DAIRY ALTERNATIVES MARKET, METRIC TONNES, ITALY, 2017 - 2029
- Figure 168:
- VALUE OF DAIRY ALTERNATIVES MARKET, USD MN, ITALY, 2017 - 2029
- Figure 169:
- VALUE SHARE OF DAIRY ALTERNATIVES MARKET, BY CATEGORY , %, ITALY, 2022 VS 2029
- Figure 170:
- VOLUME OF DAIRY ALTERNATIVES MARKET, METRIC TONNES, NETHERLANDS, 2017 - 2029
- Figure 171:
- VALUE OF DAIRY ALTERNATIVES MARKET, USD MN, NETHERLANDS, 2017 - 2029
- Figure 172:
- VALUE SHARE OF DAIRY ALTERNATIVES MARKET, BY CATEGORY , %, NETHERLANDS, 2022 VS 2029
- Figure 173:
- VOLUME OF DAIRY ALTERNATIVES MARKET, METRIC TONNES, RUSSIA, 2017 - 2029
- Figure 174:
- VALUE OF DAIRY ALTERNATIVES MARKET, USD MN, RUSSIA, 2017 - 2029
- Figure 175:
- VALUE SHARE OF DAIRY ALTERNATIVES MARKET, BY CATEGORY , %, RUSSIA, 2022 VS 2029
- Figure 176:
- VOLUME OF DAIRY ALTERNATIVES MARKET, METRIC TONNES, SPAIN, 2017 - 2029
- Figure 177:
- VALUE OF DAIRY ALTERNATIVES MARKET, USD MN, SPAIN, 2017 - 2029
- Figure 178:
- VALUE SHARE OF DAIRY ALTERNATIVES MARKET, BY CATEGORY , %, SPAIN, 2022 VS 2029
- Figure 179:
- VOLUME OF DAIRY ALTERNATIVES MARKET, METRIC TONNES, TURKEY, 2017 - 2029
- Figure 180:
- VALUE OF DAIRY ALTERNATIVES MARKET, USD MN, TURKEY, 2017 - 2029
- Figure 181:
- VALUE SHARE OF DAIRY ALTERNATIVES MARKET, BY CATEGORY , %, TURKEY, 2022 VS 2029
- Figure 182:
- VOLUME OF DAIRY ALTERNATIVES MARKET, METRIC TONNES, UNITED KINGDOM, 2017 - 2029
- Figure 183:
- VALUE OF DAIRY ALTERNATIVES MARKET, USD MN, UNITED KINGDOM, 2017 - 2029
- Figure 184:
- VALUE SHARE OF DAIRY ALTERNATIVES MARKET, BY CATEGORY , %, UNITED KINGDOM, 2022 VS 2029
- Figure 185:
- VOLUME OF DAIRY ALTERNATIVES MARKET, METRIC TONNES, REST OF EUROPE, 2017 - 2029
- Figure 186:
- VALUE OF DAIRY ALTERNATIVES MARKET, USD MN, REST OF EUROPE, 2017 - 2029
- Figure 187:
- VALUE SHARE OF DAIRY ALTERNATIVES MARKET, BY CATEGORY , %, REST OF EUROPE, 2022 VS 2029
- Figure 188:
- VOLUME OF DAIRY ALTERNATIVES MARKET BY CATEGORY, METRIC TONNES, MIDDLE EAST, 2017 - 2029
- Figure 189:
- VALUE OF DAIRY ALTERNATIVES MARKET BY CATEGORY, USD MN, MIDDLE EAST, 2017 - 2029
- Figure 190:
- VOLUME SHARE OF DAIRY ALTERNATIVES MARKET, BY CATEGORY , %, MIDDLE EAST, 2017 VS 2023 VS 2029
- Figure 191:
- VALUE SHARE OF DAIRY ALTERNATIVES MARKET, BY CATEGORY , %, MIDDLE EAST, 2017 VS 2023 VS 2029
- Figure 192:
- VOLUME OF DAIRY ALTERNATIVES MARKET BY DISTRIBUTION CHANNEL, METRIC TONNES, MIDDLE EAST, 2017 - 2029
- Figure 193:
- VALUE OF DAIRY ALTERNATIVES MARKET BY DISTRIBUTION CHANNEL, USD MN, MIDDLE EAST, 2017 - 2029
- Figure 194:
- VOLUME SHARE OF DAIRY ALTERNATIVES MARKET, BY DISTRIBUTION CHANNEL , %, MIDDLE EAST, 2017 VS 2023 VS 2029
- Figure 195:
- VALUE SHARE OF DAIRY ALTERNATIVES MARKET, BY DISTRIBUTION CHANNEL , %, MIDDLE EAST, 2017 VS 2023 VS 2029
- Figure 196:
- VOLUME OF DAIRY ALTERNATIVES MARKET BY COUNTRY, METRIC TONNES, MIDDLE EAST, 2017 - 2029
- Figure 197:
- VALUE OF DAIRY ALTERNATIVES MARKET BY COUNTRY, USD MN, MIDDLE EAST, 2017 - 2029
- Figure 198:
- VOLUME SHARE OF DAIRY ALTERNATIVES MARKET, BY COUNTRY , %, MIDDLE EAST, 2017 VS 2023 VS 2029
- Figure 199:
- VALUE SHARE OF DAIRY ALTERNATIVES MARKET, BY COUNTRY , %, MIDDLE EAST, 2017 VS 2023 VS 2029
- Figure 200:
- VOLUME OF DAIRY ALTERNATIVES MARKET, METRIC TONNES, BAHRAIN, 2017 - 2029
- Figure 201:
- VALUE OF DAIRY ALTERNATIVES MARKET, USD MN, BAHRAIN, 2017 - 2029
- Figure 202:
- VALUE SHARE OF DAIRY ALTERNATIVES MARKET, BY CATEGORY , %, BAHRAIN, 2022 VS 2029
- Figure 203:
- VOLUME OF DAIRY ALTERNATIVES MARKET, METRIC TONNES, IRAN, 2017 - 2029
- Figure 204:
- VALUE OF DAIRY ALTERNATIVES MARKET, USD MN, IRAN, 2017 - 2029
- Figure 205:
- VALUE SHARE OF DAIRY ALTERNATIVES MARKET, BY CATEGORY , %, IRAN, 2022 VS 2029
- Figure 206:
- VOLUME OF DAIRY ALTERNATIVES MARKET, METRIC TONNES, KUWAIT, 2017 - 2029
- Figure 207:
- VALUE OF DAIRY ALTERNATIVES MARKET, USD MN, KUWAIT, 2017 - 2029
- Figure 208:
- VALUE SHARE OF DAIRY ALTERNATIVES MARKET, BY CATEGORY , %, KUWAIT, 2022 VS 2029
- Figure 209:
- VOLUME OF DAIRY ALTERNATIVES MARKET, METRIC TONNES, OMAN, 2017 - 2029
- Figure 210:
- VALUE OF DAIRY ALTERNATIVES MARKET, USD MN, OMAN, 2017 - 2029
- Figure 211:
- VALUE SHARE OF DAIRY ALTERNATIVES MARKET, BY CATEGORY , %, OMAN, 2022 VS 2029
- Figure 212:
- VOLUME OF DAIRY ALTERNATIVES MARKET, METRIC TONNES, QATAR, 2017 - 2029
- Figure 213:
- VALUE OF DAIRY ALTERNATIVES MARKET, USD MN, QATAR, 2017 - 2029
- Figure 214:
- VALUE SHARE OF DAIRY ALTERNATIVES MARKET, BY CATEGORY , %, QATAR, 2022 VS 2029
- Figure 215:
- VOLUME OF DAIRY ALTERNATIVES MARKET, METRIC TONNES, SAUDI ARABIA, 2017 - 2029
- Figure 216:
- VALUE OF DAIRY ALTERNATIVES MARKET, USD MN, SAUDI ARABIA, 2017 - 2029
- Figure 217:
- VALUE SHARE OF DAIRY ALTERNATIVES MARKET, BY CATEGORY , %, SAUDI ARABIA, 2022 VS 2029
- Figure 218:
- VOLUME OF DAIRY ALTERNATIVES MARKET, METRIC TONNES, UNITED ARAB EMIRATES, 2017 - 2029
- Figure 219:
- VALUE OF DAIRY ALTERNATIVES MARKET, USD MN, UNITED ARAB EMIRATES, 2017 - 2029
- Figure 220:
- VALUE SHARE OF DAIRY ALTERNATIVES MARKET, BY CATEGORY , %, UNITED ARAB EMIRATES, 2022 VS 2029
- Figure 221:
- VOLUME OF DAIRY ALTERNATIVES MARKET, METRIC TONNES, REST OF MIDDLE EAST, 2017 - 2029
- Figure 222:
- VALUE OF DAIRY ALTERNATIVES MARKET, USD MN, REST OF MIDDLE EAST, 2017 - 2029
- Figure 223:
- VALUE SHARE OF DAIRY ALTERNATIVES MARKET, BY CATEGORY , %, REST OF MIDDLE EAST, 2022 VS 2029
- Figure 224:
- VOLUME OF DAIRY ALTERNATIVES MARKET BY CATEGORY, METRIC TONNES, NORTH AMERICA, 2017 - 2029
- Figure 225:
- VALUE OF DAIRY ALTERNATIVES MARKET BY CATEGORY, USD MN, NORTH AMERICA, 2017 - 2029
- Figure 226:
- VOLUME SHARE OF DAIRY ALTERNATIVES MARKET, BY CATEGORY , %, NORTH AMERICA, 2017 VS 2023 VS 2029
- Figure 227:
- VALUE SHARE OF DAIRY ALTERNATIVES MARKET, BY CATEGORY , %, NORTH AMERICA, 2017 VS 2023 VS 2029
- Figure 228:
- VOLUME OF DAIRY ALTERNATIVES MARKET BY DISTRIBUTION CHANNEL, METRIC TONNES, NORTH AMERICA, 2017 - 2029
- Figure 229:
- VALUE OF DAIRY ALTERNATIVES MARKET BY DISTRIBUTION CHANNEL, USD MN, NORTH AMERICA, 2017 - 2029
- Figure 230:
- VOLUME SHARE OF DAIRY ALTERNATIVES MARKET, BY DISTRIBUTION CHANNEL , %, NORTH AMERICA, 2017 VS 2023 VS 2029
- Figure 231:
- VALUE SHARE OF DAIRY ALTERNATIVES MARKET, BY DISTRIBUTION CHANNEL , %, NORTH AMERICA, 2017 VS 2023 VS 2029
- Figure 232:
- VOLUME OF DAIRY ALTERNATIVES MARKET BY COUNTRY, METRIC TONNES, NORTH AMERICA, 2017 - 2029
- Figure 233:
- VALUE OF DAIRY ALTERNATIVES MARKET BY COUNTRY, USD MN, NORTH AMERICA, 2017 - 2029
- Figure 234:
- VOLUME SHARE OF DAIRY ALTERNATIVES MARKET, BY COUNTRY , %, NORTH AMERICA, 2017 VS 2023 VS 2029
- Figure 235:
- VALUE SHARE OF DAIRY ALTERNATIVES MARKET, BY COUNTRY , %, NORTH AMERICA, 2017 VS 2023 VS 2029
- Figure 236:
- VOLUME OF DAIRY ALTERNATIVES MARKET, METRIC TONNES, CANADA, 2017 - 2029
- Figure 237:
- VALUE OF DAIRY ALTERNATIVES MARKET, USD MN, CANADA, 2017 - 2029
- Figure 238:
- VALUE SHARE OF DAIRY ALTERNATIVES MARKET, BY CATEGORY , %, CANADA, 2022 VS 2029
- Figure 239:
- VOLUME OF DAIRY ALTERNATIVES MARKET, METRIC TONNES, MEXICO, 2017 - 2029
- Figure 240:
- VALUE OF DAIRY ALTERNATIVES MARKET, USD MN, MEXICO, 2017 - 2029
- Figure 241:
- VALUE SHARE OF DAIRY ALTERNATIVES MARKET, BY CATEGORY , %, MEXICO, 2022 VS 2029
- Figure 242:
- VOLUME OF DAIRY ALTERNATIVES MARKET, METRIC TONNES, UNITED STATES, 2017 - 2029
- Figure 243:
- VALUE OF DAIRY ALTERNATIVES MARKET, USD MN, UNITED STATES, 2017 - 2029
- Figure 244:
- VALUE SHARE OF DAIRY ALTERNATIVES MARKET, BY CATEGORY , %, UNITED STATES, 2022 VS 2029
- Figure 245:
- VOLUME OF DAIRY ALTERNATIVES MARKET, METRIC TONNES, REST OF NORTH AMERICA, 2017 - 2029
- Figure 246:
- VALUE OF DAIRY ALTERNATIVES MARKET, USD MN, REST OF NORTH AMERICA, 2017 - 2029
- Figure 247:
- VALUE SHARE OF DAIRY ALTERNATIVES MARKET, BY CATEGORY , %, REST OF NORTH AMERICA, 2022 VS 2029
- Figure 248:
- VOLUME OF DAIRY ALTERNATIVES MARKET BY CATEGORY, METRIC TONNES, SOUTH AMERICA, 2017 - 2029
- Figure 249:
- VALUE OF DAIRY ALTERNATIVES MARKET BY CATEGORY, USD MN, SOUTH AMERICA, 2017 - 2029
- Figure 250:
- VOLUME SHARE OF DAIRY ALTERNATIVES MARKET, BY CATEGORY , %, SOUTH AMERICA, 2017 VS 2023 VS 2029
- Figure 251:
- VALUE SHARE OF DAIRY ALTERNATIVES MARKET, BY CATEGORY , %, SOUTH AMERICA, 2017 VS 2023 VS 2029
- Figure 252:
- VOLUME OF DAIRY ALTERNATIVES MARKET BY DISTRIBUTION CHANNEL, METRIC TONNES, SOUTH AMERICA, 2017 - 2029
- Figure 253:
- VALUE OF DAIRY ALTERNATIVES MARKET BY DISTRIBUTION CHANNEL, USD MN, SOUTH AMERICA, 2017 - 2029
- Figure 254:
- VOLUME SHARE OF DAIRY ALTERNATIVES MARKET, BY DISTRIBUTION CHANNEL , %, SOUTH AMERICA, 2017 VS 2023 VS 2029
- Figure 255:
- VALUE SHARE OF DAIRY ALTERNATIVES MARKET, BY DISTRIBUTION CHANNEL , %, SOUTH AMERICA, 2017 VS 2023 VS 2029
- Figure 256:
- VOLUME OF DAIRY ALTERNATIVES MARKET BY COUNTRY, METRIC TONNES, SOUTH AMERICA, 2017 - 2029
- Figure 257:
- VALUE OF DAIRY ALTERNATIVES MARKET BY COUNTRY, USD MN, SOUTH AMERICA, 2017 - 2029
- Figure 258:
- VOLUME SHARE OF DAIRY ALTERNATIVES MARKET, BY COUNTRY , %, SOUTH AMERICA, 2017 VS 2023 VS 2029
- Figure 259:
- VALUE SHARE OF DAIRY ALTERNATIVES MARKET, BY COUNTRY , %, SOUTH AMERICA, 2017 VS 2023 VS 2029
- Figure 260:
- VOLUME OF DAIRY ALTERNATIVES MARKET, METRIC TONNES, ARGENTINA, 2017 - 2029
- Figure 261:
- VALUE OF DAIRY ALTERNATIVES MARKET, USD MN, ARGENTINA, 2017 - 2029
- Figure 262:
- VALUE SHARE OF DAIRY ALTERNATIVES MARKET, BY CATEGORY , %, ARGENTINA, 2022 VS 2029
- Figure 263:
- VOLUME OF DAIRY ALTERNATIVES MARKET, METRIC TONNES, BRAZIL, 2017 - 2029
- Figure 264:
- VALUE OF DAIRY ALTERNATIVES MARKET, USD MN, BRAZIL, 2017 - 2029
- Figure 265:
- VALUE SHARE OF DAIRY ALTERNATIVES MARKET, BY CATEGORY , %, BRAZIL, 2022 VS 2029
- Figure 266:
- VOLUME OF DAIRY ALTERNATIVES MARKET, METRIC TONNES, REST OF SOUTH AMERICA, 2017 - 2029
- Figure 267:
- VALUE OF DAIRY ALTERNATIVES MARKET, USD MN, REST OF SOUTH AMERICA, 2017 - 2029
- Figure 268:
- VALUE SHARE OF DAIRY ALTERNATIVES MARKET, BY CATEGORY , %, REST OF SOUTH AMERICA, 2022 VS 2029
- Figure 269:
- MOST ACTIVE COMPANIES BY NUMBER OF STRATEGIC MOVES, COUNT, GLOBAL, 2017 - 2029
- Figure 270:
- MOST ADOPTED STRATEGIES, COUNT, GLOBAL, 2017 - 2029
- Figure 271:
- VALUE SHARE OF MAJOR PLAYERS, %, GLOBAL
Dairy Alternatives Industry Segmentation
Non-Dairy Butter, Non-Dairy Cheese, Non-Dairy Ice Cream, Non-Dairy Milk, Non-Dairy Yogurt are covered as segments by Category. Off-Trade, On-Trade are covered as segments by Distribution Channel. Africa, Asia-Pacific, Europe, Middle East, North America, South America are covered as segments by Region.| Category | Non-Dairy Butter | |||
| Non-Dairy Cheese | ||||
| Non-Dairy Ice Cream | ||||
| Non-Dairy Milk | By Product Type | Almond Milk | ||
| Cashew Milk | ||||
| Coconut Milk | ||||
| Hazelnut Milk | ||||
| Hemp Milk | ||||
| Oat Milk | ||||
| Soy Milk | ||||
| Non-Dairy Yogurt | ||||
| Distribution Channel | Off-Trade | Convenience Stores | ||
| Online Retail | ||||
| Specialist Retailers | ||||
| Supermarkets and Hypermarkets | ||||
| Others (Warehouse clubs, gas stations, etc.) | ||||
| On-Trade | ||||
| Region | Africa | By Category | ||
| By Distribution Channel | ||||
| By Country | Egypt | |||
| Nigeria | ||||
| South Africa | ||||
| Rest of Africa | ||||
| Asia-Pacific | By Category | |||
| By Distribution Channel | ||||
| Australia | ||||
| China | ||||
| India | ||||
| Indonesia | ||||
| Japan | ||||
| Malaysia | ||||
| New Zealand | ||||
| Pakistan | ||||
| South Korea | ||||
| Rest of Asia Pacific | ||||
| Europe | By Category | |||
| By Distribution Channel | ||||
| Belgium | ||||
| France | ||||
| Germany | ||||
| Italy | ||||
| Netherlands | ||||
| Russia | ||||
| Spain | ||||
| Turkey | ||||
| United Kingdom | ||||
| Rest of Europe | ||||
| Middle East | By Category | |||
| By Distribution Channel | ||||
| Bahrain | ||||
| Iran | ||||
| Kuwait | ||||
| Oman | ||||
| Qatar | ||||
| Saudi Arabia | ||||
| United Arab Emirates | ||||
| Rest of Middle East | ||||
| North America | By Category | |||
| By Distribution Channel | ||||
| Canada | ||||
| Mexico | ||||
| United States | ||||
| Rest of North America | ||||
| South America | By Category | |||
| By Distribution Channel | ||||
| Argentina | ||||
| Brazil | ||||
| Rest of South America | ||||
Need A Different Region or Segment?
Customize Now
Market Definition
- Dairy Alternatives - Dairy alternatives are foods that are made from plant-based milk/oils instead of their usual animal products, such as cheese, butter, milk, ice cream, yogurt, etc. Plant-based or non-dairy milk alternative is the fast-growing segment in the newer food product development category of functional and specialty beverage across the globe.
- Non-Dairy Butter - Non dairy butter is a vegan butter alternative that is made from a mixture of plant oils. With an increase in alternative diets like vegetarianism, veganism, and gluten intolerance, plant butter is a healthy non-dairy substitute for normal butter.
- Non-Dairy Ice Cream - Plant based ice cream is a growing category. Non-dairy ice cream is a type of dessert made without any animal ingredients. This is typically considered a substitute for regular ice cream for those who cannot or do not eat animal or animal-derived products, including eggs, milk, cream, or honey.
- Plant-Based Milk - Plant based milks are milk substitutes that are made from nuts (e.g., hazelnuts, hemp seeds), seeds (e.g., sesame, walnuts, coconuts, cashews, almonds, rice, oats, etc.) or legumes (e.g., soy). Plant-based milk such as soy milk and almond milk have been popular in East Asia and the Middle East for centuries.
| Keyword | Definition |
|---|---|
| Cultured Butter | Cultured butter is prepared by having the raw butter go through chemical processing and has been added with certain emulsifiers and foreign ingredients. |
| Uncultured Butter | This type of butter is one which has not been processed in any way |
| Natural Cheese | The type of cheese in its most natural form. It is made from natural and simple products and ingredients, including fresh and natural salts, natural colors, enzymes, and high-quality milk. |
| Processed Cheese | Processed cheese undergoes the same processes as natural cheese; however, it requires more steps and many different forms of ingredients. Making processed cheese involves melting natural cheese, emulsifying it, and adding preservatives and other artificial ingredients or colorings. |
| Single Cream | Single cream contains around 18% fat. It’s a single layer of cream that appears over boiled milk. |
| Double Cream | Double cream contains 48% fat, more than double the amount of fat of single cream. It’s heavier and thicker than single cream |
| Whipping Cream | This has a much higher fat percentage than single cream (36%). Used to top cakes, pies, and puddings and as a thickener for sauces, soups, and fillings. |
| Frozen Desserts | Desserts that are meant to be eaten in frozen condition. E.g., sherbets, sorbets, frozen yogurts |
| UHT Milk (Ultra-high temperature milk) | Milk heated at a very high temperature. Ultra-high-temperature processing (UHT) of milk involves heating for 1–8 sec at 135–154°C. which kills the spore-forming pathogenic microorganism, resulting in a product with a shelf-life of several months. |
| Non-dairy butter/Plant-based butter | Butter made from plant-derived oil such as coconut, palm, etc. |
| Non-dairy Yogurt | Yogurt made from typically made from nuts, like almonds, cashews, coconuts, and even other foods like soybeans, plantains, oats, and peas |
| On-trade | It refers to restaurants, QSRs, and bars. |
| Off-trade | It refers to supermarkets, hypermarkets, on-line channels, etc. |
| Neufchatel cheese | One of the oldest kinds of cheese in France. It is a soft, slightly crumbly, mold-ripened, bloomy-rind cheese made in the Neufchâtel-en-Bray region of Normandy. |
| Flexitarian | It refers to a consumer preferring a semi-vegetarian diet, that is centered on plant foods with limited or occasional inclusion of meat. |
| Lactose Intolerance | Lactose intolerance is a reaction in digestive system to lactose, the sugar in milk. It causes uncomfortable symptoms in response to the consumption of dairy products. |
| Cream Cheese | Cream cheese is a soft and creamy fresh cheese with a tangy taste made from milk and cream. |
| Sorbets | Sorbet is a frozen dessert made using ice combined with fruit juice, fruit purée, or other ingredients, such as wine, liqueur, or honey. |
| Sherbet | Sherbet is a sweetened frozen dessert made with fruit and some sort of dairy product such as milk or cream. |
| Shelf stable | Foods that can be safely stored at room temperature, or "on the shelf," for at least one year and do not have to be cooked or refrigerated to eat safely. |
| DSD | Direct Store Delivery is the process in supply chain management wherein the product is delivered from manufacturing plant directly to the retailer. |
| OU Kosher | Orthodox Union Kosher is a kosher certification agency based in New York City. |
| Gelato | Gelato is a frozen creamy dessert made with milk, heavy cream and sugar. |
| Grass-fed Cows | Grass-fed cows are allowed to graze in pastures, where they eat a variety of grasses and clover. |
Need More Details on Market Definition?
Ask a Question
Research Methodology
Mordor Intelligence follows a four-step methodology in all our reports.
- Step-1: Identify Key Variables: In order to build a robust forecasting methodology, the variables and factors identified in Step 1 are tested against available historical market numbers. Through an iterative process, the variables required for market forecast are set, and the model is built on the basis of these variables.
- Step-2: Build a Market Model: Market-size estimations for the forecast years are in nominal terms. Inflation is not a part of the pricing, and the average selling price (ASP) is kept constant throughout the forecast period for each country.
- Step-3: Validate and Finalize: In this important step, all market numbers, variables, and analyst calls are validated through an extensive network of primary research experts from the market studied. The respondents are selected across levels and functions to generate a holistic picture of the market studied.
- Step-4: Research Outputs: Syndicated Reports, Custom Consulting Assignments, Databases & Subscription Platforms

Get More Details On Research Methodology
Download PDF


