
Cytotoxic Drugs Market Size and Share
Market Overview
| Study Period | 2020 - 2031 |
|---|---|
| Market Size (2026) | USD 16.21 Billion |
| Market Size (2031) | USD 21.06 Billion |
| Growth Rate (2026 - 2031) | 5.37 % |
| Fastest Growing Market | Asia Pacific |
| Largest Market | North America |
| Market Concentration | Medium |
Major Players *Disclaimer: Major Players sorted in no particular order Image © Mordor Intelligence. Reuse requires attribution under CC BY 4.0. | |
Cytotoxic Drugs Market Analysis by Mordor Intelligence
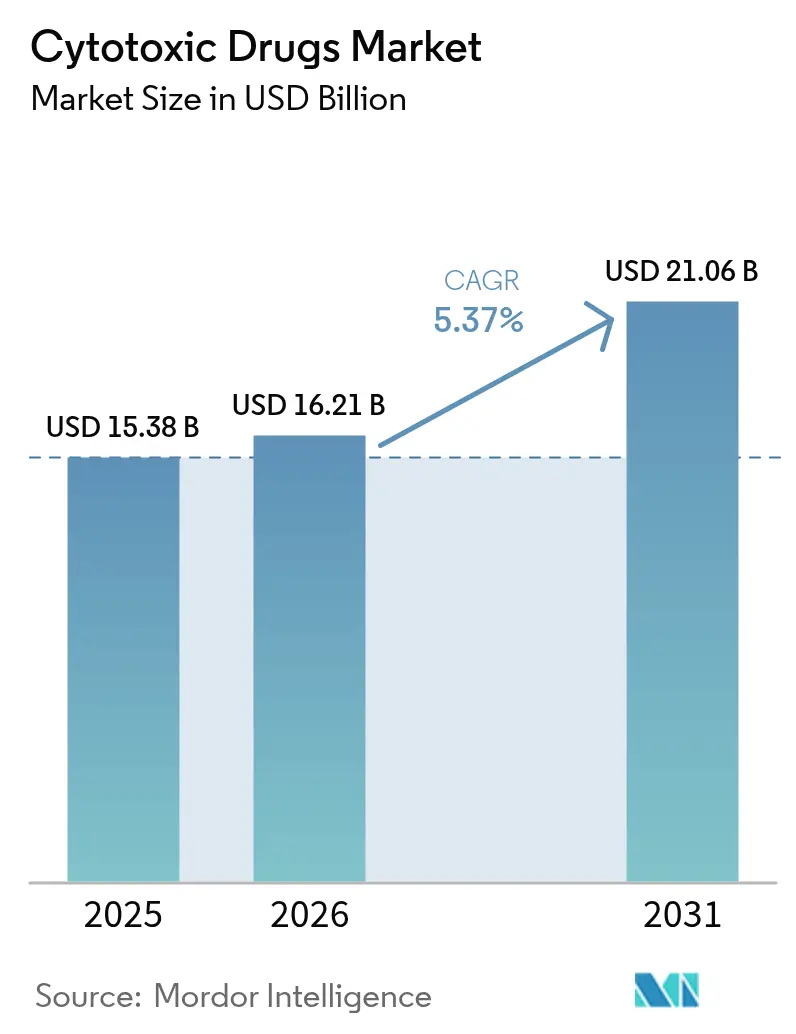
The cytotoxic drugs market size in 2026 is estimated at USD 16.21 billion, growing from 2025 value of USD 15.38 billion with 2031 projections showing USD 21.06 billion, growing at 5.37% CAGR over 2026-2031. Rising cancer diagnoses, sustained clinical reliance on chemotherapy backbones, and swift regulatory approvals underpin this steady outlook. Adoption accelerates where next-generation delivery platforms improve therapeutic indices, while expanded reimbursement frameworks in high-income countries lower financial barriers for combination regimens. Oral formulations, improved sustained-release injectables, and antibody-drug conjugates (ADCs) illustrate how established cytotoxic mechanisms adapt to precision-medicine paradigms. Simultaneously, manufacturing investments in Asia-Pacific elevate supply resilience and trim costs, positioning the region as the growth engine of the cytotoxic drugs market. Environmental compliance and adherence limitations continue to temper growth, yet pipeline momentum and broader geographic access outweigh these constraints.
Key Report Takeaways
- By route of administration, parenteral products retained 68.87% of cytotoxic drugs market share in 2025, whereas oral formulations record a 8.79% CAGR to 2031.
- By drug type, alkylating agents led with 30.10% revenue share in 2025; antimetabolites expand at a 7.02% CAGR through 2031.
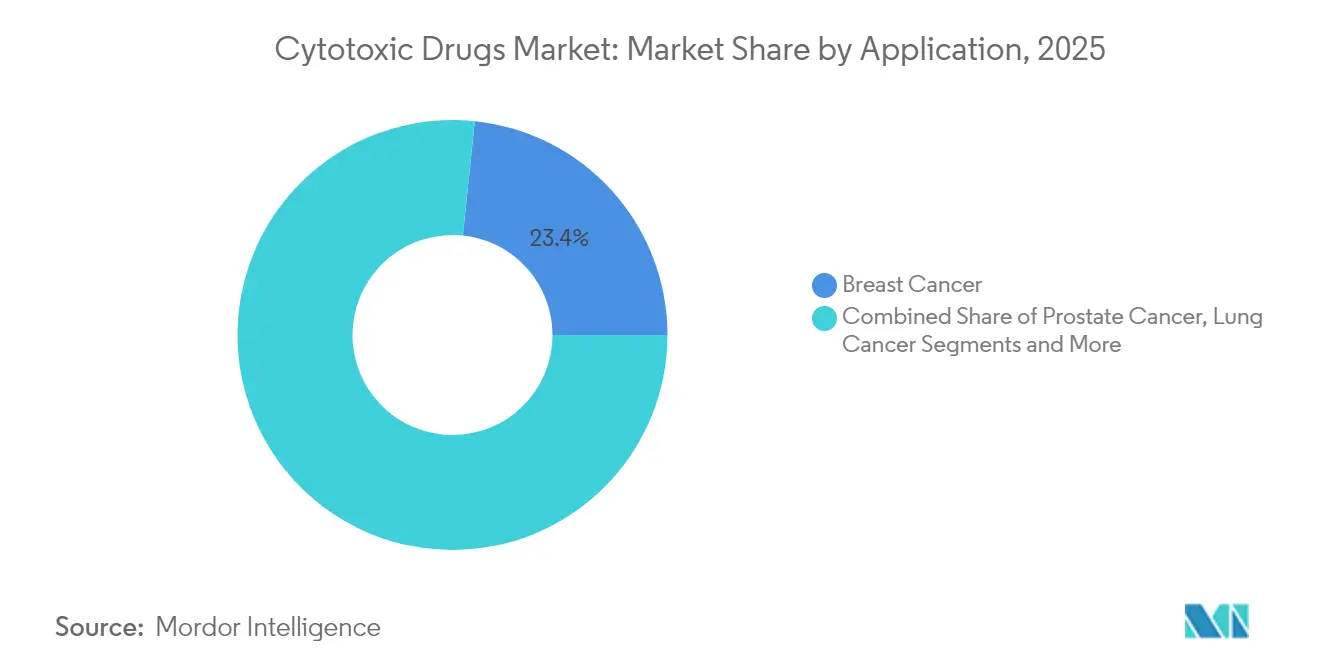
- By application, breast cancer commanded 23.35% of the cytotoxic drugs market size in 2025, while pancreatic cancer treatments rise at an 7.78% CAGR to 2031.
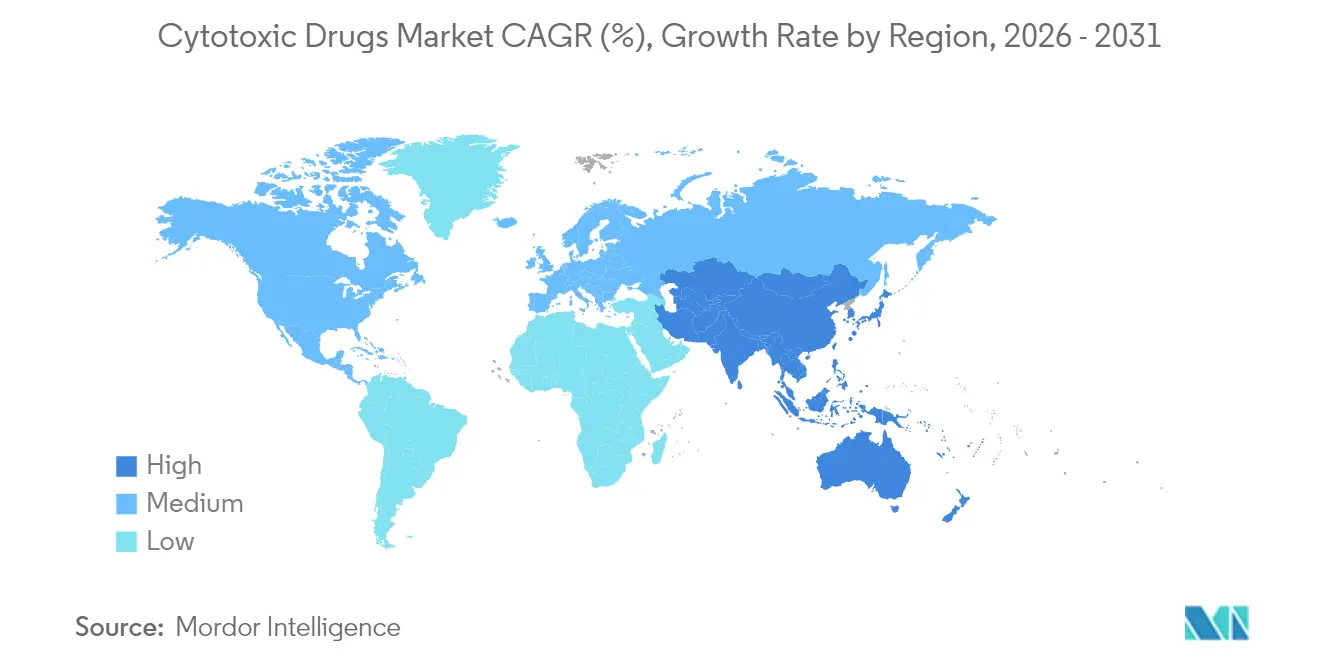
- By geography, North America held 42.15% share of the cytotoxic drugs market in 2025, yet Asia-Pacific grows the fastest at 10.07% CAGR to 2031.
- By distribution channel, retail pharmacies led with 40.65% share in 2025, whereas online pharmacies post a 9.11% CAGR through 2031.
Note: Market size and forecast figures in this report are generated using Mordor Intelligence’s proprietary estimation framework, updated with the latest available data and insights as of 2026.
Global Cytotoxic Drugs Market Trends and Insights
Drivers Impact Analysis*
| Driver | (~) % Impact on CAGR Forecast | Geographic Relevance | Impact Timeline |
|---|---|---|---|
| Rising cancer incidence & earlier diagnosis | +1.2% | Global with emphasis on APAC and North America | Medium term (2-4 years) |
| Expanding reimbursement for chemotherapy regimens | +0.8% | North America and EU extending into select APAC markets | Short term (≤ 2 years) |
| Pipeline approvals of next-gen cytotoxic formulations | +0.9% | Global led by US FDA and China NMPA approvals | Medium term (2-4 years) |
| Surging demand across low- and middle-income countries | +1.1% | APAC core, Latin America, MEA | Long term (≥ 4 years) |
| AI-driven drug-repurposing accelerating cytotoxic combos | +0.6% | North America and EU research hubs | Long term (≥ 4 years) |
| ADC payload demand for cytotoxics | +0.7% | Global, concentrated in major pharmaceutical markets | Medium term (2-4 years) |
| Source: Mordor Intelligence | |||
Rising Cancer Incidence & Earlier Diagnosis
The number of newly diagnosed cancer cases crossed 2.04 million in the United States for the first time in 2025, reinforcing a large treatment pool for cytotoxic agents[1]. Improved imaging, AI-enabled screening, and aging demographics bring malignancies to clinical attention at stages where cytotoxics remain standard of care. Emerging nations roll out population-wide screening that uncovers earlier-stage tumors and unlocks demand for cost-effective chemotherapy. These factors collectively raise treatment volumes and extend therapy durations, strengthening baseline growth for the cytotoxic drugs market.
Expanding Reimbursement For Chemotherapy Regimens
Medicare’s 2025 introduction of a USD 2,000 annual cap on patient out-of-pocket drug costs slashes financial barriers for multi-agent chemotherapy. Private insurers increasingly mirror this ceiling, smoothing access to high-dose and combination protocols that previously strained household budgets. Similar reforms appear in China, where the national medical insurance list now includes recently approved cytotoxics, while European payers sustain comprehensive oncology packages. The resulting reimbursement expansion translates into higher treatment adherence, broader use of supportive care drugs, and faster uptake of newly launched cytotoxics.
Pipeline Approvals Of Next-Gen Cytotoxic Formulations
Regulators accelerated clearances for optimized cytotoxic regimens in 2024–2025; the FDA sanctioned treosulfan with fludarabine for allogeneic stem-cell conditioning, demonstrating survival benefits over busulfan. China’s NMPA approved more than 80 antineoplastic chemical entities during 2024 alone[2]. These decisions underscore confidence in reformulated payloads that integrate sustained-release technologies, oral bioavailability gains, or antibody targeting. Each approval enlarges the addressable market while signaling continued relevance of cytotoxic modes of action in precision-therapy settings.
Surging Demand Across Low- And Middle-Income Countries
Over 75% of projected cancer deaths will occur in low- and middle-income countries (LMICs) within a decade. Health ministries and global partnerships direct resources toward affordable chemotherapy, often via locally manufactured generics that cut import costs. India’s NexCAR19 development illustrates domestic innovation that reduces advanced therapy cost burdens by more than 90% compared with Western CAR-T analogues. As oncology infrastructure matures, volume growth from LMICs offsets price pressure and supports continued expansion of the cytotoxic drugs market.
Restraints Impact Analysis*
| Restraint | (~) % Impact on CAGR Forecast | Geographic Relevance | Impact Timeline |
|---|---|---|---|
| Severe adverse-effect profile limits dosage adherence | −0.9% | Global with greater impact in aging populations | Short term (≤ 2 years) |
| High cost of HPAPI containment & compliance | −0.7% | North America and EU manufacturing hubs | Medium term (2-4 years) |
| Shift of R&D budgets toward targeted & immuno-oncology drugs | −1.1% | Global pharmaceutical R&D centers | Long term (≥ 4 years) |
| Environmental regulations on cytotoxic effluent disposal | −0.5% | Developed markets with stringent oversight | Medium term (2-4 years) |
| Source: Mordor Intelligence | |||
Severe Adverse-Effect Profile Limits Dosage Adherence
Toxicity-driven discontinuation persists, with dropout rates ranging from 27% to 53% in colorectal cancer treatments. Shortages of cornerstone agents such as cisplatin in 2023 amplified reliance on alternative drugs and spotlighted the narrow therapeutic margins of many chemotherapies. Although supportive care and pharmacist-led adherence programs mitigate some challenges, the core toxicity profile constrains broader application and affects real-world outcomes.
Shift Of R&D Budgets Toward Targeted & Immuno-Oncology Drugs
Capital flows increasingly favor immunotherapies and precision modalities, diverting funds from traditional cytotoxic discovery. High-potency API containment demands and environmental obligations under EPA and EMA rules elevate cost structures[3]. This mix of budgetary preference and compliance expense narrows the pool of new cytotoxic entrants, even as reformulated legacy agents secure approvals. While ADCs realign attention to cytotoxic payloads, standalone chemotherapy innovation faces competitive pressure in investor portfolios.
*Our forecasts treat driver/restraint impacts as directional, not additive. The impact forecasts reflect baseline growth, mix effects, and variable interactions.
Segment Analysis
By Route of Administration: Oral Formulations Challenge Injectable Dominance
Parenteral drugs dominated with 68.87% market share in 2025, anchored by clinician confidence in controlled dosing for acute and combination regimens. Oral cytotoxics, however, record the segment’s quickest expansion at 8.79% CAGR through 2031 as patient-centric care models pivot toward home administration. The cytotoxic drugs market size for oral treatments is projected to outgrow hospital-exclusive volumes when improved bioavailability formulations reach widespread reimbursement. Advances such as sustained-release tablets reduce peak plasma toxicity while maintaining efficacy, driving oncologists to integrate oral options into long-term combination plans.
Convenience bolsters adherence when pharmacists monitor dosing schedules through telehealth platforms that flag missed pills and manage side effects. Injectables remain critical in induction and salvage protocols where rapid cytoreduction is essential, yet broader patient acceptance of tablets and capsules shifts revenue momentum toward oral formats. As e-prescription ecosystems mature, online pharmacy distribution further accelerates uptake of at-home regimens, creating fresh competitive angles for formulation innovators.


By Drug Type: Antimetabolites Accelerate Despite Alkylating Leadership
Alkylating agents commanded 30.10% share in 2025 owing to their broad mechanistic reach and longstanding physician familiarity. The cytotoxic drugs market share attributed to this class underscores its entrenched role in foundation regimens for hematologic and solid tumors. Antimetabolites, featuring refined toxicity and combination potential, outpace all other types at a 7.02% CAGR. AI-enabled drug repurposing identifies synergistic antimetabolite partners that enhance outcomes in resistant cancers.
Development pipelines increasingly leverage ADCs that carry topoisomerase inhibitors and plant alkaloid derivatives into antigen-expressing tumors, breathing new commercial life into underutilized payloads. FDA endorsement of treosulfan demonstrates regulators’ confidence in optimized alkylators even as antimetabolites seize growth momentum. The interplay of incremental innovation and novel conjugation strategies reshapes competitive dynamics across the drug-type spectrum.
By Application: Pancreatic Cancer Momentum Outstrips Breast Cancer Scale
Breast cancer interventions led revenue with 23.35% slice of 2025 demand, reflecting large patient volumes and embedded use of combination chemotherapy alongside targeted agents. Pancreatic cancer indications, while smaller in absolute terms, exhibit an 7.78% CAGR as machine-learning screens generate 300-plus validated synergistic drug pairs that overcome historical resistance. The cytotoxic drugs market size for pancreatic therapy is thus on course for the segment’s highest proportional increase through 2031.
Lung, colorectal, and prostate cancers stay central to revenue diversification as emerging ADCs combine veterinary proven payloads with precision antibodies that lower systemic toxicity. Regulatory nods for agents like datopotamab deruxtecan in HR-positive breast cancer reaffirm the commercial case for payload innovation that reinvigorates cytotoxic classes. Multimodal regimens integrating radioligands and checkpoint inhibitors further widen demand footprints across tumor types.
By Distribution Channel: Digital Platforms Redefine Access
Retail pharmacies captured 40.65% of 2025 revenue owing to in-person counseling and established reimbursement billing. Online channels, however, post the fastest 9.11% CAGR as telehealth normalizes drug delivery straight to patient homes. The cytotoxic drugs market size driven by e-pharmacy orders is expanding when Medicare’s out-of-pocket caps prompt comparison shopping across digital portals that also support adherence tracking. Hospital pharmacies keep a pivotal role in intensive regimens and investigational therapy dispensing yet collaborate with specialty providers that manage complex cold-chain and hazardous-drug logistics.
Centralized compounding hubs tied to large online franchises reduce wastage and elevate safety compliance under USP-800, appealing to payers and providers looking to curtail handling costs. As blockchain-enabled track-and-trace proves supply authenticity, digital channels will progressively standardize across oncology practices.
Geography Analysis
North America led revenue with 42.15% share in 2025, propelled by comprehensive insurance coverage and robust clinical trial activity. Medicare’s cost-sharing cap beginning in 2025 widens the addressable patient base for multi-agent cycles and supports higher therapy adherence. Venture investment and favorable orphan-drug incentives keep the United States at the forefront of ADC and oral formulation breakthroughs. Canada adds analytical depth through machine-learning incidence forecasts that allow provincial health authorities to budget accurately for chemotherapy inventories.
Asia-Pacific registers a vigorous 10.07% CAGR and now anchors global manufacturing scaleouts that lower finished-dose costs. China’s NMPA clearance of 228 drugs in 2024, with 37% classified as antineoplastics, signals regulatory momentum supporting domestic innovators. India’s localization drive exemplified by NexCAR19 and large API parks, Japan’s conditional nods for isatuximab in multiple myeloma, and Korea’s bioconjugate trials collectively form a vibrant ecosystem that accelerates both clinical adoption and export potential.
Europe maintains balanced progress through harmonized EMA procedures that give companies a single pathway to 27 markets. The agency’s approval of Roche’s Alecensa as adjuvant therapy highlights precision oncology leadership in integrating cytotoxic payloads into early disease settings. Contract development giants such as Lonza expand Swiss conjugation suites to serve escalating ADC demand. Public healthcare frameworks secure broad patient access yet heighten price scrutiny, pressing suppliers to justify incremental benefits.
Middle East and Africa plus South America are smaller in absolute terms yet register double-digit upticks where multilateral health initiatives lift chemotherapy availability. Infrastructure projects, such as oncology centers co-funded by Gulf sovereign wealth funds, facilitate region-specific supply networks. The Access to Oncology Medicines Coalition channels technical assistance and pooled procurement tools that shorten supply timelines, solidifying emerging-market contributions to the cytotoxic drugs market.
Regulatory Landscape
Regulation of cytotoxic drugs remains anchored to stringent quality, validation, and hazardous-drug handling requirements across major markets. In the United States, FDA cGMP expectations under 21 CFR Part 211 and API GMP principles (ICH Q7) continue to shape manufacturing controls for sterile injectables and oral solid doses, while process validation guidance reinforces lifecycle validation and contamination-control expectations that are central for high-potency products.
In Europe, the EMA continues to refine guidance on the evaluation of anticancer medicinal products, and the 2026 EU Pharmaceutical Package compromise texts introduced structural reforms, including faster assessment pathways and stronger medicine-shortage governance (including prevention planning), which raise the compliance bar for supply continuity. In India, CDSCO Subject Expert Committee (Oncology) recommendation cycles in 2025-2026 continued to gate clinical trial and marketing permissions, and the New Drugs and Clinical Trials (Amendment) Rules, 2026 maintained tight oversight by excluding cytotoxic drugs from a simplified expedited manufacturing route applied to certain other products. This reinforces the need for conventional review pathways for these agents.
Competitive Landscape
Industry concentration is moderate. Pfizer’s USD 43 billion purchase of Seagen advances its ADC portfolio and affirms the rationale for marrying legacy cytotoxic compounds with antibody precision. ONO Pharmaceutical’s USD 2.4 billion agreement for Deciphera shows mid-cap players seeking pipeline diversity through bolt-on deals in specialized cytotoxic niches. Contract manufacturers expand high-potency suites as demand surges for commercial-scale conjugations.
Product strategy centers on payload innovation, oral reformulation, and digital patient-support ecosystems that mitigate toxicity and reinforce adherence. Biocon’s bevacizumab biosimilar approval and Novartis’ radioligand expansions illustrate how adjacent technology families enter combination protocols that include cytotoxic backbones. Disruptors leverage AI to map drug-interaction networks, guiding co-formulation decisions that lengthen product life cycles while differentiating safety profiles.
Regional manufacturers in China and India scale cost-effective generics, raising competitive thresholds for pricing in LMICs and pushing multinationals toward premium, targeted-delivery spaces. Strategic collaborations, such as Sanofi’s radioligand venture with Orano, highlight cross-disciplinary synergies that can complement cytotoxic assets. As large portfolios tilt to mixed-modality regimens, suppliers that bundle cytotoxic, targeted, and immunologic assets gain holistic contracting leverage with payers and providers.
Cytotoxic Drugs Industry Leaders
-
Roche Holding AG
-
Novartis AG
-
Pfizer Inc.
-
Johnson & Johnson
-
Sanofi SA
- *Disclaimer: Major Players sorted in no particular order

Market Opportunities and Future Outlook
Manufacturing and packaging capacity that supports high-potency containment and hazardous-drug handling is a clear whitespace area as oncology volumes rise and delivery formats diversify across oral and parenteral cytotoxics. Recent investments and authorizations point to this bottleneck: BSP Pharmaceuticals announced a multi-year EUR 530 million investment through 2028 to expand its Latina, Italy site for cytotoxic and non-cytotoxic manufacturing, while Myonex in May 2026 authorized GMP primary packaging for cytotoxic and hazardous drug products at Le Haillan, France, and tripled capacity for these compounds. Axplora also reported progress in March 2026 on a USD 60 million HPAPI expansion in Gropello Cairoli, Italy, including a new 4,500 square meter R&D and laboratory hub, reflecting continued efforts to expand specialized infrastructure for both established chemotherapies and complex handling needs.
Opportunities also appear in compliance-led workflow upgrades and safer administration, where health systems and standards bodies are formalizing practices that reduce occupational exposure and improve consistency across sites. NHS Scotland DL(2025)14 and regional cytotoxic policies in the UK reinforce safe practice frameworks for systemic anti-cancer therapy (SACT), while EU handling expectations for hazardous medicinal products are tightening requirements for closed-system approaches across the lifecycle. On the technology front, peer-reviewed research in 2026 on logic-gated drug delivery, including DNA-drug conjugate approaches and modular antibody-ADC construction via bioorthogonal ligation, suggests a pathway for cytotoxic mechanisms to be used with more selective release and programmable targeting. This creates partnering and development space for companies that can translate these platforms into manufacturable, regulated products and scalable supply chains.
Recent Industry Developments
- July 2026: Novartis agreed to acquire UK-based Myricx Bio for USD 1.1 billion upfront plus up to USD 400 million in milestones to advance next-generation antibody-drug conjugates using N-myristoyltransferase inhibitor payloads. The deal highlights continued strategic focus on targeted delivery modalities that use cytotoxic-like payload concepts while seeking improved selectivity. It also increases competitive pressure on other oncology portfolios to secure differentiated payloads and conjugation know-how.
- June 2026: Roche announced the FDA accepted its New Drug Application for giredestrant under Priority Review as adjuvant treatment for ER-positive, HER2-negative breast cancer, with a stated target action date of 30 November 2026. Priority Review designation accelerates regulatory timelines and can reshape sequencing discussions in early-stage breast cancer regimens where chemotherapy backbones still play a major role. The filing also signals sustained investment in breast cancer franchises that influence broader contracting and formulary dynamics.
- January 2025: The US FDA approved treosulfan (Grafapex) with fludarabine for conditioning in allogeneic hematopoietic stem cell transplantation for patients with AML or MDS. This approval reinforces ongoing regulatory support for optimized cytotoxic regimens in high-intensity settings where outcomes are sensitive to conditioning choices. It also expands options for transplant centers and can shift utilization within alkylator-based conditioning protocols.
Research Methodology Framework and Report Scope
Market Definition and Coverage
This market is counted as revenues from prescription cytotoxic (cell killing) chemotherapy drugs used in cancer treatment and supplied through hospital, retail, and online pharmacy channels across major regions.
Scope exclusions: The sizing excludes antibody-drug conjugates, targeted kinase inhibitors, veterinary preparations, and pipeline molecules that do not have regulatory approval.
Segmentation Overview
- By Route of Administration
- Parenteral
- Oral
- By Drug Type
- Alkylating Agents
- Antitumor Antibiotics
- Antimetabolites
- Plant Alkaloids
- Topoisomerase Inhibitors
- Others
- By Application
- Breast Cancer
- Prostate Cancer
- Lung Cancer
- Pancreatic Cancer
- Colorectal Cancer
- Others
- By Distribution Channel
- Hospital Pharmacies
- Retail Pharmacies & Drug Stores
- Online Pharmacies
- Other Distribution Channels
- Geography
- North America
- United States
- Canada
- Mexico
- Europe
- Germany
- United Kingdom
- France
- Italy
- Spain
- Rest of Europe
- Asia-Pacific
- China
- Japan
- India
- South Korea
- Australia
- Rest of Asia-Pacific
- Middle East and Africa
- GCC
- South Africa
- Rest of Middle East and Africa
- South America
- Brazil
- Argentina
- Rest of South America
- North America
Data Sources, Market Sizing, and Validation
Desk Research
Desk research is used to set the disease and treatment context, then to anchor the market model to repeatable public indicators. We typically draw on sources such as the WHO and IARC for cancer incidence and prevalence context, and SEER-style cancer statistics for treatment uptake signals in major countries. Drug approval and label details are checked through regulators such as the FDA and EMA, and then supported by national health agencies and health technology assessment bodies where relevant.
To connect demand to actual use, we also review treatment guidelines and peer-reviewed oncology journals that discuss chemotherapy utilization and regimen shifts. Trade and pricing context is informed through sources such as UN Comtrade, national customs statistics, and trusted press coverage on shortages or capacity changes. When needed, our analysts use paid subscriptions for company financials and intelligence, patent databases, and shipment-level import and export databases to validate manufacturer exposure and supply signals. These desk research inputs are not exhaustive, and we also relied on other public references for data collection, validation, and clarification.
Primary Interviews and Surveys
Primary work focuses on oncology clinicians, hospital pharmacists, distributors, and manufacturer-side commercial or medical affairs roles who can explain regimen mix, switching patterns, and channel flows. We also test assumptions on genericization timing, stocking behavior, and price movement in different care settings, then reconcile those views with what we saw in desk sources before finalizing the model.
Distribution of primary research fieldwork respondents
| Company type | Respondent position | Region |
|---|---|---|
| Top tier: 34% | CXOs: 14% | APAC: 52% |
| Mid tier: 51% | Functional/Unit leaders: 41% | EMEA: 29% |
| Smaller Players: 15% | Managers: 45% | Americas: 19% |
Market-Sizing & Forecasting
Sizing starts with a top-down build that links the treated patient pool to chemotherapy use, then converts that demand pool into value using therapy mix and pricing logic. In practice, incidence and prevalence by tumor type are translated into patients on cytotoxic regimens using guideline-based regimen shares and real-world adoption feedback from interviews. Those volumes are then valued using average selling price ranges that reflect branded-to-generic mix, route of administration, and typical channel markups.
To keep totals realistic, the outputs are checked with selective bottom-up approximations, such as sampled drug volumes times average prices for a few high-use molecules, plus channel checks on hospital pharmacy purchasing patterns. Key inputs used in the model include cancer incidence trends, chemotherapy utilization rates in first line and later lines, shifts toward oral versus injectable use, generic entry timing and erosion curves, and shortage or supply-constraint signals that can affect availability and net pricing. When a country-level variable is weak, we fill gaps using proxy markets with similar treatment protocols and reimbursement access, then adjust based on expert feedback.
Forecasting is mainly done using scenario analysis, because changes in regimen mix, genericization, and reimbursement decisions can move the market even if incidence stays stable. The base case is built from expected disease burden, expected share of patients receiving cytotoxic therapy, and price progression assumptions tested with clinicians and channel participants.
Data Validation & Update Cycle
Before sign-off, results are checked against independent signals such as oncology drug spending trends, public procurement behavior where visible, and manufacturer revenue exposure that can be linked back to cytotoxic portfolios. Outliers are reviewed, and if a country or drug class shows unusual jumps, we recheck underlying regimen shares, price ranges, and uptake assumptions with another round of targeted calls. A second analyst reviews the calculations and logic, followed by a final review to confirm that definitions and exclusions were applied consistently.
The report is refreshed on an annual cycle, and interim updates are done when a material event is confirmed, such as a major generic launch, a guideline shift, or a significant shortage. Before delivery, a fresh pass is completed so clients receive the most current view available at that time.
Mordor Intelligence's Cytotoxic Drugs Market Size Versus Other Published Estimates
Published numbers for cytotoxic drugs do not always match because analysts choose different product boundaries, time horizons, and pricing rules, and these choices affect what is counted as part of the market. Differences also appear when one estimate leans more heavily on broad oncology spend proxies, instead of connecting demand to treatment use and then valuing it with realistic price ranges.
Cancer incidence and regimen utilization checks, together with regulator-verified product classification, are the evidence anchors that keep Mordor Intelligence's estimate tied to approved cytotoxic chemotherapy drugs and to how they are used in hospitals and pharmacies. Gaps in other figures often come from folding adjacent categories into the same bucket, using aggressive price-growth assumptions after generic entry, or using currency conversion timing that does not align with the market year being reported.
Benchmark comparison
| Source | Market Size | Gaps in Research Methodology |
|---|---|---|
| Mordor Intelligence | USD 16.21 B (2026) | |
| Industry Publisher A | USD 18.10 B (2025) | Uses a different base year and appears to apply a broader cytotoxic definition without clearly separating adjacent oncology drug classes, which can lift the starting value. |
| Research Publisher B | USD 16.56 B (2026) | Reports a close 2026 value, but the faster growth path suggests more optimistic post-generic price and uptake assumptions, which increases the forward curve compared with a regimen-mix led model. |
Across the three figures, the spread is mainly explained by how strictly cytotoxic-only scope is enforced, how the base year is chosen, and how price erosion after generic entry is handled. By keeping the inputs traceable to treated patients, regimen shares, and realistic price bands, the estimate stays easy to reproduce and practical to use for planning.
Key Questions Answered in the Report
What is the current value of the cytotoxic drugs market?
The market is valued at USD 16.21 billion in 2026 and is forecast to reach USD 21.06 billion by 2031.
Which region is growing the fastest in the cytotoxic drugs market?
Asia-Pacific records the highest CAGR at 10.07% through 2031, driven by regulatory modernization and manufacturing investments.
Which drug type shows the quickest growth?
Antimetabolites expand at a 7.02% CAGR, outpacing other classes as formulation upgrades boost therapeutic indices.
How are reimbursement changes affecting market demand?
A USD 2,000 Medicare out-of-pocket cap introduced in 2025 lowers financial hurdles, increasing patient access to multi-agent chemotherapy.
Why are oral cytotoxic formulations gaining traction?
Patients favor home dosing, while sustained-release technologies and digital adherence tools improve efficacy and convenience, resulting in a 8.79% CAGR for oral products.