
Current Sensor Market Size and Share
Market Overview
| Study Period | 2020 - 2031 |
|---|---|
| Market Size (2026) | USD 4.25 Billion |
| Market Size (2031) | USD 6.57 Billion |
| Growth Rate (2026 - 2031) | 9.13 % |
| Fastest Growing Market | Asia Pacific |
| Largest Market | North America |
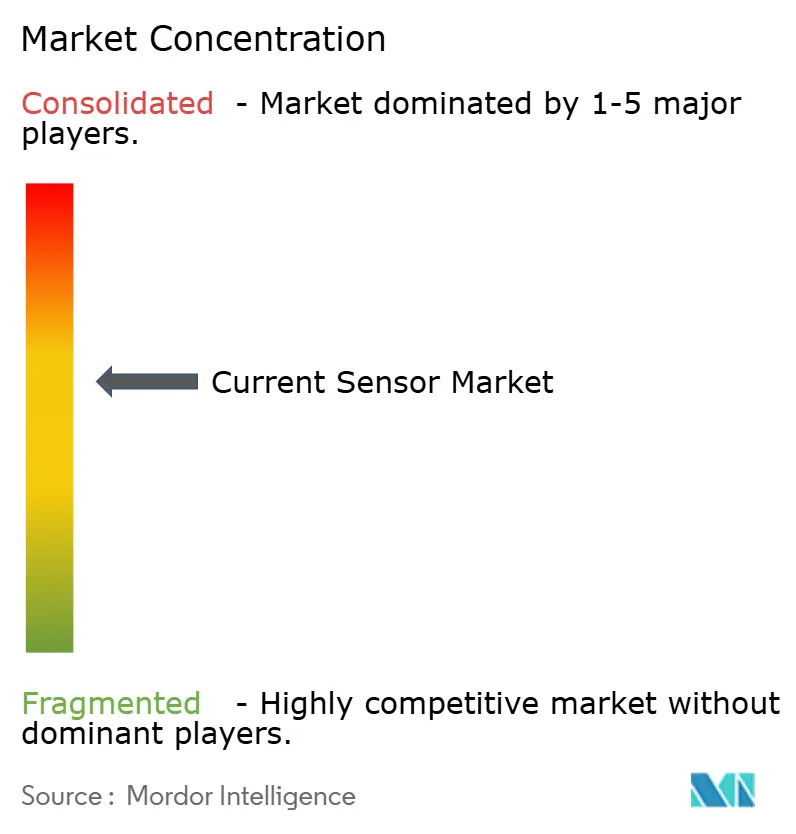
| Market Concentration | Medium |
Major Players
*Disclaimer: Major Players sorted in no particular order Image © Mordor Intelligence. Reuse requires attribution under CC BY 4.0. |
|
Current Sensor Market Analysis by Mordor Intelligence
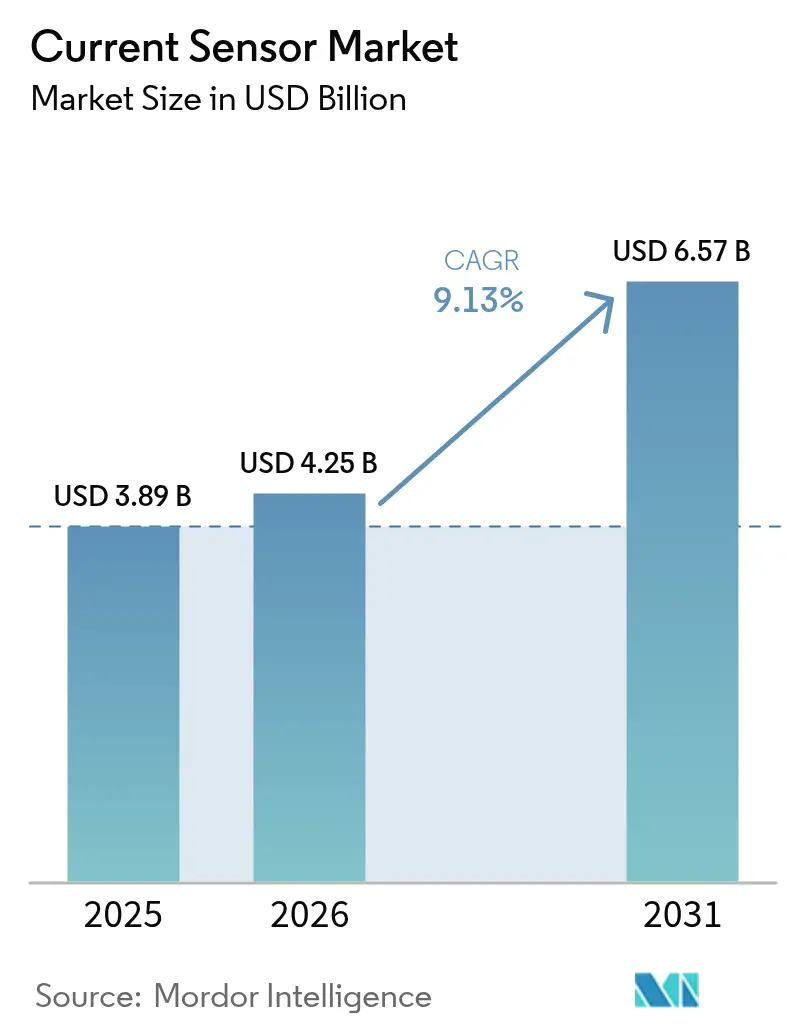
The current sensor market size is expected to grow from USD 3.89 billion in 2025 to USD 4.25 billion in 2026 and is forecast to reach USD 6.57 billion by 2031 at 9.13% CAGR over 2026-2031. This expansion mirrors surging electrification mandates, functional-safety requirements, and rising power-density targets across automotive, industrial, and energy domains. Demand for precise battery monitoring in electric vehicles (EVs) anchored growth, while renewable-energy installations multiplied sensor nodes per megawatt. Manufacturers pursued integrated Hall-effect and tunnelling-magnetoresistance (TMR) solutions to meet isolation, bandwidth, and efficiency needs. Supply‐chain volatility for magnetic alloys and cybersecurity compliance costs in smart-grid rollouts tempered momentum, yet data-center power monitoring for artificial-intelligence (AI) workloads opened a new revenue stream[1].
Key Report Takeaways
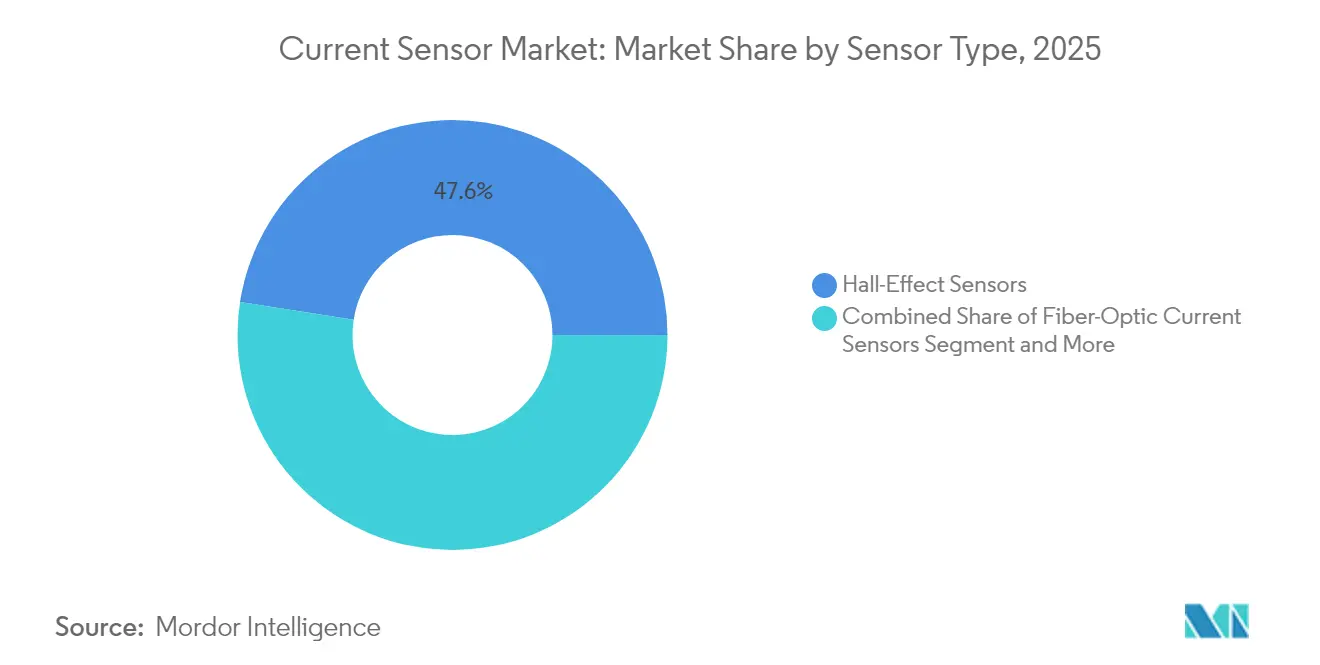
- By sensor type, Hall-effect devices led with 47.55% revenue share in 2025, whereas fiber-optic devices are projected to expand at a 12.21% CAGR to 2031.
- By isolation technology, the open-loop segment held 56.58% of the current sensor market share in 2025; closed-loop devices are growing at 11.12% CAGR through 2031.
- By current range, sensors above 600 A accounted for 13.66% of the current sensor market size and deliver the fastest 13.62% CAGR between 2026-2031.
- By end-user industry, automotive and transportation commanded 37.88% of the current sensor market size in 2025, while the energy and power segment is advancing at 10.61% CAGR to 2031.
- By geography, Asia-Pacific captured 46.27% revenue share in 2025 and continues to outpace global growth at a mid-single-digit CAGR.
Note: Market size and forecast figures in this report are generated using Mordor Intelligence’s proprietary estimation framework, updated with the latest available data and insights as of 2026.
Market Trends and Insights
Drivers Impact Analysis of Current Sensor Market*
| Driver | (~) % Impact on CAGR Forecast | Geographic Relevance | Impact Timeline |
|---|---|---|---|
| Proliferation of battery-powered and renewable energy systems | +2.1% | Global, with Asia-Pacific leading deployment | Medium term (2-4 years) |
| Acceleration of EV electrification and ADAS integration | +1.8% | Global, concentrated in China, the EU, and North America | Short term (≤ 2 years) |
| Functional-safety mandates (ISO 26262, IEC 61508) | +1.3% | EU and North America, primarily, expanding to Asia-Pacific | Long term (≥ 4 years) |
| Surge in bidirectional on-board charger (V2G) deployments | +0.9% | Early adoption in Japan, California, and expanding globally | Medium term (2-4 years) |
| High-frequency GaN/SiC power-electronics miniaturization | +1.1% | Global, with manufacturing concentrated in Asia-Pacific | Medium term (2-4 years) |
| Data-center power monitoring for AI workloads | +0.7% | North America and Asia-Pacific data center hubs | Short term (≤ 2 years) |
| Source: Mordor Intelligence | |||
Proliferation of Battery-Powered and Renewable-Energy Systems
Utility-scale solar and storage projects installed multiple monitoring points—DC combiner boxes, inverter inputs, and grid-tie links—creating a multiplier effect on sensor demand per megawatt. Bidirectional vehicle-to-grid (V2G) interfaces required sub-1% accuracy when measuring charge and discharge currents, pressuring traditional Hall-effect devices and boosting fiber-optic adoption for their electromagnetic immunity[2]. Asia-Pacific installations paired renewable-energy mandates with EV incentives, compounding sensor demand across automotive, industrial, and grid markets. Distributed-energy deployments also favored non-intrusive Rogowski coils for retrofit accuracy checks. Integrators increasingly specified digital interfaces, so field data fed directly into predictive-maintenance platforms.
Acceleration of EV Electrification and ADAS Integration
Premium EVs migrated to 800 V architectures, compelling sensors to sustain ≥5 kV isolation while delivering microsecond response times. A single battery-electric vehicle already required up to 50 current measurement points spanning traction inverters, battery-management systems (BMS), and thermal loops. ADAS actuators in steer-by-wire and brake-by-wire modules added redundant sensing channels for ISO 26262 compliance. TMR solutions gained share through superior temperature stability and lower quiescent current, positioning suppliers like Allegro MicroSystems to replace legacy Hall-effect parts in powertrain and chassis domains. SiC inverters, switching above 100 kHz, stretched bandwidth expectations beyond conventional current transformers, spurring investment in integrated sensing within power modules.
Functional-Safety Mandates (ISO 26262, IEC 61508)
Automakers escalated from performance-centric to safety-critical designs, embedding dual-channel architectures plus internal diagnostics that flag latent sensor drift in real time. TDK’s TAS8240 redundant TMR angle sensor exemplified this shift with four analog outputs, enabling ASIL-D compliance for steering-torque feedback. European regulators enforced stringent timelines, encouraging suppliers to offer pre-certified components and shortening vehicle validation cycles. Safety-oriented firmware updates required secure over-the-air (OTA) protocols, so sensors adopted authenticated digital buses to preserve integrity. These requirements widened the competitive gap between multinational incumbents and low-cost Hall-effect vendors lacking automotive safe-launch credentials.
High-Frequency GaN/SiC Power-Electronics Miniaturization
Wide-bandgap devices switched beyond 100 kHz, invalidating traditional CT bandwidth. Rogowski coils and fiber-optic alternatives sustained flat response curves, while module makers co-packaged sensors to cut parasitic inductance. ON Semiconductor integrated current-sense pads within SiC half-bridges aimed at Chinese EV traction platforms, enhancing loop stability and easing thermal design. Data-center operators adopted 48 V intermediate buses and placed sensors on every power shelf, raising attach rates per rack. Space-constrained power supplies demanded PCB-embedded solutions, prompting new SiP offerings where sensing ASICs resided beside GaN FETs without magnetic cores.
Restraints Impact Analysis of Current Sensor Market*
| Restraint | (~) % Impact on CAGR Forecast | Geographic Relevance | Impact Timeline |
|---|---|---|---|
| Average-selling-price erosion in Hall-effect sensors | -0.8% | Global, most pronounced in Asia-Pacific manufacturing | Short term (≤ 2 years) |
| Accuracy drift vs. shunt / CT alternatives | -0.5% | Global, affecting precision applications | Medium term (2-4 years) |
| Supply-chain tightness for high-permeability core alloys | -1.2% | Global, with acute shortages in rare earth materials | Medium term (2-4 years) |
| Cybersecurity compliance costs in smart-grid metering | -0.4% | EU and North America primarily | Long term (≥ 4 years) |
| Source: Mordor Intelligence | |||
Average-Selling-Price Erosion in Hall-Effect Sensors
Chinese fabs flooded commodity automotive grades, squeezing gross margins and triggering consolidation among incumbent suppliers. Tier-1 integrators centralized procurement to extract volume discounts, accelerating a race-to-bottom dynamic in the entry-level Hall-effect tier. Vendors attempted to differentiate through system-in-package features—diagnostics or digital interfaces—but price gaps still widened. Many niche manufacturers pivoted toward TMR or fiber-optic portfolios; however, the steep R&D commitment and lengthy automotive qualification deterred smaller firms. Integrated module strategies partly countered price pressure by bundling sensor plus MCU supervision within power stages, aligning with OEM value-based sourcing models.
Supply-Chain Tightness for High-Permeability Core Alloys
Fluxgate and CT designers relied on high-permeability alloys rich in rare earths, yet geopolitical tension and limited smelting capacity lengthened lead times beyond five months. Western suppliers scrambled for alternative sources outside China, while some redesigned products around synthetic ferrites. Delivery gaps forced OEMs to dual-source or switch to non-core technologies like TMR, accelerating technology substitution. Cost escalations flowed downstream to end users, particularly in grid instrumentation contracts that locked pricing up to five years. Innovation shifted toward core-less architectures, mitigating material risk and reducing sensor mass for high-volume EV applications.
*Our forecasts treat driver/restraint impacts as directional, not additive. The impact forecasts reflect baseline growth, mix effects, and variable interactions.
Current Sensor Market Segment Analysis
By Sensor Type:
Hall-Effect Retained Scale While TMR Disrupted Premium NichesHall-effect devices captured 47.55% revenue in 2025 due to mature production lines and proven reliability across traction inverters and industrial drives. Yet their bandwidth ceiling and thermal drift propelled designers toward TMR and fiber-optic options. Fiber-optic sensors recorded a 12.21% CAGR for 2026-2031 as renewable-energy installers specified galvanic-free measurement in high-voltage switchyards. TMR delivered 10× sensitivity over legacy Hall-effect, enabling low-ohmic drop in BMS shunt replacements and cutting standby power in battery packs.
Advanced EV inverters integrated a co-packaged TMR die for instantaneous phase-current feedback that met 1 MHz bandwidth targets. The current sensor market size for fibre-optic devices is forecast to reach USD 1,012 million by 2031 amid HVDC expansion. Inductive CTs retained a foothold above 1,000 A, while Rogowski coils addressed retrofit audits without interrupting conductors. The transition accelerated as power-density roadmaps demanded non-saturating, low-profile options suitable for tight module footprints.

By Isolation Technology:
Closed-Loop Gained Precision GroundOpen-loop architectures dominated with 56.58% share, balancing cost and safety for 400 V EV packs and 600 V solar inverters. Closed-loop devices—leveraging magnetic feedback for ±0.5% accuracy—posted an 11.12% CAGR as designers sharpened efficiency metrics. These sensors offset ambient temperature drift in onboard chargers and servo drives, ensuring regulators met eco-design standards in Europe. Current sensor market share for closed-loop options is expected to climb toward 41.05% by 2031.
Non-isolated shunt sensors thrived in emerging 48 V mild-hybrid platforms where galvanic isolation was non-mandatory. However, pack-level voltages creeping toward 60 V threatened their addressable window, inciting suppliers to pair shunts with digital isolators in hybrid packages. The convergence of analog front-end, sigma-delta converter, and isolation channel in a single IC redefined BOM costs and shrank PCB real estate, strengthening the closed-loop value proposition.
By Current Range:
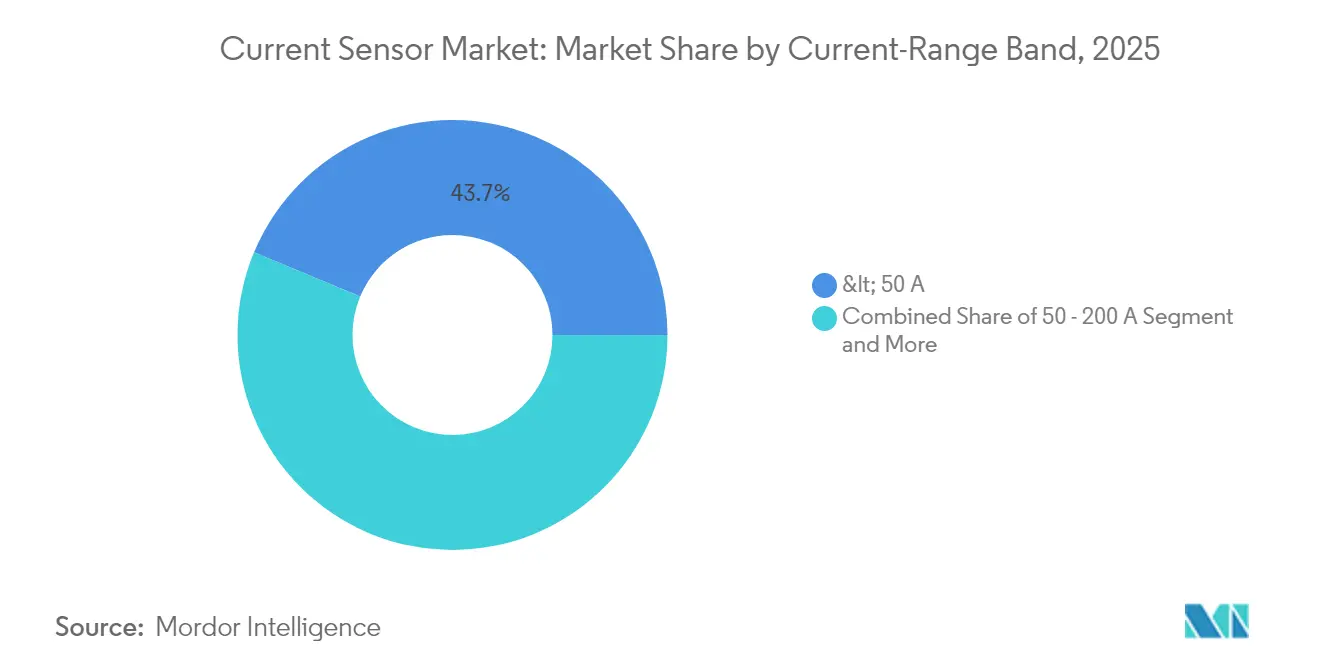
High-Power Segments AcceleratedSub-50 A units held 43.72% share in 2025, buoyed by consumer electronics, chargers, and factory automation I/O modules. The 50-200 A class powered mainstream EV traction motors and forklifts, forming an entrenched mid-market. From 200-600 A, adoption remained steady in commercial-vehicle drivelines and mid-scale storage inverters.
Above 600 A, demand surged at 13.62% CAGR as gigawatt-hour battery farms and 350 kW fast chargers proliferated. Current sensor market size for >600 A devices is set to exceed USD 1.35 billion by 2031, underpinned by grid-scale storage and V2G rollouts. Rogowski and fiber-optic platforms dominated here thanks to non-saturation at kiloamp levels and sub-microsecond response, meeting dynamic grid-code requirements for fault ride-through.
By End-User Industry:
Energy and Power Took Growth CrownAutomotive and transportation retained 37.88% share in 2025 as EV volumes compounded and ADAS penetrated mid-range vehicles. Industrial automation trailed, benefiting from robotics densification and predictive-maintenance programs. Energy and power posted the fastest 10.61% CAGR, driven by national renewable targets and multimegawatt storage projects.
Telecom and data-centre operators ramped power-shelf monitoring to optimize AI server loads, boosting attach rates for high-bandwidth sensors. Consumer electronics sustained meaningful volume through wearables and IoT nodes, though ASPs stayed low. Medical devices grew steadily on chronic-disease monitoring, demanding high-reliability, low-noise performance under stringent regulatory review.
Geography Analysis
APAC Current Sensor Market
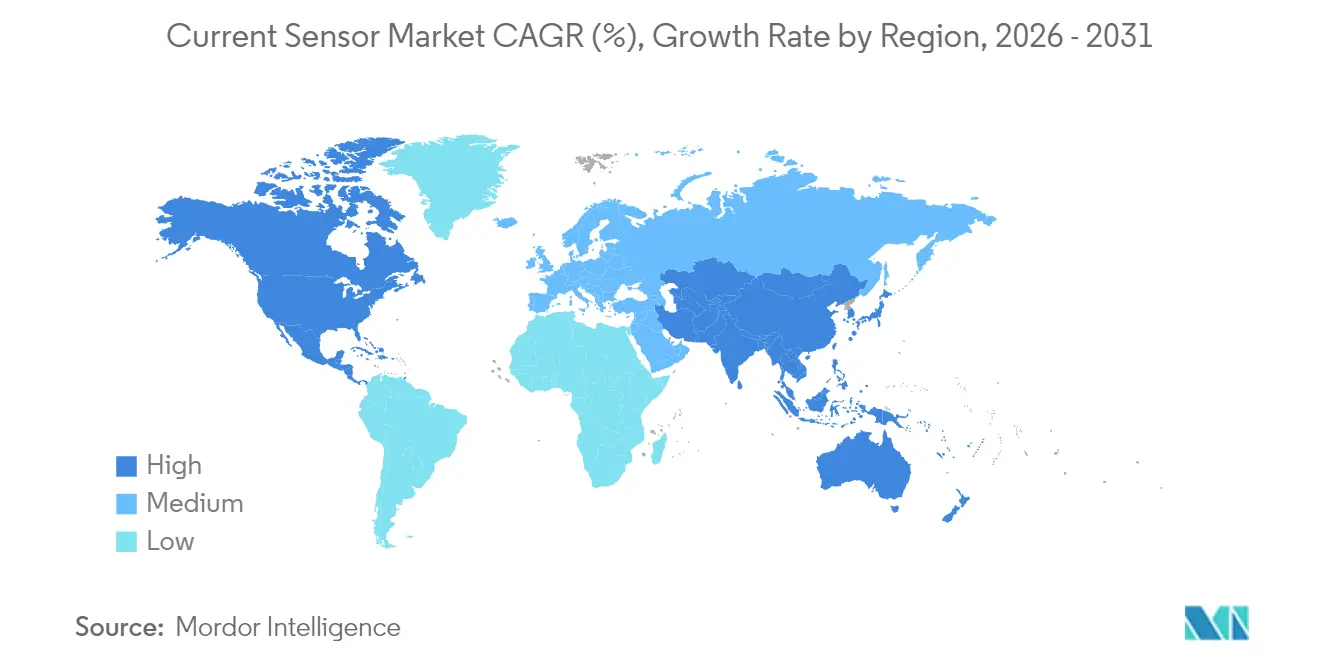
Asia-Pacific led with 46.27% revenue in 2025 because China scaled EV output and maintained dominant semiconductor packaging capacity. Governments funded renewables, prompting domestic fiber-optic sensor startups to emerge. Japan leveraged precision-manufacturing heritage to commercialize advanced TMR products, while South Korea integrated current sensing in SiC power-module export lines.
North America Current Sensor Market
North America ranked second. Hyperscale data-center spending and Inflation Reduction Act incentives for clean-energy projects spurred sensor procurement. United States reshoring programs favored local fabrication of safety-critical components destined for grid infrastructure and defense. Canada’s push for battery-raw-material autonomy underpinned regional sensor demand tied to mining electrification.
EMEA and LATAM Current Sensor Market
Europe pursued stringent CO₂ targets and functional-safety mandates, sustaining high ASPs for automotive-grade closed-loop devices. Germany and France hosted key R&D hubs linking sensor design with GaN inverter start-ups. The Middle East and Africa recorded emerging demand via solar-park investments, whereas Latin America’s growth followed automotive assembly clusters in Mexico and Brazil. Across regions, the current sensor market size co-moved with battery manufacturing footprints and renewable-energy capex.
Regulatory Landscape
Current sensor designs and go-to-market are shaped by functional-safety and industrial-connectivity requirements, alongside cybersecurity and product-safety expectations for connected devices. In automotive and safety-critical industrial applications, ISO 26262 and IEC 61508 push redundant architectures, diagnostics, and traceable safety processes, while smart-grid and IIoT deployments increasingly require security-by-design practices consistent with EU Cyber Resilience Act standardization work progressing through ETSI in 2026.
Standards activity in 2026 adds new compliance and interoperability anchors for suppliers shipping into industrial automation and renewable-energy installations. IEC 61757:2026 updates generic specifications for fiber-optic sensors, relevant to galvanically isolated measurement in high-voltage energy systems, and IEC/IEEE 60802:2026 publishes time-sensitive networking (TSN) profiles for industrial automation, supporting deterministic communication in sensor-dense networks. China also advanced standardization for industrial digitalization and robotics, including GB/T 47019-2026 for industrial internet platform data dictionaries (implemented May 1, 2026) and T/CAMETA 001110-2026 for industrial robot sensor interfaces and communication protocols (effective April 1, 2026), reinforcing localization and conformance needs for suppliers targeting China-based automation ecosystems.
Value Chain Analysis
The current sensor value chain begins with materials and components such as magnetic elements (cores, shielding, and high-permeability alloys), silicon (Hall, TMR, and mixed-signal ASICs), passives, packaging substrates, and isolation components. It then moves through wafer fabrication, assembly and test, and module integration into inverters, onboard chargers, BMS, drives, and power shelves. Distribution typically runs through direct OEM and Tier-1 engagements for automotive and grid programs, and through broadline and industrial channels for automation, renewables EPCs, and retrofit monitoring.
Bottlenecks concentrate upstream in specialty magnetic materials and in mature-node analog capacity, with constrained 8-inch wafer utilization intersecting demand for power and sensing ICs. In 2026, pricing and lead-time tightening was visible across semiconductors and connectors, with reports of sensor-relevant increases and extended delivery timelines, while selective shortages persisted in pockets such as memory and high-capacitance MLCCs that can still disrupt sensor module BOM availability. At the manufacturing end, suppliers are also reshaping capacity and localization; for example, Infineon opened its EUR 5 billion Smart Power Fab in Dresden in July 2026, supporting power-semiconductor supply for software-defined vehicles, renewable energy, and AI data-center power infrastructure, which lifts availability of adjacent power and sensing building blocks used in integrated current-sense solutions.
Competitive Landscape
The sector exhibited moderate fragmentation as top five suppliers controlled under 60% combined sales. Allegro MicroSystems, Infineon Technologies, and TDK Corporation leveraged IDM fabs and broad patent portfolios to dominate high-volume automotive and industrial sockets. Infineon paired Hall-effect sensing with gate drivers, capturing BOM synergies in traction inverters.
Specialist firms targeted niches: LEM focused on railway and high-current modules, while startup MDT pushed TMR angle sensors into collaborative robots. Collaboration surged; ON Semiconductor aligned with module packagers to embed sensing dice inside SiC half-bridges, shrinking loop area and improving EMI. Tesla patented integrated flux shields, signalling OEM in-house sensor development and raising competitive tension.
Price rivalry stayed muted at the premium end; differentiation revolved around bandwidth, safety certification, and isolation-voltage headroom. Suppliers invested in cybersecurity stacks so sensors met smart-grid IEC 62443 guidance. Consolidation was anticipated as scale became vital to fund R&D in core-less magnetic materials and AI-enabled diagnostics.
Current Sensor Industry Leaders
-
Allegro MicroSystems, LLC
-
TDK Corporation (TDK-Micronas GmbH)
-
Infineon Technologies AG
-
Melexis NV
-
Honeywell International Inc.
- *Disclaimer: Major Players sorted in no particular order
Current Sensor Market Companies Covered in this Report
- Allegro MicroSystems Inc.
- TDK Corporation (TDK-Micronas GmbH)
- Asahi Kasei Microdevices Corp.
- Infineon Technologies AG
- Tamura Corporation
- Melexis NV
- Honeywell International Inc.
- Texas Instruments Inc.
- Sensitec GmbH
- LEM International SA
- Pulse Electronics Corp.
- ACEINNA Inc.
- Vacuumschmelze GmbH & Co KG
- MagnTek Microelectronics Co. Ltd.
- NewJapanRadio Co. Ltd.
- Murata Manufacturing Co. Ltd.
- Onsemi Corp.
- ROHM Semiconductor Co. Ltd.
- Sensata Technologies Inc.
- NK Technologies
- ABB Ltd.
- CR Magnetics Inc.
- Eaton Corp. plc
- LEMKEN AG
- Topworx Inc.
- Schneider Electric SE
Market Opportunities and Future Outlook
Wide-bandgap (SiC/GaN) switching and higher-power architectures create a whitespace for high-bandwidth, low-noise, isolated, and coreless current sensing across EV charging, traction inverters, and data-center power shelves. Product roadmaps reflect this shift: in March 2026, Infineon introduced the XENSIV TLE4978 hybrid current sensor combining Hall elements with a coil-based approach to deliver 9 MHz bandwidth for power conversion use cases, while Sinomags launched new TMR-based current sensors positioned for power electronics with MHz-class bandwidth. These launches support opportunities for suppliers that can package sensing with isolation, diagnostics, and EMI-robust behavior, particularly where conventional Hall-effect solutions face drift and bandwidth limits.
Interoperability and digitalization standards also create room for differentiated offerings that reduce commissioning and lifecycle costs in industrial automation and energy systems. IEC/IEEE 60802:2026 formalizes TSN profiles that help integrate sensor telemetry into deterministic industrial networks, and the Industrial Digital Twin Association guidance for Submodel Sensor 4.0 (using constructs such as IEC 61406 and ECLASS) promotes machine-readable identification and property definitions for sensors. Together, these elements support opportunities in sensors with authenticated digital interfaces and standardized data models, aligning with predictive and prescriptive maintenance workflows where end users want faster integration, vendor-agnostic replacement paths, and traceable device identities.
Recent Industry Developments in Current Sensor Market
- July 2026: Allegro MicroSystems launched the A81415, an ASIL-D certified power management IC integrating a wheel-speed sensor interface for brake-by-wire electromechanical braking systems. The integration tightens coupling between sensing and power control, helping OEMs reduce component count and simplify functional-safety validation in x-by-wire platforms.
- June 2026: TDK Corporation announced construction of a new sensor production factory in Japan to support sensor business growth. The added manufacturing footprint strengthens supply assurance for high-volume programs and supports localization strategies demanded by automotive and industrial customers.
- May 2025: TDK-Micronas expanded its Hall-effect portfolio with the HAL 3025, positioned as a stray-field robust sensor for EV motor and automotive safety systems. Stray-field immunity directly addresses noisy e-motor environments and supports more reliable position and current-related feedback loops as electrified powertrains add sensing points.
Current Sensor Market Report Scope and Research Methodology
Market Definition and Coverage
The current sensor market is defined as revenues generated from devices that measure and monitor electric current in AC or DC circuits, and that are sold into equipment and system builds across key end-use industries.
Scope exclusions: The sizing excludes external power semiconductors, connectors, passive components, and unrelated condition-monitoring sensors that do not measure current.
Segments Covered in This Report
-
By Sensor Type
- Hall-Effect Sensors
- Fiber-Optic Current Sensors
- Inductive / CT Sensors
- Fluxgate Sensors
- Rogowski-Coil Sensors
-
By Isolation Technology
- Open-Loop (Isolated)
- Closed-Loop (Isolated)
- Non-Isolated (Shunt-based)
-
By Current Range
- <50 A
- 50 – 200 A
- 200 – 600 A
- >600 A
-
By End-User Industry
- Automotive and Transportation
- Industrial Automation and Robotics
- Energy and Power (Solar, Wind, ESS)
- Consumer Electronics
- Telecom and Data-Centers
- Medical Devices
-
By Geography
-
North America
- United States
- Canada
- Mexico
-
South America
- Brazil
- Argentina
- Rest of South America
-
Europe
- Germany
- United Kingdom
- France
- Italy
- Russia
- Rest of Europe
-
Asia-Pacific
- China
- Japan
- South Korea
- India
- ASEAN
- Rest of Asia-Pacific
-
Middle East and Africa
-
Middle East
- Saudi Arabia
- United Arab Emirates
- Turkey
- Rest of Middle East
-
Africa
- South Africa
- Nigeria
- Rest of Africa
-
Middle East
-
North America
Data Sources, Market Sizing, and Validation
Desk Research
Desk research was used to set the market boundaries, identify the main demand pools, and collect consistent reference series that could be reused across regions. For this market, we leaned on public sources such as International Energy Agency (IEA) statistics for electrification and energy-transition indicators, US Energy Information Administration (EIA) data for power trends, and International Renewable Energy Agency (IRENA) updates for renewable and storage additions.
To keep the model grounded in real product movement and compliance needs, we also reviewed sources such as IEEE and other peer-reviewed engineering journals for sensor adoption patterns, government trade statistics and customs releases where sensor-related codes are informative, and patent databases to map technology momentum across sensing approaches. Company filings, investor presentations, association pages, and reputable press were used to cross-check shipment direction and pricing commentary. We then used paid subscriptions for company financials and shipment-level trade records selectively where public detail was thin. The desk sources listed above are illustrative, and many other references were used to collect, validate, and clarify data points during the work.
Primary Interviews and Surveys
Primary work focused on validating what is actually being purchased, how it is specified, and how pricing changes with performance and volume. We spoke with a mix of component suppliers, module and board-level integrators, OEM engineering and sourcing teams, and distribution-channel contacts across major regions so gaps from desk research could be closed and assumptions could be tested in practical terms.
Distribution of primary research fieldwork respondents
| Company type | Respondent position | Region |
|---|---|---|
| Top tier: 39% | CXOs: 12% | APAC: 52% |
| Mid tier: 43% | Functional/Unit leaders: 39% | EMEA: 29% |
| Smaller Players: 18% | Managers: 49% | Americas: 19% |
Market-Sizing & Forecasting
Sizing started with a top-down build that reconstructs the addressable demand pool from electrification and power-conversion activity, and then applies current-sensing content per system where monitoring and protection are required. The totals were corroborated with selective bottom-up approximations, such as sampled ASP multiplied by estimated unit volumes in high-usage applications, followed by channel checks to confirm whether the direction and scale make sense.
Key inputs used in the model include EV and hybrid production mix, renewable capacity additions and energy storage deployments, industrial motor drives and automation activity, data-center power buildouts, and typical sensor content by inverter, charger, BMS, and protection nodes. Pricing was handled through a practical ASP ladder by sensing type and isolation approach, and then adjusted by region using currency timing and import intensity. For the forecast, scenario analysis was used around electrification pace and grid and storage investment. The yearly curve was smoothed using expert guidance on qualification cycles and design-win timing. Where bottom-up evidence was incomplete, gaps were bridged using penetration rates and application-level content ranges that were rechecked during interviews.
Data Validation & Update Cycle
Validation was done through multiple checks so one noisy input would not swing the result too far. We compared outputs against independent signals such as EV production trajectories, renewable and storage build rates, and typical sensor nodes per power stage, and then reviewed any unusual region or application jumps before sign-off.
Anomalies triggered a second pass on assumptions, followed by quick re-contact with selected experts to confirm whether a change was real or just a data timing effect. Reports are refreshed annually, and interim updates are made when major events occur, such as regulation shifts, step-changes in EV adoption, or sudden pricing moves in key materials. Before delivery, an analyst runs a fresh update pass so clients receive the most current view available.
Mordor Intelligence's Current Sensor Market Size Compared With Other Published Estimates
Published market sizes for current sensors can differ because the scope lines are drawn differently, and because firms rely on different demand indicators and price logic. The benchmark table highlights this spread, and it also shows how timing choices, currency conversion windows, and what gets counted as a current sensor can shift the final number.
The table points to a key gap around what is treated as in-scope product revenue versus adjacent electronics that enable sensing. In Mordor Intelligence's model, only current-sensing devices and closely tied sensor modules are counted, and revenues from broader power-management ICs and unrelated protection parts are kept out, which reduces double counting when end equipment is also being sized.
Benchmark comparison
| Source | Market Size | Gaps in Research Methodology |
|---|---|---|
| Mordor Intelligence | USD 4.25 B (2026) | |
| Global Consultancy A | USD 3.24 B (2025) | Uses an earlier base year and a narrower demand build that leans heavily on automotive program volumes, which can understate growth from grid, storage, and data-center power monitoring. |
| Industry Publisher B | USD 3.29 B (2024) | Extends the horizon far out with higher long-term compounding, and the disclosed base-year figure reflects older pricing and slower content-per-system assumptions in electrified applications. |
Overall, the spread is explained mainly by base-year timing, what revenue is treated as a current sensor versus adjacent electronics, and how fast ASPs are assumed to move across high-volume programs. By keeping the inputs tied to observable demand pools and by rechecking content and pricing assumptions with practitioners, the estimate stays traceable and can be repeated with the same steps next year.
Key Questions Answered in the Report
What is the expected growth rate of the current sensor market between 2026 and 2031?
The market is projected to expand at a 9.13% CAGR, rising from USD 4.25 billion in 2026 to USD 6.57 billion by 2031.
Which region leads current sensor demand?
Asia-Pacific held 46.27% revenue share in 2025 on the back of China’s EV production scale and integrated semiconductor supply chains.
Which sensor technology is growing the fastest?
Fiber-optic current sensors are forecast to grow at a 12.21% CAGR through 2031 as high-voltage renewable-energy installations favor galvanic-free measurement.
How are functional-safety regulations affecting design?
Standards such as ISO 26262 and IEC 61508 push adoption of redundant architectures with built-in diagnostics, boosting demand for closed-loop and TMR solutions with ASIL-D compliance.