
Cryolite Market Size and Share
Market Overview
| Study Period | 2020 - 2031 |
|---|---|
| Market Size (2026) | USD 327.6 Million |
| Market Size (2031) | USD 401.08 Million |
| Growth Rate (2026 - 2031) | 4.13 % |
| Fastest Growing Market | Asia Pacific |
| Largest Market | Asia Pacific |
| Market Concentration | High |
Major Players *Disclaimer: Major Players sorted in no particular order Image © Mordor Intelligence. Reuse requires attribution under CC BY 4.0. | |
Cryolite Market Analysis by Mordor Intelligence
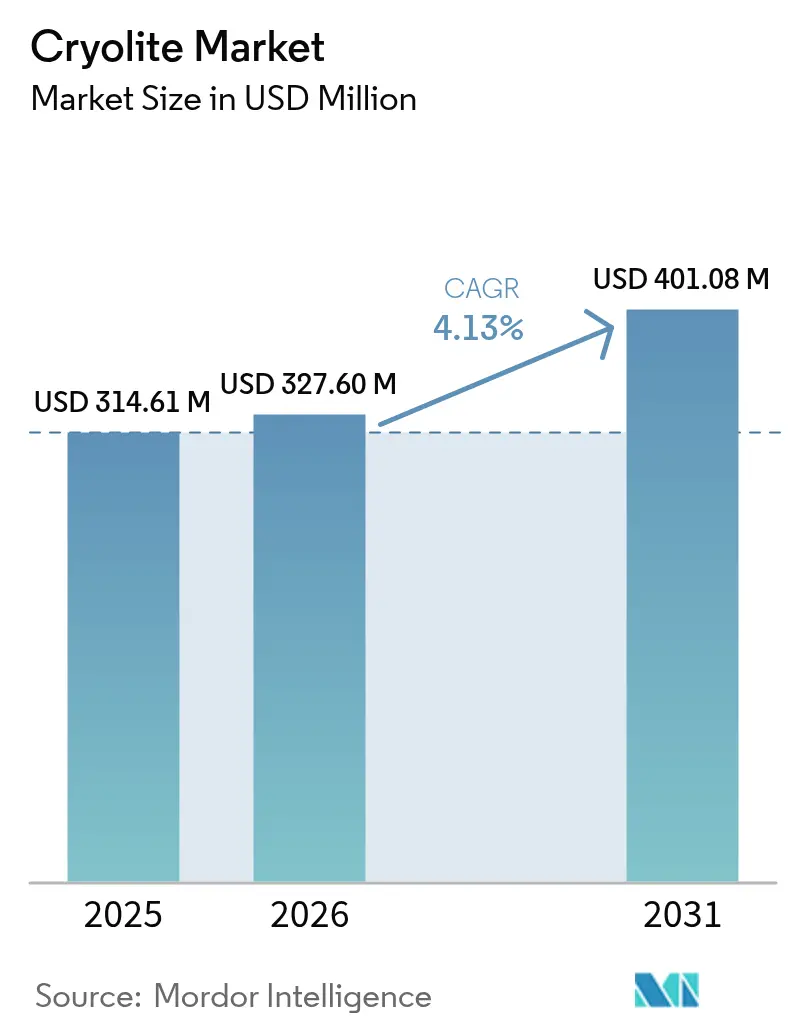
The Cryolite market size is expected to grow from USD 314.61 million in 2025 to USD 327.6 million in 2026 and is forecast to reach USD 401.08 million by 2031 at 4.13% CAGR over 2026-2031. Sustained primary-aluminum production keeps baseline consumption solid, as cryolite forms roughly 75-80% of the molten electrolyte in Hall–Héroult cells. Synthetic grades dominate supply, granular innovations improve handling safety, and recycling breakthroughs signal an emerging circular-economy narrative. Asia-Pacific retains clear leadership on the strength of China’s record 41.59 million t aluminum output in 2023, with downstream investments across India, Japan, and Southeast Asia supporting additional volume. Technology risk nevertheless looms as carbon-free inert-anode pilots advance, and stricter fluoride-exposure rules raise compliance costs in Europe and North America.
Key Report Takeaways
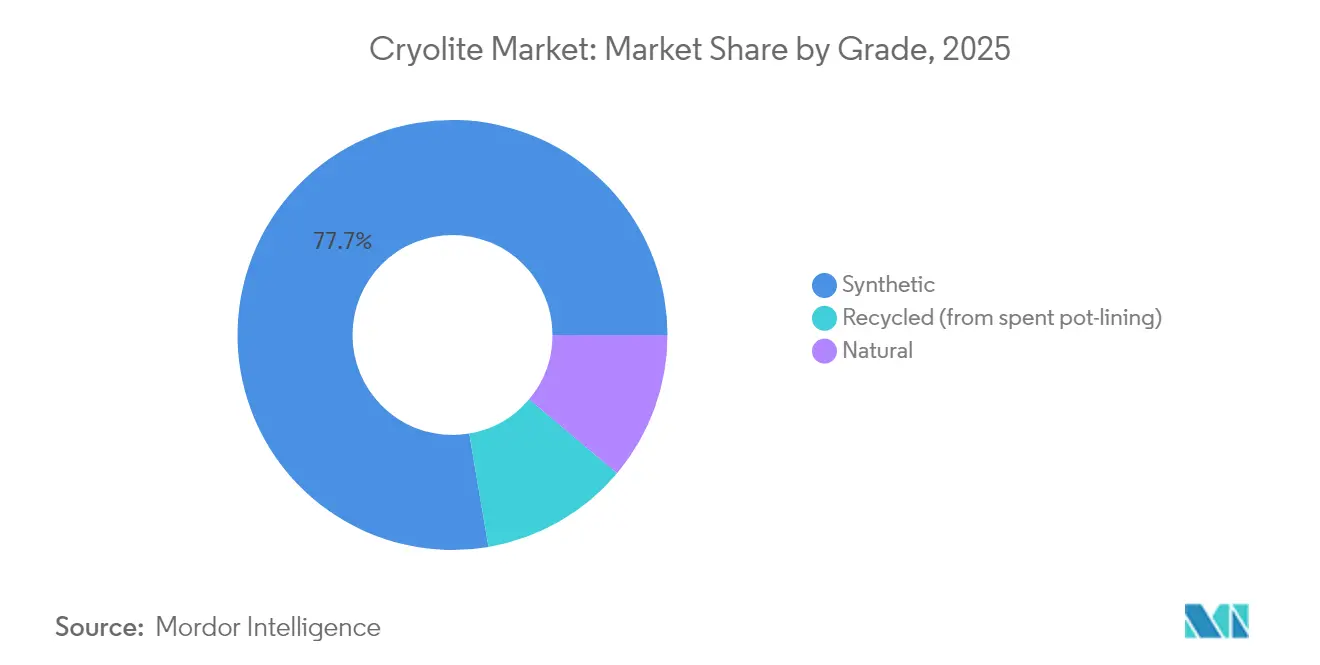
- By grade, Synthetic grade captured 77.68% of cryolite market share in 2025, while natural grade is forecast to expand at a 5.39% CAGR through 2031.
- By form, Powder form accounted for 57.05% of the cryolite market size in 2025; granular form is projected to advance at a 5.26% CAGR over 2026-2031.
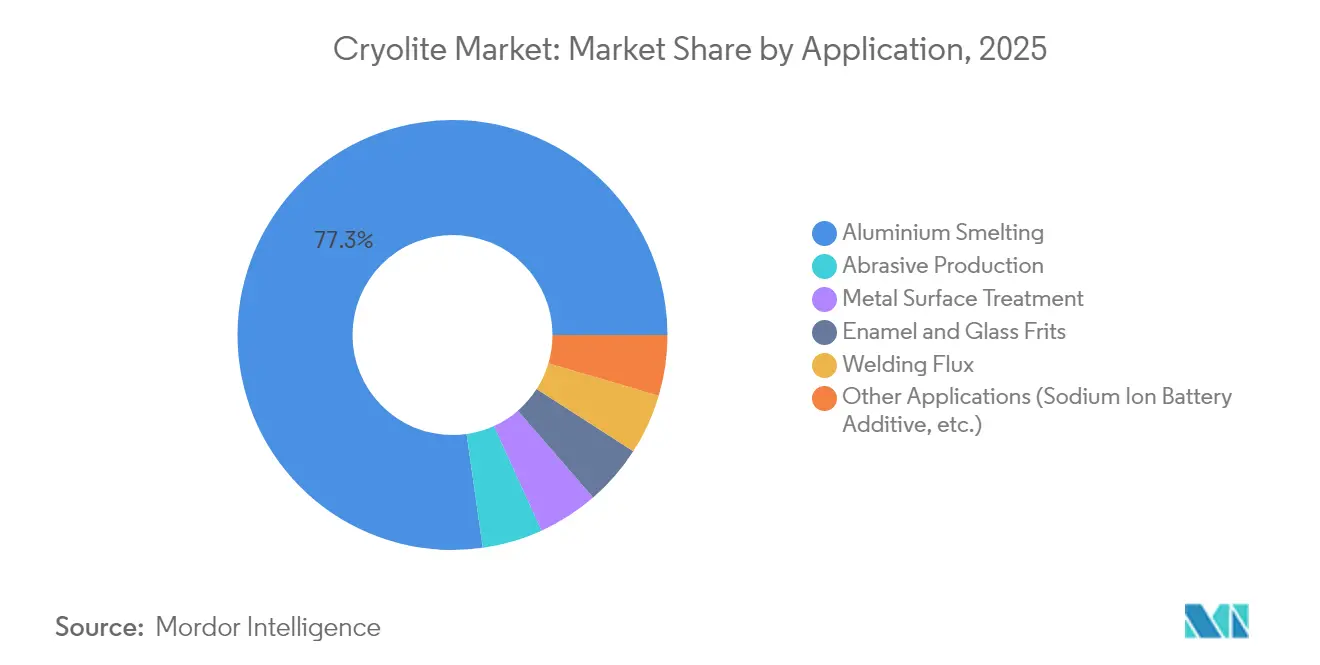
- By application, Aluminum smelting held 77.25% of the cryolite market size in 2025 and alternative uses are set to grow at a 5.41% CAGR to 2031.
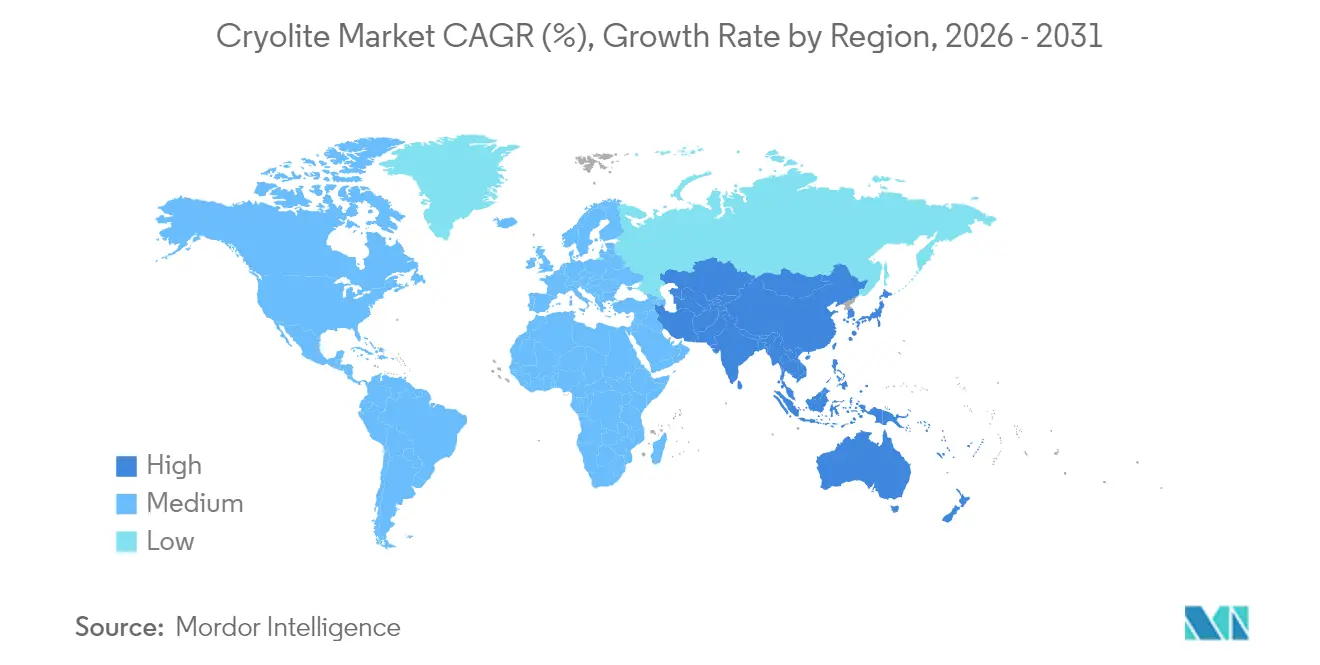
- By region, Asia-Pacific commanded 43.12% revenue share of the cryolite market in 2025 and is expected to post the fastest regional CAGR of 5.18% through 2031.
Note: Market size and forecast figures in this report are generated using Mordor Intelligence’s proprietary estimation framework, updated with the latest available data and insights as of 2026.
Market Trends and Insights
Drivers Impact Analysis of Cryolite Market*
| Driver | (~) % Impact on CAGR Forecast | Geographic Relevance | Impact Timeline |
|---|---|---|---|
| Growth in primary aluminium output | +1.2% | Global, with APAC core concentration | Medium term (2-4 years) |
| Expansion of bonded and coated abrasives industry | +0.8% | North America & EU, spill-over to APAC | Long term (≥ 4 years) |
| Rising demand for fluxes in welding electrodes | +0.6% | Global, with industrial concentration in APAC | Short term (≤ 2 years) |
| Increasing glass and enamel frits production | +0.4% | EU & North America, emerging in APAC | Medium term (2-4 years) |
| Sodium-ion battery cathode additive adoption | +0.3% | APAC core, early adoption in China | Long term (≥ 4 years) |
| Source: Mordor Intelligence | |||
Growth in Primary Aluminum Output
Robust aluminum consumption for electric vehicles and renewable-energy hardware underpins steady growth in smelter capacity additions, lifting baseline cryolite demand. The International Aluminium Institute projects global usage climbing from 86.2 million t in 2020 to 119.5 million t by 2030. China’s 2023 production hit 41.59 million t despite energy caps, reinforcing the region’s pull on cryolite supply. As smelters seek lighter carbon footprints with renewable electricity, cryolite remains a cost-effective electrolyte until inert-anode retrofits become commercial. Consulting studies flag a potential 16 million t aluminum supply gap by 2030, spurring USD 60-90 billion in new cell construction that would require proportional molten-bath volumes. The net effect is a positive mid-term demand signal, tempered only by longer-range technology substitution risk.
Expansion of Bonded and Coated Abrasives Industry
Industry 4.0 machining pushes manufacturers toward high-precision grinding wheels that run cooler and last longer. Cryolite acts as a performance filler in phenolic-resin abrasives, boosting cutting efficiency and wear resistance, as documented in legacy patents and corroborated by recent USGS manufacturing statistics[1]USGS National Minerals Information Center, “Abrasives Statistics,” usgs.gov. Aerospace and automotive OEMs now specify tighter surface-finish tolerances, encouraging premium wheel grades that command higher margins. Regional reshoring in North America and Western Europe diversifies demand away from Asian hubs, adding stability to supply chains. Over the long term, automated grinding cells amplify throughput and increase abrasive-wheel change-out frequency, sustaining incremental cryolite volumes even when per-wheel dosage remains small.
Rising Demand for Fluxes in Welding Electrodes
Modern bridge, offshore, and wind-tower fabrication uses high-strength steels that are sensitive to hydrogen cracking. Laboratory work shows that adding 5% K₃AlF₆ to electrode coatings can reduce diffusible hydrogen by 25%. As infrastructure outlays rise, certifiers enforce more stringent weld-quality rules, prompting fabricators to shift toward low-hydrogen electrodes formulated with cryolite. Rapid industrializing economies in Asia accelerate near-term uptake, while advanced economies replace legacy installations with higher-grade steel requiring similarly upgraded fluxes. The combined effect is a short-term lift to cryolite purchases from electrode producers, balanced against ongoing R&D into fluoride-free alternatives.
Increasing Glass and Enamel Frits Production
Enamel cookware, energy-efficient architectural glazing, and automotive glass all employ frits where cryolite lowers melting temperatures, generating energy savings of 50-100 °C. Building codes in the EU and North America reward low-emissivity glass, boosting demand for specialized frit compositions that rely on fluoride agents to control viscosity and optical properties. Automotive OEMs seek durable, decorative finishes for battery-electric vehicles, opening a profitable niche for high-purity cryolite in enamel coatings. Even as suppliers refine formulations to minimize fluoride loading, the sheer scale of the glass sector supports medium-term volume growth. Geographic uptake is strongest in regions with strict energy-efficiency mandates, cementing a steady pull on cryolite shipments over the forecast window.
Restraints Impact Analysis of Cryolite Market*
| Restraint | (~) % Impact on CAGR Forecast | Geographic Relevance | Impact Timeline |
|---|---|---|---|
| Occupational and environmental fluoride toxicity | -0.9% | Global, with stricter enforcement in EU & North America | Short term (≤ 2 years) |
| Limited natural ore deposits and supply risk | -0.6% | Global, with acute impact on premium applications | Medium term (2-4 years) |
| Shift toward fluoride-free inert-anode smelting | -1.4% | APAC core, with technology transfer to global markets | Long term (≥ 4 years) |
| Source: Mordor Intelligence | |||
Occupational and Environmental Fluoride Toxicity
Regulators are tightening exposure limits for fluoride compounds. The US EPA’s reregistration decisions set lower residue thresholds, while EU REACH frameworks demand comprehensive risk assessments[2]U.S. Environmental Protection Agency, “Cryolite Reregistration Eligibility Decision,” epa.gov. Compliance requires investments in exhaust scrubbing, worker monitoring, and waste-water treatment, adding cost for smaller producers. Occupational-health audits in modern smelters confirm significant progress versus legacy plants, yet public perception still pressures end users to explore lower-fluoride or fluoride-free alternatives. Heightened scrutiny can slow permitting for new production lines and increases documentation burdens, mainly in developed markets. Consequently, growth potential shifts toward suppliers with advanced environmental-management systems and transparent reporting.
Shift Toward Fluoride-Free Inert-Anode Smelting
Rio Tinto and Alcoa’s ELYSIS venture has allocated USD 285 million to scale aluminum cells that operate on inert anodes, eliminating both carbon emissions and fluoride electrolytes. Peer-reviewed analyses suggest that commercial adoption could slash the sector’s 651 Mt CO₂e footprint. Although pilot volumes remain small, Chinese producers control 90% of global high-amperage capacity and can accelerate rollout once economics align. Carbon pricing, green-metal premiums, and ESG-linked financing all favor technology transition, implying a latent demand drop for cryolite around the decade’s end. Market incumbents are hedging by funding cryolite-recycling projects while exploring fluorine-based additives for next-gen batteries to diversify product portfolios.
*Our forecasts treat driver/restraint impacts as directional, not additive. The impact forecasts reflect baseline growth, mix effects, and variable interactions.
Cryolite Market Segment Analysis
By Grade:
Synthetic Stability Amid Natural ScarcitySynthetic material dominated with 77.68% cryolite market share in 2025, reflecting the closure of Greenland’s Ivigtut mine and the comprehensive shift to fluorspar-based production. The cryolite market size for synthetic grades reached USD 244.4 million in 2025 and is projected to register steady mid-single-digit growth as aluminum smelters favor predictable chemical compositions. Natural grade edges forward at a 5.39% CAGR, serving premium frits, abrasives, and research niches where trace-metal thresholds are exacting. Recycled grade, reclaimed from spent pot-lining, remains small but achieved double-digit growth from a low base because waste-management regulations encourage circular routes.
Synthetic producers benefit from established batch-reactor networks and integrated fluorspar supply contracts, ensuring stable pricing and volume commitments with aluminum majors. Natural suppliers capitalize on scarcity value, commanding price premiums in specialist glass and abrasive segments that cannot tolerate impurity spikes. Recycled-grade innovation leans on membrane separation and nanofiltration advances that recover 87-90% usable cryolite from cell waste, trimming disposal fees while shrinking carbon footprints. As these technologies mature, recycled tonnage could offset a notable share of new production, moderating input-cost volatility over the next decade.


By Form:
Powder Efficiency Versus Granular InnovationPowder form maintained 57.05% market share in 2025 because its fine particle size dissolves quickly in electrolytic baths, optimizing current efficiency in smelters. The cryolite market size for powder approached USD 179.45 million in 2025, yet granular products are advancing at a 5.26% CAGR as operators install automated feeders that favor low-dust, free-flowing agglomerates. Granular offerings also reduce inhalation risk, aiding compliance with tightening occupational-safety rules in Europe and North America.
Process engineers now tailor particle-size distributions for specific amperage windows, balancing dissolution kinetics against bath stability. Granular media lower housekeeping costs by minimizing filter-bag changeouts and floor clean-ups, particularly in large smelters running continuous dosing systems. Equipment OEMs in Norway and Canada promote closed-loop pneumatic conveyors compatible with granules, boosting uptake among greenfield projects. Powder grades still dominate in emerging economies where capital budgets limit equipment upgrades, though long-term conversions are likely as lifecycle cost analyses favor dust-free handling.
By Application:
Aluminum Smelting Hegemony Faces DiversificationAluminum smelting held 77.25% share of the cryolite market size in 2025 and continues to anchor volume demand through 2031. The total volumes tied to smelting climbed in parallel with new cell start-ups in Indonesia, India, and the Middle East, maintaining strong offtake agreements with synthetic-grade suppliers. Nevertheless, non-smelting uses are expanding at a 5.41% CAGR, led by sodium-ion battery cathode additives, welding-flux blends, and high-performance abrasive wheels.
Battery-materials researchers in China report enhanced cycling stability when Na₃AlF₆ is doped into layered oxide cathodes, signaling a niche yet strategic growth pathway. Abrasive makers incorporate cryolite to modulate bond hardness, improving wheel life for machining exotic alloys used in aerospace engines. Welding flux formulators market low-hydrogen electrodes to offshore-wind fabricators and LNG-ship builders, highlighting the 25% hydrogen reduction benchmark achieved with cryolite additions. Collectively, these diversified outlets hedge the market against long-term erosion in smelting demand brought by inert-anode adoption.
Geography Analysis
APAC Cryolite Market
Asia-Pacific led the cryolite market with a 43.12% revenue share in 2025, driven by China’s mammoth smelting base and reinforced by Indian capacity additions. Regional demand expanded further after India’s Navin Fluorine committed INR 14 billion to upstream hydrogen-fluoride plants that de-risk raw-material supply. Japan and South Korea consumed steady tonnage for precision abrasives and electronic-grade glass, while ASEAN investments in aluminum rolling and casting supported incremental gains. The region’s forecast 5.18% CAGR remains the highest globally, underpinned by government stimulus for electric-vehicle supply chains and renewable-energy grids.
North America Cryolite Market
North America represents a mature but innovation-centric arena. The United States imported 3,850 t of cryolite in Q4 2024, most of it routed from Mexican fluorspar mines that delivered 74% of acid-grade imports. Strategic alliances such as the Chemours-Energy Fuels partnership aim to rebuild domestic fluorine value chains and reduce geopolitical exposure. Canada’s hydro-powered smelters advance decarbonization initiatives, most notably Rio Tinto’s ELYSIS pilot at the Arvida complex scheduled for first commercial output in 2027. These projects could shift demand profiles toward higher-purity and possibly lower-volume electrolyte systems over the long term.
Europe Cryolite Market
Europe focuses on regulatory compliance and resource efficiency. Solvay’s EUR 4.686 billion sales in 2024 underscore the region’s entrenched yet competitive chemical sector. EU REACH mandates incentivize the adoption of closed-loop recovery schemes, setting the stage for MIT-inspired nanofiltration plants that strip aluminum from spent electrolytes at 99.1% efficiency. Germany, France, and the Scandinavian countries demand high-purity cryolite for aerospace programs and packaging-grade aluminum. Long-term consumption growth is modest, yet value per ton climbs as specialty applications climb the product mix and carbon-border-adjustment mechanisms penalize imports with higher embedded emissions.

Value Chain Analysis
Cryolite value creation starts upstream with fluorine-bearing feedstocks and alumina and sodium inputs. Because natural-ore mining is largely absent commercially, most supply is synthetic, produced by reacting hydrofluoric acid (or alternative fluorine sources such as by-product fluorosilicic acid from the phosphate and fertilizer chain) with alumina hydrate and sodium sources (soda ash or caustic soda) to make sodium hexafluoroaluminate. Feedstock availability and compliance requirements around fluorine handling shape cost and continuity, and China remains a key manufacturing and consumption center due to its large integrated fluorine and aluminum ecosystems.
Midstream chemical processors run batch or continuous routes, then finish cryolite into powder or granular forms tailored for dosing and safety. Downstream demand is dominated by aluminum smelters, where cryolite acts as the molten-bath electrolyte component in Hall-Heroult cells, while abrasives, welding flux, and glass or enamel frits form smaller but growing demand pockets that require tighter impurity control. Distribution typically combines contract supply to smelters and regional chemical distributors for industrial users; logistics and documentation (hazmat transport and fluoride exposure controls) raise barriers for smaller entrants. Cross-border integration also shows up in regional trade linkages, such as the June 2026 Tajikistan-Azerbaijan arrangement for processed aluminum compounds (including cryolite) exchanged against alumina feedstocks, pointing to more secured, bilateral sourcing rather than spot procurement.
Competitive Landscape
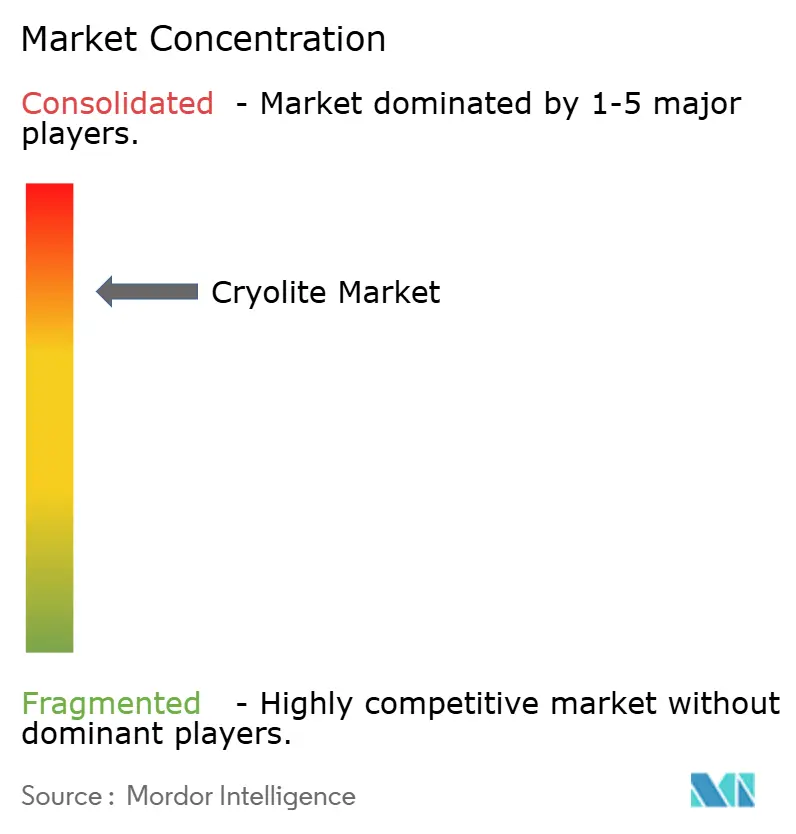
Global supply is concentrated, with diversified chemical conglomerates operating integrated fluorspar-to-cryolite chains. Solvay posted EUR 4.686 billion net sales in 2024 and preserved a 22.5% EBITDA margin despite volume pressure from Asian suppliers. Indian specialist Navin Fluorine International allocated INR 14 billion to expand capacity, targeting an incremental USD 100 million in annual revenue by FY 2027. Chinese producers benefit from captive fluorspar reserves and proximity to smelters, while Western counterparts emphasize safety certifications and low-carbon footprints to maintain price premiums.
Strategic initiatives revolve around recycling, vertical integration, and product diversification. MIT’s nanofiltration process unlocks spent-bath recovery rates exceeding 99%, offering license opportunities that could reduce virgin-material purchases for smelters adopting circular-economy models. Suppliers are also experimenting with fluorine salts for energy-storage and water-electrolysis sectors, hedging against eventual smelting displacement. Patent filings cover particle engineering, impurity control, and automated feeding solutions that cut fugitive dust by 60% in pilot trials.
M&A conversations center on fluorspar mining stakes, as demonstrated by recent Chinese acquisitions in Mongolia and Africa that aim to secure long-term raw-material pipelines. Western firms counter with offtake contracts tied to certified sustainable extraction. Although new entrants occasionally emerge in niche abrasive or welding-flux verticals, stringent fluorine-handling regulations and capital costs create natural barriers, preserving the existing competitive hierarchy.
Cryolite Industry Leaders
Solvay
S.B.Chemicals
Dupré Minerals Limited
DO-FLUORIDE NEW ENERGY TECHNOLOGY CO.LTD
Fluorsid
- *Disclaimer: Major Players sorted in no particular order
Cryolite Market Companies Covered in this Report
- DO-FLUORIDE NEW ENERGY TECHNOLOGY CO.LTD
- Dupré Minerals Limited
- Eclipse Metals Ltd.
- Fluorsid
- Harshil Industries
- HENAN JINHE INDUSTRY CO.,LTD
- JINZHOU SATA FUSED FLUXES AND NEW MATERIALS FACTORY
- Navin Fluorine International Limited
- S.B. Chemicals
- Sanyo Corporation of America
- Skyline Chemical Corporation
- Solvay

Market Opportunities and Future Outlook
Near-term whitespace centers on supplying incremental cryolite volumes and safer handling formats into aluminum capacity restarts and debottlenecking outside the traditional Asia-Pacific core. July 2026 announcements around restarting idled Western smelter capacity, including plans tied to a New Madrid smelter restart in Missouri and a partial restart of the Slovalco joint-venture smelter in Slovakia (each discussed as 75,000 t of capacity), create tangible procurement events for electrolyte materials and bath-chemistry support. This is especially relevant where operations prefer lower-dust granular products and tighter impurity specifications.
A second opportunity area is circular and lower-waste supply, anchored by recycling and recovery approaches that reduce dependence on virgin fluorine inputs and fit tighter waste-management expectations at smelters. MIT-reported nanofiltration performance, including a 99.1% aluminum rejection rate in waste-cryolite recovery work, supports a pathway for licensed recovery systems and producer-smelter partnerships that bundle product supply with take-back or regeneration services. Outside smelting, formulation-led growth avenues also remain visible in sodium-ion battery cathode additive research and in performance fillers for abrasives and welding fluxes, where buyers prioritize consistent chemistry and trace-metal control over commodity pricing.
Recent Industry Developments in Cryolite Market
- May 2026: Fluorsid announced a restructuring plan in response to international instability and competitive pressures, including the decision to halt part of its production plants targeting aluminum fluoride and sulfuric acid. Changes to upstream fluorochemical output can tighten availability of related fluorine intermediates and shift sourcing patterns for downstream fluoride salts used across aluminum-metallurgy supply chains.
- June 2025: Fluorsid published its 2024 Sustainability Report and highlighted the EU co-funded LIFE SYNFLUOR project. The disclosure reinforced the role of regulated, audited fluorine operations in Europe and the emphasis on sustainability-linked process improvements for fluorochemical producers serving aluminum and industrial markets.
- November 2024: Research supported by the Scientific and Technological Development Program of Jilin Province and the National Natural Science Foundation of China reported progress on cryolite and related metal fluorides for battery technologies and water electrolysis. The work broadened the application narrative beyond aluminum smelting and supported product-development efforts around higher-purity or functionally tailored grades.


Cryolite Market Report Scope and Research Methodology
Market Definition and Coverage
For this study, the cryolite market is defined as the value of cryolite materials sold for industrial use, mainly as a flux and additive across aluminum smelting and related processing. We size demand and supply signals across major producing and consuming regions and convert them into market value in USD.
Scope exclusions: This sizing does not treat upstream fluorspar or HF as cryolite revenue, and it also excludes downstream aluminum metal value that is not sold as cryolite.
Segments Covered in This Report
- By Grade
- Natural
- Synthetic
- Recycled (from spent pot-lining)
- By Form
- Powder
- Granular
- By Application
- Aluminium Smelting
- Abrasive Production
- Metal Surface Treatment
- Enamel and Glass Frits
- Welding Flux
- Other Applications (Sodium Ion Battery Additive, etc.)
- By Geography
- Asia-Pacific
- China
- Japan
- India
- South Korea
- ASEAN Countries
- Rest of Asia-Pacific
- North America
- United States
- Canada
- Mexico
- Europe
- Germany
- United Kingdom
- France
- Italy
- Spain
- Russia
- NORDIC Countries
- Rest of Europe
- South America
- Brazil
- Argentina
- Rest of South America
- Middle East and Africa
- Saudi Arabia
- South Africa
- Rest of Middle East and Africa
- Asia-Pacific
Data Sources, Market Sizing, and Validation
Desk Research
Desk work starts with public materials that anchor the industry context and the demand pool, such as USGS minerals information, UN Comtrade trade statistics, International Aluminium Institute publications, and national geological survey releases in key producing countries. We also review customs and tariff schedules used for fluoride salts where relevant, and scan peer reviewed papers that explain typical cryolite use rates and process chemistry in aluminum smelting.
To keep the model grounded, we also use company filings, investor presentations, annual reports, and credible press coverage to map capacity changes, plant restarts, and regional supply tightness. In a few places, paid subscriptions are used for company financials and intelligence, patent look ups, and shipment level import export checks when public tables are not detailed enough. The sources listed here are illustrative only, and many other public and paid references were used to collect, cross check, and clarify data.
Primary Interviews and Surveys
Primary inputs are built through expert interviews and structured surveys with producers, distributors, and large industrial buyers, followed by discussions with process and procurement roles who track consumption patterns. For a global market like cryolite, we purposely balance feedback across APAC, EMEA, and the Americas so assumptions on grade mix, recycled versus synthetic preference, and price movement are checked against real buying behavior.
Distribution of primary research fieldwork respondents
| Company type | Respondent position | Region |
|---|---|---|
| Top tier: 37% | CXOs: 18% | APAC: 40% |
| Mid tier: 42% | Functional/Unit leaders: 35% | EMEA: 33% |
| Smaller Players: 21% | Managers: 47% | Americas: 27% |
Market-Sizing & Forecasting
Our market model uses top-down and bottom-up logic in a practical way. The top-down build starts from aluminum smelting activity and related industrial usage, which is reconstructed using regional production signals, trade flows of fluoride materials, and typical cryolite dosage factors shared by practitioners, and then translated into value using observed price ranges and grade mix. After that, the total is corroborated with selective bottom-up approximations, such as supplier and distributor direction checks, sampled volume by application, and a simple ASP x volume sense check so the number does not drift away from what the channel can supply.
A few inputs carry most of the sizing weight, including primary aluminum output trends, operating rate changes at smelters, synthetic versus recycled share shifts, import reliance in deficit regions, and the spread between industrial grade pricing and higher purity material used in specialty applications. For forecasting, scenario analysis is used because the market is sensitive to smelter restarts, energy availability, and policy driven capacity changes that do not move in a smooth line. When a bottom-up data point is missing for a small country or a niche application, the gap is handled using regional proxy consumption factors and trade based scaling, and then it is rechecked in interviews before final lock.
Data Validation & Update Cycle
Validation is done through repeated cross checks between the model output and independent signals, such as aluminum production direction, net import export movement, and announced capacity changes for cryolite and related fluoride materials. If a region shows an unusual jump, the drivers are reviewed again, price and mix assumptions are re-tested, and primary contacts are re-approached to confirm what changed on the ground.
Before sign-off, the work goes through multi step internal reviews so calculation logic, unit conversions, and year alignment are verified. Reports are refreshed annually, and interim updates are triggered when material events happen, such as large plant outages, significant restarts, or major policy moves that shift aluminum smelting activity. Right before delivery, an analyst runs a fresh scan of key indicators so clients receive the latest updated view.
Mordor Intelligence's Cryolite Market Size Compared Against Other Published Estimates
Published cryolite market sizes often do not match because each publisher makes different choices on which product forms to count, which year to treat as the starting point, and how prices are averaged across regions. Differences also show up when one estimate leans more on trade value, and another leans more on end use consumption signals.
Some external estimates lean toward a broader bucket of fluoride chemicals or mix cryolite with adjacent inputs used around aluminum processing. For Mordor Intelligence, market value is counted only for cryolite grades sold into defined industrial applications, and totals are cross-checked against aluminum output trends and net trade movement before currency conversion is finalized.
Benchmark comparison
| Source | Market Size | Gaps in Research Methodology |
|---|---|---|
| Mordor Intelligence | USD 327.6 M (2026) | |
| Industry Publisher A | USD 303.4 M (2024) | Uses an earlier base year and is presented alongside a pricing oriented view, which can shift the effective ASP assumption and pull the value lower when regional price dispersion is averaged differently. |
| Industry Publisher B | USD 258.8 M (2024) | Leans toward a conservative demand base and a longer forecast arc, and limited visibility on how grade mix and recycled material are treated can keep the near term market value smaller than application anchored builds. |
Looking across the three figures, the spread mainly comes from year selection and how tightly the model is tied to the aluminum smelting led demand pool, before pricing and grade mix are applied. By keeping assumptions traceable to a few observable signals and then rechecking them with interviews, we end up with a balanced number that can be repeated and updated without changing the logic each time.


Key Questions Answered in the Report
What is the current Cryolite Market size?
The cryolite market size stood at USD 327.6 million in 2026 and is forecast to reach USD 401.08 million by 2031, reflecting a 4.13% CAGR.
Which region leads the cryolite market?
Asia-Pacific holds the largest share at 43.12% thanks to China’s expansive aluminum-smelting base.
Why is synthetic cryolite dominant?
Natural deposits are depleted, so 77.68% of 2025 demand was met by synthetic grades produced from fluorspar and aluminum compounds.
How could inert-anode technology affect cryolite demand?
Commercial rollout of fluoride-free inert anodes would reduce electrolyte requirements, potentially curbing long-term demand growth.
Page last updated on:


 Your data is secure and never sold or shared.


