
Cryogenic Equipment Market Size and Share
Market Overview
| Study Period | 2021 - 2031 |
|---|---|
| Market Size (2026) | USD 27.59 Billion |
| Market Size (2031) | USD 37.64 Billion |
| Growth Rate (2026 - 2031) | 6.41 % |
| Fastest Growing Market | Asia Pacific |
| Largest Market | Asia Pacific |
| Market Concentration | Medium |
Major Players *Disclaimer: Major Players sorted in no particular order Image © Mordor Intelligence. Reuse requires attribution under CC BY 4.0. | |
Cryogenic Equipment Market Analysis by Mordor Intelligence
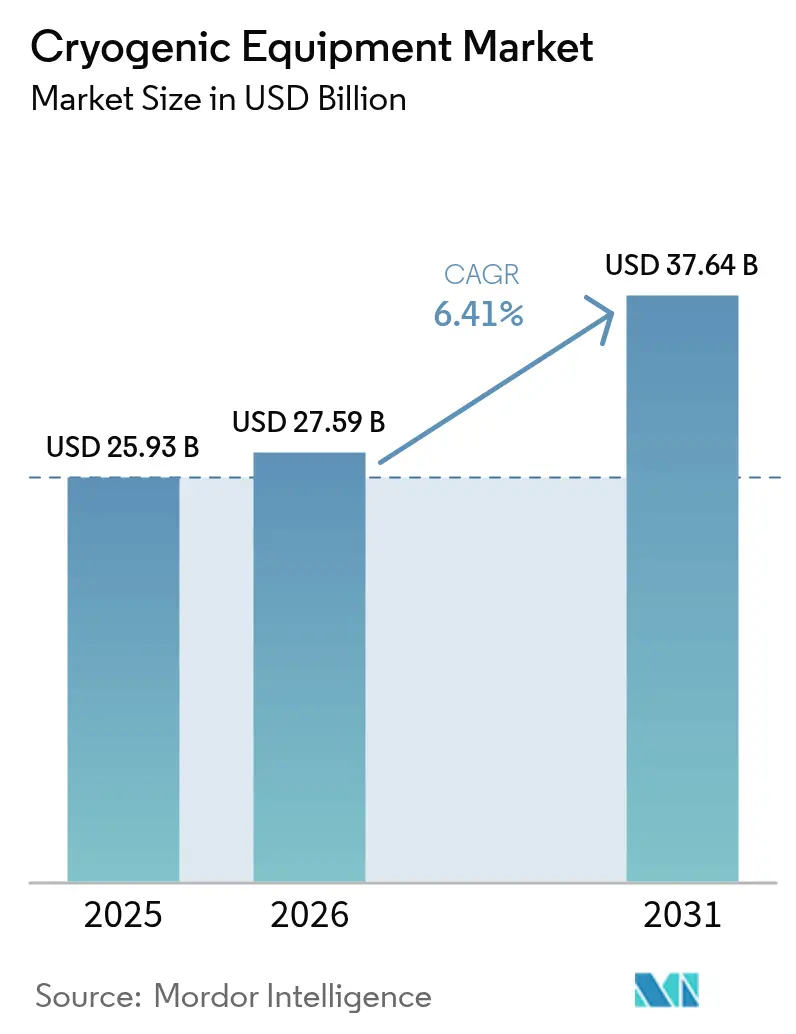
The Cryogenic Equipment market size is expected to grow from USD 25.93 billion in 2025 to USD 27.59 billion in 2026 and is forecast to reach USD 37.64 billion by 2031 at 6.41% CAGR over 2026-2031.
The current momentum reflects the impact of LNG infrastructure expansion, semiconductor-grade gas demand, quantum-computing breakthroughs, and accelerating investments in green-hydrogen liquefaction. Project pipelines in North America and Asia-Pacific anchor near-term growth, while long-haul applications in space exploration and hydrogen mobility broaden the medium-term outlook. Supply-side realignment continues as new helium, argon, and hydrogen capacities mitigate recent shortages. Strategic mergers, notably the pending Chart Industries–Flowserve transaction, strengthen vertical integration and aftermarket capabilities, reinforcing the competitive landscape. Safety-related regulation and high capital intensity still hinder first-time entrants, yet established manufacturers benefit from rising compliance barriers and long maintenance cycles that underpin service revenues.
Key Report Takeaways
- By gas, LNG led with 31.20% of the global cryogenic equipment market share in 2025. Liquid hydrogen is projected to expand at a 9.95% CAGR to 2031.
- By equipment, tanks commanded a 33.25% share of the global cryogenic equipment market in 2025. Pumps are forecast to advance at an 8.18% CAGR between 2026-2031.
- By application, storage accounted for 44.60% of the global cryogenic equipment market size in 2025. Transportation and distribution exhibit the fastest growth at a 7.69% CAGR to 2031.
- By end-user, oil & gas contributed 27.55% revenue in 2025, while electronics and semiconductors registered a 9.26% CAGR through 2031.
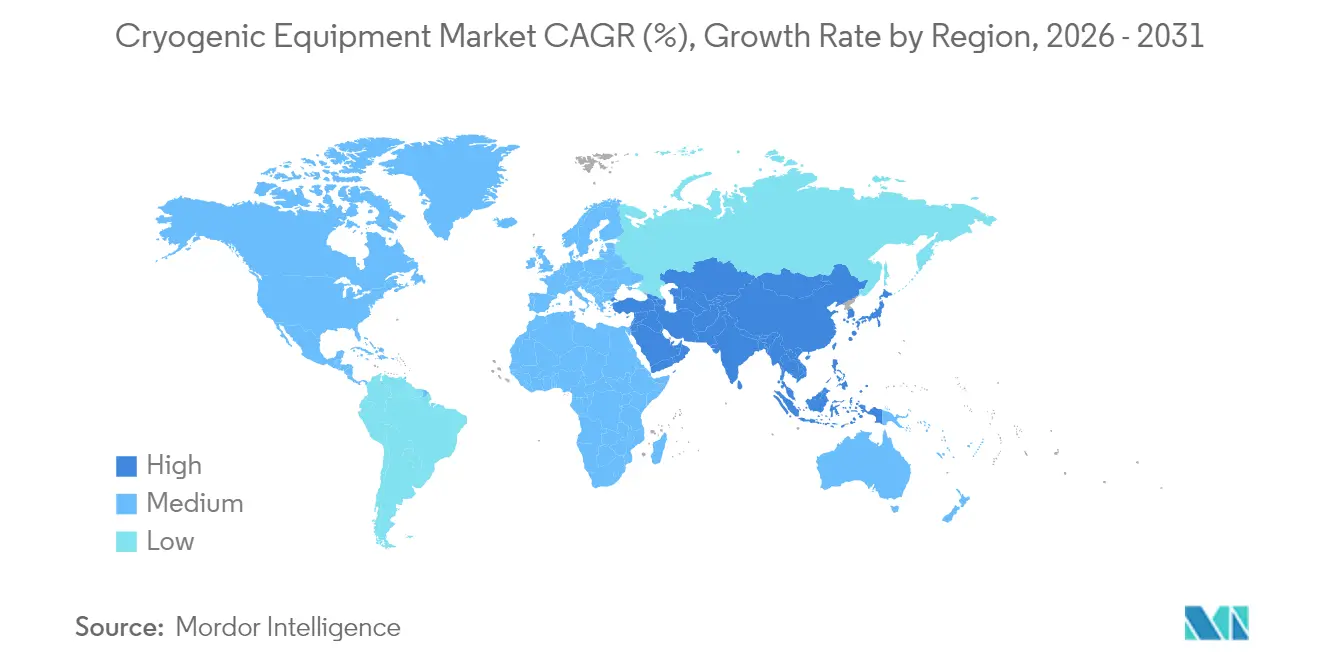
- Asia-Pacific held 42.30% of the global cryogenic equipment market share in 2025, and the region is expanding at a 7.38% CAGR to 2031.
Note: Market size and forecast figures in this report are generated using Mordor Intelligence’s proprietary estimation framework, updated with the latest available data and insights as of 2026.
Market Trends and Insights
Drivers Impact Analysis of Cryogenic Equipment Market*
| Driver | (~) % Impact on CAGR Forecast | Geographic Relevance | Impact Timeline |
|---|---|---|---|
| Surging LNG trade & small-scale LNG infrastructure | +1.80% | Global; strongest in APAC & North America | Medium term (2-4 years) |
| Expansion of semiconductor fabs requiring ultra-pure cryogens | +1.50% | North America, APAC | Short term (≤ 2 years) |
| Growth of space-launch demand for cryogenic propellants | +0.90% | North America, Europe, emerging APAC | Long term (≥ 4 years) |
| Emergence of quantum-computing & superconducting use-cases | +0.70% | North America, Europe, selective APAC hubs | Long term (≥ 4 years) |
| Growth in medical cryotherapy & biologics cold-chain logistics | +0.60% | Global; developed markets | Medium term (2-4 years) |
| Investments in green-hydrogen liquefaction plants | +1.20% | Europe, North America, expanding MEA | Medium term (2-4 years) |
| Source: Mordor Intelligence | |||
Surging LNG trade & small-scale LNG infrastructure
New liquefaction trains entering service across the United States, Qatar, and East Africa elevate demand for tanks, heat exchangers, and boil-off reliquefaction systems. Venture Global’s Plaquemines plant shipped its first cargo in 2024, demonstrating mid-scale technology that compresses build schedules. Qatar’s North Field expansion to 142 million tpa by 2030 positions the country for 25% of global LNG trade. Modular systems, typified by Linde’s OPTI-LNG™ plants, support niche off-grid consumption in Latin America and sub-Saharan Africa.(1)Linde AG, “OPTI-LNG™ Technology Brief,” linde.com Record orders for Turbo-Brayton units illustrate shipping-sector investments in methane capture that cut voyage losses. Utilization below 50% at some European regasification terminals cautions against blanket capacity additions and may spur retrofit rather than greenfield spending.
Expansion of semiconductor fabs requiring ultra-pure cryogens
The CHIPS Act’s USD 30 billion incentives stimulate multiple U.S. mega-fabs, quadrupling domestic helium needs within a decade. Air Liquide is building a USD 250 million ultra-pure nitrogen complex in Idaho to serve Micron’s 1-beta DRAM line, integrating renewable electricity to lower Scope 2 emissions. Chinese import pivots, now sourcing nearly 90% of helium from Qatar, reshape maritime logistics for ISO tanks and liquid liners. At node sizes below 5 nm, permissible impurity levels decline to parts-per-trillion, lifting demand for high-spec cryogenic purification skids. Localized gas ecosystems could see 60% of semiconductor material inputs produced within U.S. borders by 2030, accelerating procurement of Global Cryogenic Equipment market offerings.
Growth of space-launch demand for cryogenic propellants
Commercial constellations and Artemis lunar logistics multiply liquid hydrogen, oxygen, and methane storage requirements. NASA experiments show zero-boil-off tanks can save 42% propellant annually using active mixing and cryocoolers. ESA validations of vapor-shield cooling give European suppliers an entry path for interplanetary missions. Graham Corporation’s new Florida test site will characterize pumps and valves to 20 K, strengthening domestic qualification infrastructure. Permanent-magnet levitated transfer lines slash conductive heat ingress, prolonging stage-time windows critical for reusable launch vehicles. Terrestrial spin-offs include hydrogen storage for hybrid-electric aviation, broadening the addressable Global Cryogenic Equipment market.
Investments in green-hydrogen liquefaction plants
Air Liquide’s Nevada site delivers 30 t/d and supports more than 40,000 fuel-cell vehicles across California.(2)Air Liquide, “Turbo-Brayton Order Intake Sets New Record,” airliquide.com Plug Power’s Louisiana plant, launched in April 2025, lifts its North American output to 40 t/d and validates electrolytic hydrogen economics at sub-USD 3/kg. Chart Industries supplies liquefiers to Element Resources’ Lancaster hub targeting 20,000 t/y, underscoring OEM opportunity diversity. Europe plans 10 million t/y domestic hydrogen by 2030, implying at least 310 GW of electrolyzer build and widespread demand for 1-3 t/d satellite liquefiers. Emerging hybrid LNG-hydrogen jetties require dual-service tanks and valves, widening the Global Cryogenic Equipment market potential for retrofittable designs.
Restraints Impact Analysis of Cryogenic Equipment Market*
| Restraint | (~) % Impact on CAGR Forecast | Geographic Relevance | Impact Timeline |
|---|---|---|---|
| High capital cost & complex installation | -1.20% | Global; pronounced in emerging markets | Short term (≤ 2 years) |
| Helium supply shortages & price volatility | -0.80% | Global; APAC & North America | Medium term (2-4 years) |
| Safety risks causing regulatory delays | -0.60% | Global; stricter in developed markets | Medium term (2-4 years) |
| Scarcity of cryogenics-skilled workforce | -0.40% | Global; acute in emerging economies | Long term (≥ 4 years) |
| Source: Mordor Intelligence | |||
High capital cost & complex installation
Large-scale LNG or air-separation units entail USD 5 billion-plus annual capex for market leaders, deterring smaller entrants. Heat-exchanger manufacture alone can form 30% of plant budgets, yet each 1% efficiency boost saves 5% compressor energy. ADNOC’s Ruwais project illustrates the financing barrier, with a USD 5.5 billion EPC value before commissioning. Compliance with NFPA 59A and ASME codes extends schedules by months and demands specialist inspection. European gas-association guidelines further increase design complexity and curricula for operators. Consequently, retrofit optimization often supersedes greenfield builds, moderating immediate Global Cryogenic Equipment market orders.
Helium supply shortages & price volatility
Prices peaked at USD 14/m³ in 2023 following the U.S. reserve phase-out, pressuring MRI suites and semiconductor fabs. Qatar became the largest supplier, covering 90% of China’s imports. Russia’s Amur Gas Processing Plant adds new volumes, but geopolitical risk persists. Closed-loop recovery kiosks and small-scale purification skids help fabs curb consumption up to 30%. Exploration in North America and Tanzania signals future diversification, yet pipelines to market remain expensive. Volatility, therefore, injects procurement uncertainty into the Global Cryogenic Equipment market, contracting cycles.
*Our forecasts treat driver/restraint impacts as directional, not additive. The impact forecasts reflect baseline growth, mix effects, and variable interactions.
Cryogenic Equipment Market Segment Analysis
By Gas:
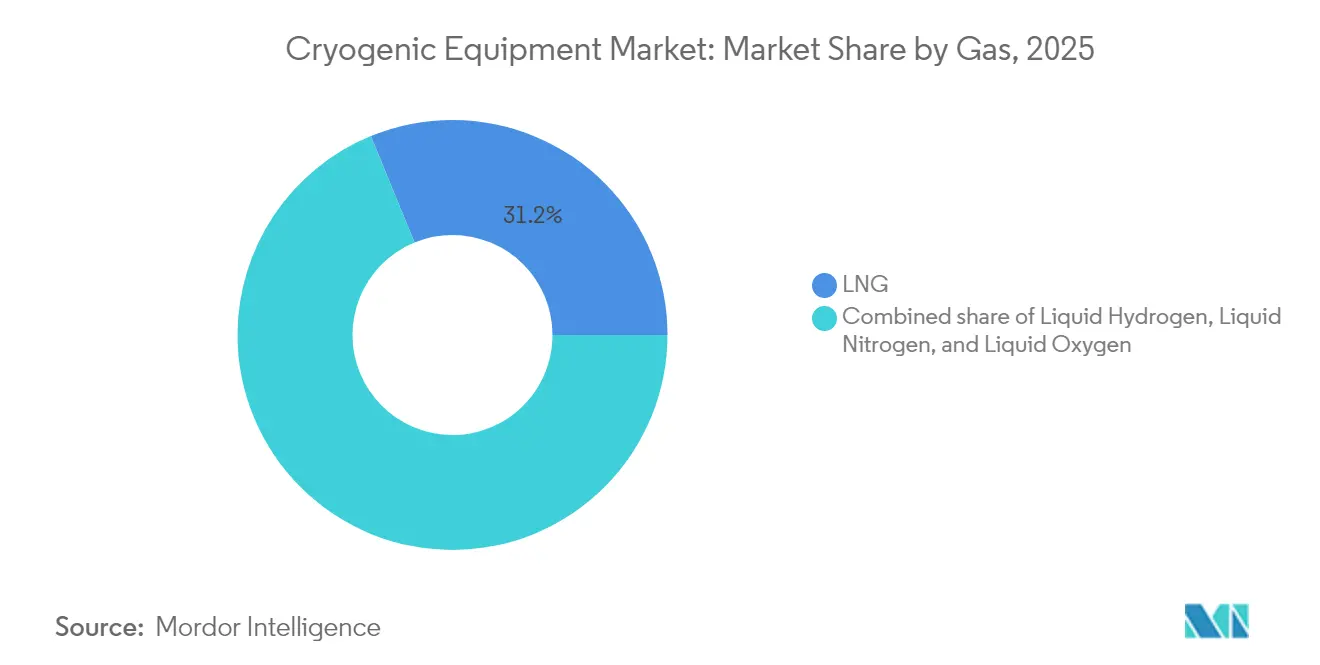
LNG dominance challenged by hydrogen accelerationLNG represented 31.20 of % Global Cryogenic Equipment market share in 2025, anchored by 2.6 bcf/d capacity at Plaquemines and Qatar’s expansion trajectory. Liquid hydrogen, however, grows at a 9.95% CAGR underpinned by Plug Power’s Louisiana line and Air Liquide’s Nevada unit. Global Cryogenic Equipment market size for hydrogen liquefiers could exceed USD 3.18 billion by 2031 if Europe hits the 10 million t annual target. Helium and argon remain niche but strategic: semiconductor-grade argon rides lithography growth, while helium shortages intensify focus on recycling skids. Diversified order books now include methane tanks for reusable launch vehicles and nitrogen freezers for plant-based protein processors, underscoring widening end-use diversity.
The segment’s competitive focus shifts toward modular, high-flexibility plants capable of switching between gas species. Chart Industries’ plug-and-play hydrogen modules exemplify this convergence, allowing LNG-trained fabricators to pivot into hydrogen with minimal retooling. North America and APAC dominate the market, yet Europe’s green-deal funding anchors demand for mid-scale green-hydrogen liquefiers. Suppliers demonstrating contamination control to single-digit ppt levels gain pricing premiums in microelectronics contracts.


By Equipment:
Tank stability meets pump innovationTanks held 33.25% share of Global Cryogenic Equipment market size in 2025, supported by demand for full-containment LNG storage nearing 250 m³ and high-pressure composite cylinders in aviation prototypes. Pump revenues expand fastest at 8.18% CAGR, boosted by Dover’s Cryogenic Machinery Corp acquisition that brings low-NPSH centrifugal designs into its portfolio.
Heat-exchanger upgrades dominate refinery retrofits, where 1% thermodynamic gains translate to 5% compressor energy savings. Valve makers leverage digital twins for predictive-maintenance offerings, capturing sticky aftermarket revenue even as unit sales plateau. Instrumentation demand rises in tandem with safety automation, with SIL-3 certified sensors becoming baseline in tenders. Emerging magnetic-levitation transfer lines, eliminating friction losses, position ancillary component specialists for long-cycle orders in space-grade pipelines.
By Application:
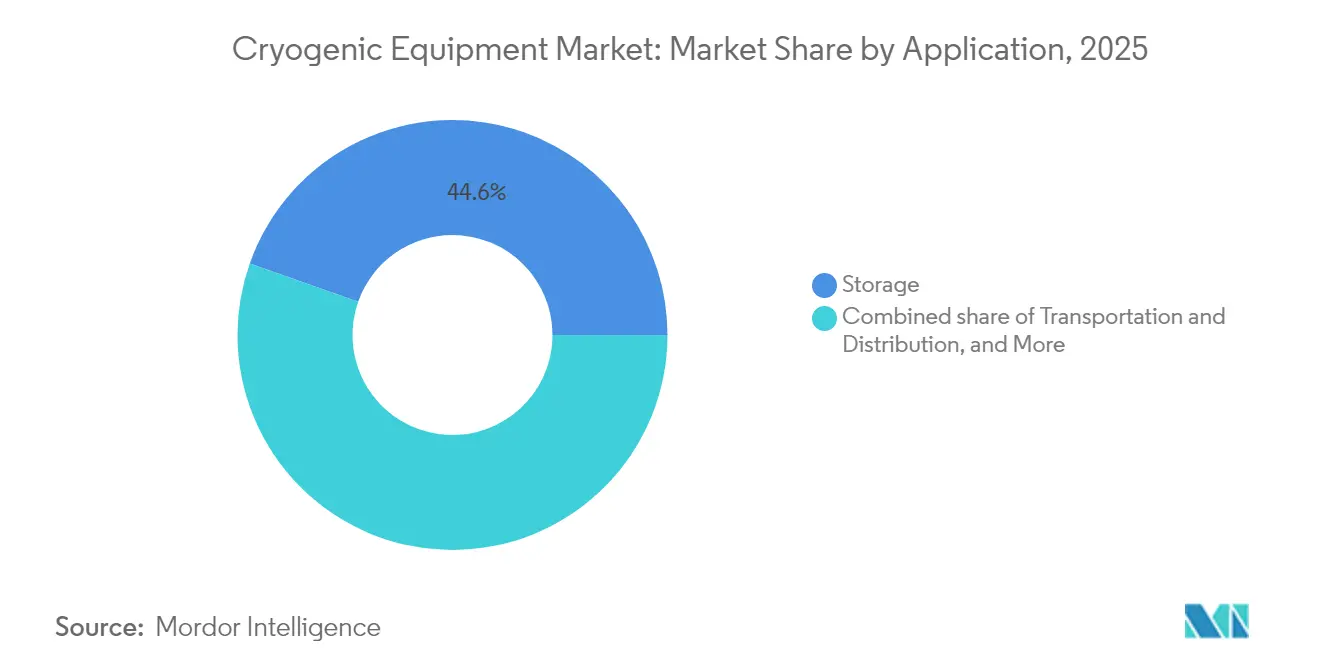
Storage leadership faces transport disruptionStorage contributed 44.60% of Global Cryogenic Equipment market size in 2025, reflecting the universality of bulk tanks across LNG, oxygen and nitrogen supply chains. Transportation equipment accelerates at 7.69% CAGR as hydrogen mobility and ISO LNG container trade expand. The U.S. west-coast trucking corridor expects over 40,000 fuel-cell vehicles by 2030, requiring polyurethane-insulated trailers rated below 20 K.
Processing and liquefaction equipment grows alongside green-hydrogen electrolyzer roll-outs, while regasification demand lags in Europe amid sub-50% terminal utilization. R&D applications, though niche in volume, generate premium margins; dilution refrigerators for quantum chips can price above USD 1 million per set. Maritime boil-off reliquefiers, led by Turbo-Brayton orders, demonstrate how specific application pain points foster rapid equipment adoption.
By End-User Industry:
Oil & gas maturity contrasts electronics surgeOil & gas still delivered 27.55% revenue in 2025, yet forward growth tilts toward the electronics cluster expanding at 9.26% CAGR. Micron, Samsung and SK Hynix ramps necessitate on-site air-separation and point-of-use purification, locking in multiyear gas-supply and equipment contracts. Energy-transition verticals adopt hydrogen and LNG for power generation and heavy transport, bringing new peak-shaving and satellite regasification projects. Food-processing uses liquid nitrogen flash-freezing to protect plant-protein textures, while healthcare upgrades cryobanks to support autologous cell therapies under stringent FDA rules. Aerospace demand multiplies with space-tourism flights, where ground support requires rapid-chill fill-stands and zero-boil-off pads.
Geography Analysis
APAC Cryogenic Equipment Market
Asia-Pacific maintained 42.30% Global Cryogenic Equipment market share in 2025, owing to China’s 29 operating LNG terminals and 39 builds underway. Regional CAGR of 7.38% remains intact as India lifts regas capacity and South Korea deepens U.S. chip-supply alliances. By volume, China’s capacity utilization could slip to 43% by 2030, yet tank revamps and safety retrofits sustain aftermarket demand.
North America Cryogenic Equipment Market
North America benefits from CHIPS-Act fabs and LNG exports. By 2028, the United States projects 21.2 bcf/d liquefaction capacity, underpinning large storage-tank and cold-box orders. Simultaneously, Louisiana’s hydrogen corridor positions local OEMs to supply twin-service valves viable for both methane and hydrogen. Canada’s emerging helium projects amplify cryogenic separation skid procurement.
EMEA and South America Cryogenic Equipment Market
Europe wrestles with declining gas demand—20% year-on-year drop in H1 2024—yet continues to commission terminals, raising under-utilization risk. The continent’s hydrogen strategy, targeting 10 million t/y output, channels capex toward electrolyzer-coupled liquefiers. Regulations such as the EU Pressure Equipment Directive elevate compliance costs but protect incumbents. The Middle East & Africa leverages low-carbon LNG at ADNOC’s Ruwais and QatarEnergy projects, while South America adds floating regasification units in Brazil. Each geography channels distinctive stimuli and constraints into the Global Cryogenic Equipment market growth arc.

Regulatory Landscape
Cryogenic equipment suppliers operate across overlapping pressure, transport, and process-safety regimes that increase design and documentation requirements for tanks, cold boxes, valves, and transfer systems. In the United States, industrial users typically align equipment and operating practices with OSHA process safety and hazardous-material handling expectations, while LNG facilities rely on established codes such as NFPA 59A and ASME-based pressure vessel rules, which extend project schedules due to inspection and qualification needs.
In Europe, product access is shaped by the Pressure Equipment Directive (PED 2014/68/EU) and its harmonized standards approach, reinforced by the European Commission via Implementing Decision (EU) 2025/165, which references standards used to demonstrate conformity for pressure equipment across industrial gases and LNG. Environmental rules also affect adjacent cryogenic systems in cold-chain and refrigeration: Regulation (EU) 2024/3120 provides an exemption pathway for certain very low-temperature applications (for example, mechanical cryogenic freezers around -150 degrees C) through December 31, 2028, while conformity-verification requirements for pre-charged refrigeration equipment were tightened under Implementing Regulation (EU) 2025/2155 with transitional validation for prior declarations through December 31, 2025. Separately, April 2026 actions under the US Defense Production Act (Section 303) designating LNG transmission, processing, storage, and liquefaction capacity as essential industrial resources increase the policy salience of domestic LNG buildouts and the associated cryogenic equipment supply chain.
Competitive Landscape
The Global Cryogenic Equipment market shows moderate concentration but rising consolidation velocity. The all-stock merger between Chart Industries and Flowserve will create a USD 19 billion value entity capturing roughly 20% of combined pumps, valves, and storage-vessel revenues, with USD 300 million cost synergies targeted by 2027. Dover’s acquisition of Cryogenic Machinery Corp augments its pump segment and secures long-term supply into air-gas majors. Alfa Laval’s EUR 200 million purchase of Fives Energy Cryogenics expands into hydrogen and CO₂ capture lines.
Technology differentiation emerges as a prime lever. Air Liquide’s Turbo-Brayton reliquefiers dominate maritime retrofits, while HeLIUM Cryogenics’ Stirling micro-coolers win quantum-lab tenders. Nikkiso’s plan to double German manufacturing capacity shows OEMs expanding regional footprints to navigate trade frictions and cut lead times. Service revenues climb as operators outsource predictive maintenance; Chart’s Nordic service center acquisition echoes this trajectory.
New entrants gravitate to niche segments—quantum, micro-LNG,, and medical cryotherapy—where legacy economies of scale matter less than time-to-market and IP agility. Incumbents respond with venture investments and co-development pacts, seeking to pre-empt disruption.Aa blend of consolidation and specialization characterizes the competitive chessboard of the Global Cryogenic Equipment market.
Cryogenic Equipment Industry Leaders
Linde plc
Emerson Electric Co.
Beijing Tianhai Industry Co Ltd
Cryofab Inc
Chart Industries, Inc.
- *Disclaimer: Major Players sorted in no particular order

Cryogenic Equipment Market Companies Covered in this Report
- Linde plc
- Air Liquide
- Chart Industries Inc.
- Air Products & Chemicals Inc.
- Cryofab Inc.
- Beijing Tianhai Industry Co. Ltd.
- Emerson Electric Co.
- Honeywell International Inc.
- Sumitomo Heavy Industries Ltd.
- McDermott International Ltd.
- Flowserve Corporation
- HEROSE GmbH
- Wessington Cryogenics
- Cryostar SAS
- IHI Corporation
- Kawasaki Heavy Industries Ltd.
- INOXCVA
- Taylor-Wharton
- Fives Group
- Peters Shipyards

Market Opportunities and Future Outlook
Ongoing LNG expansion and retrofit programs keep procurement active across large cryogenic hardware (heat exchangers, cold boxes, reliquefaction units, valves, and tanks), supported by visibility from specific projects and awards. For example, Cheniere Energy Partners signed a lump-sum turnkey EPC contract with Bechtel in May 2026 for the first phase of the Sabine Pass Liquefaction Expansion (including Train 7 and a boil-off gas re-liquefaction unit), and Baker Hughes announced equipment and services awards in July 2026 tied to that expansion, including gas turbines driving centrifugal compressors and related reliquefaction equipment. These developments create room for vendors that can shorten lead times through modularization, and that can deliver integrated cold-box, compressor, and valve packages to reduce interface risk in EPC-driven schedules.
Hydrogen supply-chain buildout is also creating a second, distinct opportunity set, centered on ultra-low temperature (-240 C to -253 C) pumping and gas-handling equipment, where qualification depth and reliability data can be differentiators. In April 2026, Ebara Elliott Energy received a contract from Kawasaki Heavy Industries to supply liquid hydrogen booster pumps and cryogenic hydrogen return gas blowers for the Liquefied Hydrogen Supply Chain Commercialization Demonstration spanning Australia and Japan, highlighting demand for specialized rotating equipment at LH2 temperatures. In parallel, policy frameworks are reinforcing planning and standards alignment around hydrogen and low-carbon gases, including the EU framework established in 2024 for renewable and low-carbon gas and hydrogen markets and the China Energy Law implementation in 2025 that supports hydrogen development, including liquid-hydrogen pilots. Together, these signals point to demand for compliant, high-specification equipment (vacuum-insulated vessels, cryogenic pumps, and low-leakage valves) and for aftermarket services that help operators maintain safety and performance under tightening inspection and documentation expectations.
Recent Industry Developments in Cryogenic Equipment Market
- July 2026: Baker Hughes announced equipment and services awards for Cheniere's Sabine Pass LNG expansion, including seven gas turbines driving centrifugal compressors for Train 7 and boil-off gas re-liquefaction equipment. The scope underscores continued ordering for cryogenic-adjacent turbomachinery, compression, and reliquefaction trains that tie directly to LNG capacity additions and efficiency upgrades.
- October 2025: Chart Industries won a contract from Bechtel Energy to supply air-cooled heat exchangers, brazed aluminum heat exchangers, and cold boxes for Sempra Infrastructure's Port Arthur LNG Phase 2 project in Texas. The award reinforces demand for large-scale cryogenic process equipment packages on US Gulf Coast LNG builds and strengthens incumbents with proven cold-box delivery and integration capabilities.
- July 2024: Chart Industries reported that its IPSMR process technology delivered first LNG at New Fortress Energy's Fast LNG asset offshore Altamira, Mexico. The demonstrated commissioning of a modular LNG solution supports broader adoption of repeatable, faster-deploying liquefaction configurations, supporting pull-through for associated cryogenic equipment such as heat exchangers, valves, and ancillary cold-box components.


Cryogenic Equipment Market Report Scope and Research Methodology
Market Definition and Coverage
For this study, the cryogenic equipment market covers revenue earned from equipment used to store, move, control, and process liquefied gases at very low temperatures across industrial and research settings.
Scope exclusions: We exclude upstream gas production, commodity gas sales, and non-cryogenic conventional gas handling equipment that is not designed for cryogenic temperatures.
Segments Covered in This Report
- By Gas
- Liquid Nitrogen (LIN)
- Liquid Oxygen (LOX)
- Liquid Argon
- Liquid Helium
- Liquid Hydrogen (LH₂)
- LNG (Methane)
- By Equipment
- Tanks (Cryogenic storage tanks, Dewars and cylinders, ISO and road tank containers)
- Pumps
- Heat Exchangers
- Valves and Regulators
- Instrumentation and Controls
- Ancillary Equipment (transfer lines, cold boxes, etc.)
- By Application
- Storage
- Transportation and Distribution
- Processing and Liquefaction
- Regasification
- R&D/Laboratory
- By End-user Industry
- Oil and Gas (upstream, midstream, LNG)
- Energy and Power (grid-scale storage, SMR, H₂)
- Chemicals and Petrochemicals
- Food and Beverage
- Healthcare and Life-Sciences
- Electronics and Semiconductors
- Aerospace and Defense
- Others (Marine, Metallurgy and Metal-processing)
- By Geography
- North America
- United States
- Canada
- Mexico
- Europe
- Germany
- United Kingdom
- France
- Italy
- Spain
- Russia
- Rest of Europe
- Asia Pacific
- China
- India
- Japan
- South Korea
- ASEAN Countries
- Australia
- Rest of Asia Pacific
- South America
- Brazil
- Argentina
- Rest of South America
- Middle East and Africa
- Saudi Arabia
- United Arab Emirates
- South Africa
- Egypt
- Rest of Middle East and Africa
- North America
Data Sources, Market Sizing, and Validation
Desk Research
Desk research was used to set clear boundaries for what counts as cryogenic equipment, and then to build the starting demand map by gas use and end-user investment patterns. Public sources helped anchor the model, including US Energy Information Administration releases on LNG and gas balances, Eurostat industrial production series, UN Comtrade trade statistics for cryogenic tanks and related equipment, and the US Patent and Trademark Office database to observe technology activity.
We also reviewed national hydrogen strategies and energy transition roadmaps, safety and handling guidance where available from bodies such as CGA and ISO, plus company annual reports, investor presentations, and credible press coverage on capacity additions and project timelines. Where needed, we used paid subscriptions for company financial intelligence, shipment-level import-export checks, and patent analytics to verify ranges rather than to replace public evidence. The desk sources listed here are illustrative only, and other references were used for data collection, cross-checking, and clarification.
Primary Interviews and Surveys
Primary work focused on validating what portion of cryogenic spending is actually equipment revenue, and how project timing converts into delivered units. We spoke with equipment manufacturers, distributors, EPC-facing stakeholders, and end users across energy, industrial gases, and healthcare, so assumptions on lead times, replacement cycles, and typical configurations could be tightened for APAC, EMEA, and the Americas.
Distribution of primary research fieldwork respondents
| Company type | Respondent position | Region |
|---|---|---|
| Top tier: 36% | CXOs: 14% | APAC: 37% |
| Mid tier: 48% | Functional/Unit leaders: 36% | EMEA: 37% |
| Smaller Players: 16% | Managers: 50% | Americas: 26% |
Market-Sizing & Forecasting
The core model uses a top-down approach where demand is reconstructed from liquefied gas activity and the related installed base needs, and then translated into equipment spend using bill-of-equipment shares for each application. In practice, indicators such as LNG liquefaction and regasification build-outs, industrial gas production and distribution intensity, hydrogen liquefaction and handling projects, hospital and lab cryogenic storage needs, and import-export movement of cryogenic tanks and valves were used to shape the demand pool.
Those totals were then checked with selective bottom-up approximations, such as sampled average selling prices multiplied by estimated unit volumes for tanks, pumps, vaporizers, valves, and controls in a few high-activity countries, followed by channel feedback on mix shifts. When a supplier did not disclose cryogenic-only revenue, we handled gaps using product mix mapping from catalogs and filings, followed by interview-based allocation ranges. For forecasting, scenario analysis was used because project pipelines and timing can swing year to year, and assumptions were stress-tested against energy transition funding pace, large project FID timing, and replacement-driven demand in mature industrial gas systems.
Data Validation & Update Cycle
Validation was done by cross-checking modeled totals against independent signals, including trade flows of major cryogenic equipment categories, announced commissioning schedules for LNG and hydrogen assets, and directional movement in industrial gas consumption. Where anomalies appeared, such as sudden jumps that did not align with project lead times, we revisited inputs and re-checked them through follow-up calls and secondary re-reads before final sign-off.
Each market build goes through multiple analyst reviews, so unit logic, currency treatment, and year alignment issues are caught early. Reports are refreshed annually, and interim updates are triggered when material events occur, such as large project delays, new policy shifts, or major capacity additions. Before delivery, a final fresh pass is completed so clients receive the most current view available at that time.
Mordor Intelligence's Cryogenic Equipment Market Size Compared Against Other Published Estimates
Published market sizes for cryogenic equipment can look inconsistent because each publisher draws the boundary in a slightly different place and then applies different demand signals. Differences also show up in how prices are treated over time, how projects are timed into revenue, and whether the value includes adjacent services or only equipment sales.
Trade movement for cryogenic tanks and key valve categories, along with the visible pipeline of LNG and hydrogen handling projects, are the checks that keep Mordor Intelligence's estimate tied to delivered equipment demand rather than broad cryogenics spending. Gaps usually come from counting the full cryogenic value chain, using optimistic project timing, applying a single global ASP curve without regional adjustment, or mixing installed-base replacement with new-build capex without clear separation.
Benchmark comparison
| Source | Market Size | Gaps in Research Methodology |
|---|---|---|
| Mordor Intelligence | USD 27.59 B (2026) | |
| Industry Association A | USD 30.40 B (2026) | Includes broader cryogenic infrastructure spend, including installation and commissioning services, and applies a faster conversion of project announcements into the same-year revenue. |
| Trade Journal B | USD 24.10 B (2025) | Uses a prior-year equipment-only snapshot with limited adjustment for price uplift and project ramp timing, which can undercount large LNG and hydrogen equipment deliveries booked after the base year. |
The spread in the table is mainly explained by scope boundary and timing, more than by disagreement on growth drivers. By tying the model to observable equipment movement and project commissioning cadence, the final total stays traceable to clear demand variables and repeatable calculation steps.


Key Questions Answered in the Report
What is the current size of the Global Cryogenic Equipment market?
The Global Cryogenic Equipment market size reached USD 27.59 billion in 2026 and is projected to grow to USD 37.64 billion by 2031.
Which gas segment is growing fastest?
Liquid hydrogen records the fastest expansion, advancing at a 9.95% CAGR through 2031 as large-scale green-hydrogen liquefiers come onstream.
Why are pumps growing quicker than other equipment categories?
Specialized cryogenic pumps benefit from efficiency upgrades and consolidation moves like Dover’s acquisition of Cryogenic Machinery Corp, resulting in an 8.18% CAGR forecast.
Which region dominates demand?
Asia-Pacific leads, holding 42.30% Global Cryogenic Equipment market share in 2025 due to aggressive LNG terminal builds and semiconductor manufacturing investments.
How will safety regulations affect future projects?
Stringent codes such as NFPA 59A and EU pressure-equipment rules extend approval timelines and raise compliance costs, reinforcing the advantage of experienced suppliers.
Page last updated on:


 Your data is secure and never sold or shared.


