
Market Overview
| Study Period | 2020 - 2031 |
|---|---|
| Forecast Data Period | 2026 - 2031 |
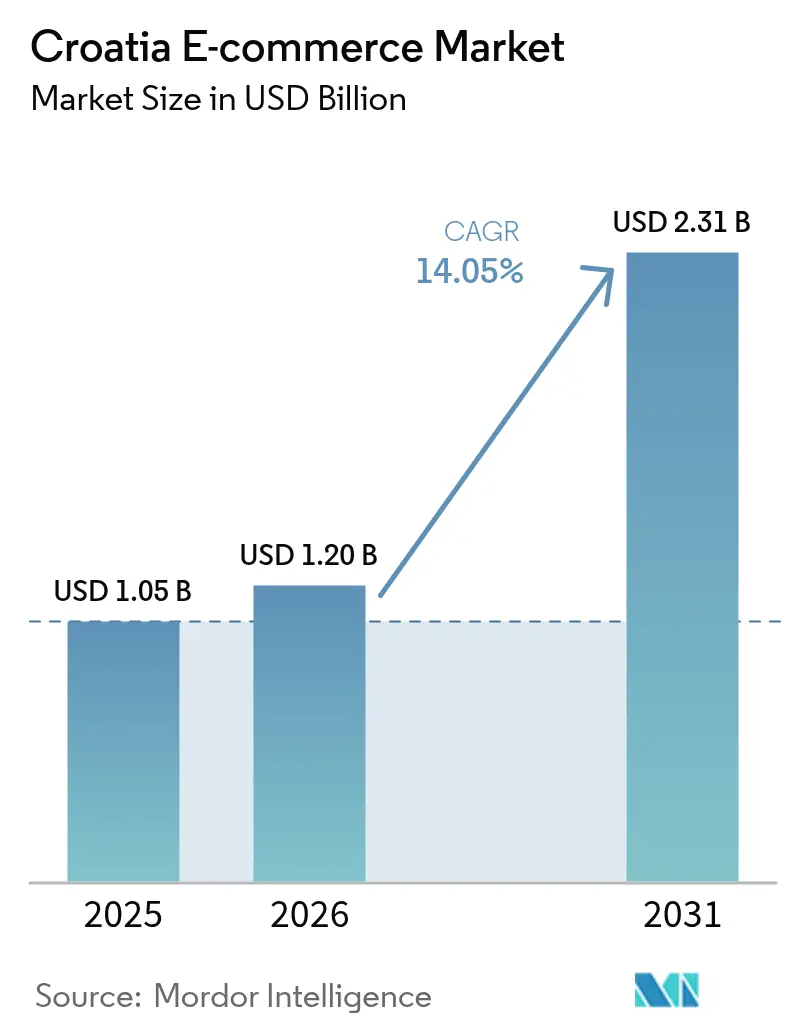
| Base Year Market Size (2025) | USD 1.05 Billion |
| Market Size (2026) | USD 1.2 Billion |
| Market Size (2031) | USD 2.31 Billion |
| Growth Rate (2026 - 2031) | 14.05 % |
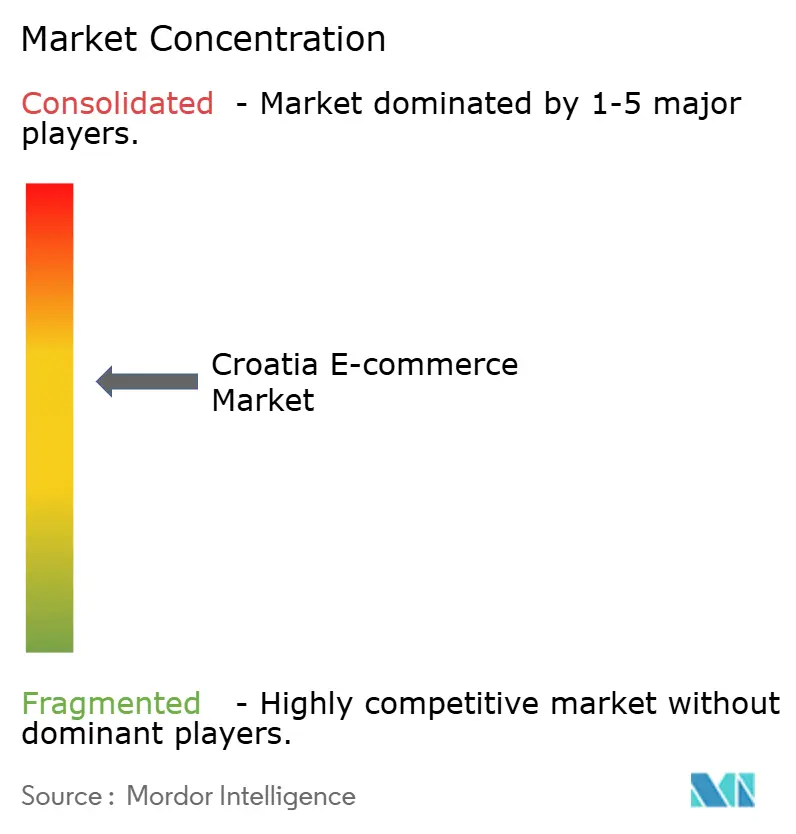
| Market Concentration | Medium |
Major Players *Disclaimer: Major Players sorted in no particular order Image © Mordor Intelligence. Reuse requires attribution under CC BY 4.0. | |
Croatia E-commerce Market Analysis by Mordor Intelligence
The Croatia e-commerce market size is expected to grow from USD 1.05 billion in 2025 to USD 1.2 billion in 2026 and is forecast to reach USD 2.31 billion by 2031 at 14.05% CAGR over 2026-2031. Rising internet access (84% of the population) and an e-shopper base that now equals 62% of all internet users anchor this trajectory.[1]: Ecommerce Europe, “European E-Commerce Report 2024,” Ecommerce Europe, ecommerce-europe.eu. Government stimulus—most notably the EUR 308 million (USD 336 million) in digitalisation loans and grants disbursed under the National Recovery and Resilience Plan—continues to lower entry barriers for local merchants.[2]European Commission, “Croatia's Recovery and Resilience – Supported Projects,” European Commission, commission.europa.eu. Mobile-first shopping behaviour, a wave of SME web-store launches, and mandated B2B e-invoicing from 2026 are reinforcing demand across consumer and corporate channels. Competitive intensity is escalating as domestic champions eKupi and Konzum defend share against global platforms, prompting a logistics arms race centred on faster fulfilment and automated parcel-locker roll-outs. Meanwhile, seasonal tourism inflows stabilise delivery economics along the Adriatic coast, creating a virtuous cycle of higher order density and lower per-parcel costs.
Key Report Takeaways
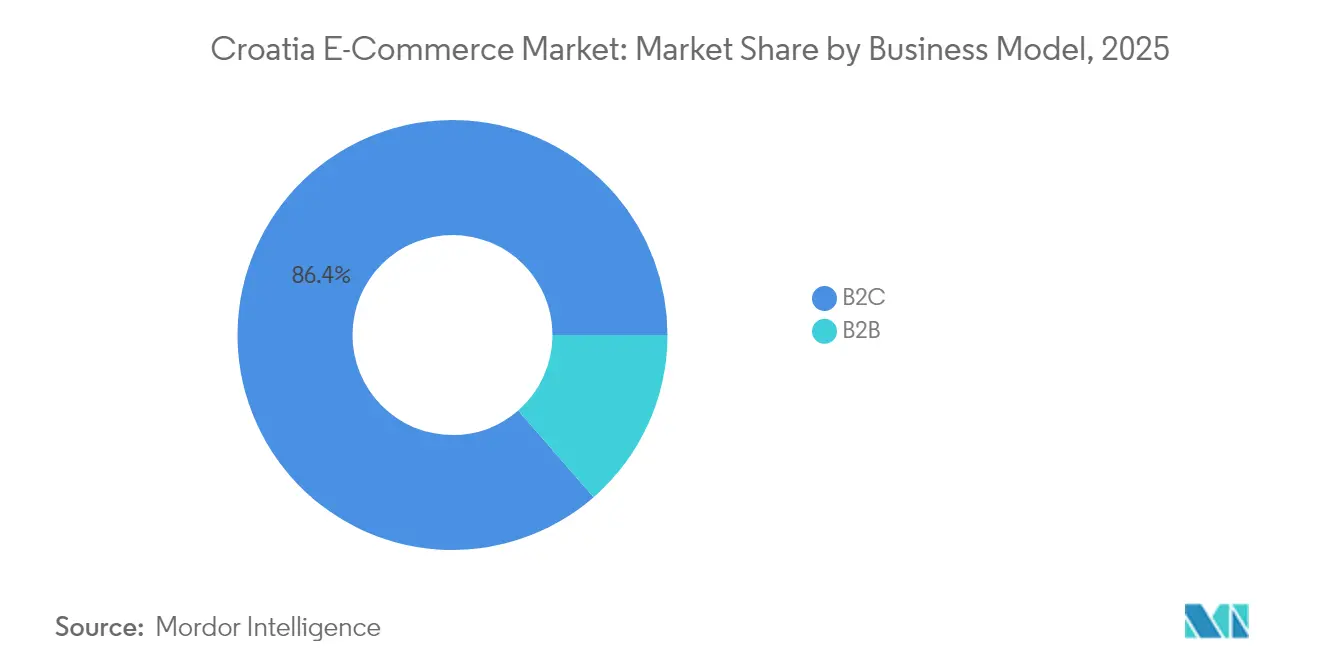
- By business model, the B2C segment held 86.40% of the Croatia e-commerce market share in 2025, while B2B is projected to grow at the fastest 17.48% CAGR through 2031.
- By device type, smartphones commanded 61.45% of the Croatia e-commerce market size in 2025; the “other devices” cluster (smart TVs, voice assistants, wearables) is forecast to expand at a 15.88% CAGR to 2031.
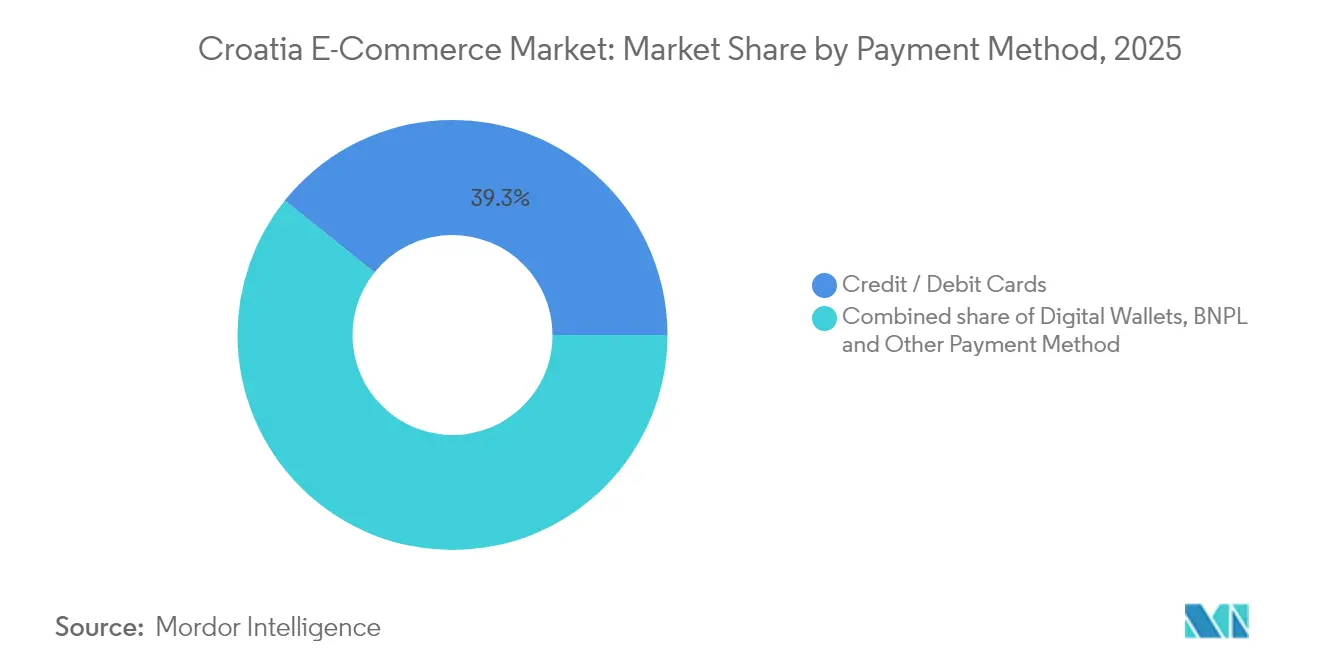
- By payment method, cards led with 39.25% of the Croatia e-commerce market size in 2025, whereas digital wallets are advancing at a 21.63% CAGR through 2031.
- By B2C product category, consumer electronics accounted for 20.60% of the Croatia e-commerce market size in 2025 and food & beverages is accelerating at a 17.31% CAGR to 2031.
Note: Market size and forecast figures in this report are generated using Mordor Intelligence’s proprietary estimation framework, updated with the latest available data and insights as of 2026.
Croatia E-commerce Market Trends and Insights
Drivers Impact Analysis*
| Driver | (~) % Impact on CAGR Forecast | Geographic Relevance | Impact Timeline |
|---|---|---|---|
| Government-subsidised SME digital-voucher programme accelerating webshop adoption | 5.7% | National, with concentration in Zagreb and major urban centers | Medium term (2-4 years) |
| Proliferation of automated parcel lockers along Adriatic transport hubs | 4.3% | Coastal regions, particularly tourist destinations | Short term (≤ 2 years) |
| EU eIDAS-compliant digital signature roll-out boosting online B2B procurement | 3.6% | National, with emphasis on business districts | Medium term (2-4 years) |
| Surge in mobile-only bank accounts (e.g., Revolut HR) widening addressable card base | 2.9% | Urban centers, with spillover to smaller towns | Short term (≤ 2 years) |
| Tourism-led seasonal demand peaks stabilise e-grocery last-mile economics | 2.1% | Adriatic coast and islands | Medium term (2-4 years) |
| Digital-native Gen-Z share of disposable income surpassing 25% in 2024 | 1.4% | National, with concentration in university cities | Long term (≥ 4 years) |
| Source: Mordor Intelligence | |||
Government-subsidised SME Digital-Voucher Programme Accelerating Webshop Adoption
Croatia’s voucher scheme offers up to EUR 10,000 (USD 10,900) per SME for technology upgrades, catalysing a 51.4% increase in programming enterprises between 2019 and 2023.[3]OECD, “Digital and Green SMEs: Accelerating the Twin Transitions in the Western Balkans,” OECD Publishing, oecd.org. The subsidy removes capital constraints that once delayed online launches and now funds inventory systems, CRM platforms, and secure checkout modules. More than 30,000 firms had drawn on the vouchers by 2025, materially enlarging the Croatia e-commerce market’s merchant base. The initiative also stimulates private-sector demand for local IT service providers, tightening feedback loops between tech talent and retail innovation. Over the medium term, the programme is expected to propagate omnichannel norms even among micro-retailers, broadening category depth and regional coverage.
Proliferation of Automated Parcel Lockers Along Adriatic Transport Hubs
Carriers and retailers have installed self-service lockers at ferry terminals and major coastal transit points, cutting last-mile costs by 22% and failed deliveries by 37%.[4]World Bank, “Croatian Logistics: Opportunities for Sustainable Competitiveness,” World Bank Group, worldbank.org. The 24/7 access resolves the “island premium” cost gap that historically discouraged online shopping among archipelago residents. Locker density also absorbs sharp seasonal surges when tourist volumes push order counts 65-85% above off-peak norms. Short-term benefits include higher first-try delivery success and reduced courier congestion, while long-term gains appear in customer loyalty scores as convenience rises. Operators are layering digital advertising panels on lockers, opening incremental revenue streams and reinforcing coastal brand visibility during peak visitor months.
EU eIDAS-compliant Digital Signature Roll-out Boosting Online B2B Procurement
Croatia’s alignment with EU eIDAS protocols enables friction-less, legally binding digital signatures embedded in its eRačun platform. Approval cycles for cross-border orders now fall by 64%, unlocking working-capital efficiencies for SMEs engaged in EU trade. Mandatory e-invoicing for VAT payers from 2026 reinforces the new normal, anchoring the projected 18.1% CAGR for B2B commerce. Procurement portals integrate the signature layer with Peppol, accelerating supplier onboarding and catalogue updates. Over the medium term, buyers shift repetitive spot purchases to digital frameworks, shrinking manual paperwork and elevating audit-trail transparency, which, in turn, attracts foreign partners seeking compliant sourcing hubs within the EU.
Surge in Mobile-only Bank Accounts Widening Addressable Card Base
Neobanks such as Revolut simplify KYC and deliver loyalty-led rewards, driving mobile-based payments to 28% of all Croatian online transactions—well above the euro-area mean. The friction-less onboarding expands card issuance among younger cohorts and first-time banking customers in second-tier cities. Embedded analytics fine-tune credit risk, enabling instant buy-now-pay-later decisions that lift average order values. Wallet providers also experiment with local merchant cashback to stimulate repeat purchases, reinforcing the Croatia e-commerce market’s conversion funnel. Short-term gains materialise in higher checkout completion rates, while in the long term, richer transaction data informs hyper-personalised promotions and micro-credit offers.
Restraints Impact Analysis*
| Restraint | (~) % Impact on CAGR Forecast | Geographic Relevance | Impact Timeline |
|---|---|---|---|
| High domestic courier tariffs to island municipalities inflate shipping costs | -3.6% | Adriatic islands and remote coastal areas | Medium term (2-4 years) |
| Card-on-file reluctance among 55+ cohort limits conversion rates | -2.9% | National, more pronounced in rural areas | Long term (≥ 4 years) |
| Warehouse labour shortages in Zagreb–Karlovac logistics corridor | -2.1% | Central Croatia, particularly Zagreb metropolitan area | Short term (≤ 2 years) |
| Fragmented address database causing delivery-first-attempt failure >8% | -1.4% | National, with higher impact in newly developed areas | Medium term (2-4 years) |
| Source: Mordor Intelligence | |||
High Domestic Courier Tariffs to Island Municipalities Inflate Shipping Costs
Parcel surcharges run 35-45% above mainland rates, tightening category economics for low-margin staples. Ferry dependencies and weather-linked disruptions elongate delivery windows and erode the perceived convenience premium of e-commerce. While hub-and-spoke pilots in coastal centres show promise, sustained cost parity remains elusive because route density outside peak tourist months is thin. SME merchants often exclude islands from free-shipping promotions, dampening order volumes and constraining the overall Croatia e-commerce market’s geographic expansion. Mid-term mitigation hinges on coordinated maritime timetable optimisation and shared micro-fulfilment nodes financed through EU cohesion funds.
Card-on-file Reluctance Among 55+ Cohort Limits Conversion Rates
Customers aged 55 and above abandon carts at 2.4 times the rate of younger users when confronted with saved-card prompts. Security and privacy concerns rooted in pre-digital banking habits deter credential storage, prolonging checkout flows and suppressing lifetime value. Guest-checkout workarounds lift single-purchase conversions but forfeit repeat-buy efficiency. Cash-on-delivery still appeals in rural zones yet raises return risk and logistics overhead. Over the long term, education campaigns led by banks and consumer-protection agencies, coupled with tokenised payment rails, aim to narrow the trust deficit and unlock incremental demand within this demographic.
*Our forecasts treat driver/restraint impacts as directional, not additive. The impact forecasts reflect baseline growth, mix effects, and variable interactions.
Segment Analysis
By Business Model: B2B Growth Outpaces Dominant B2C
The B2C segment controlled 86.40% of the Croatia e-commerce market size in 2025, generating USD 509 in average revenue per active shopper. Continuous smartphone adoption and intuitive payment interfaces keep entry barriers low for mass-market categories such as fashion and electronics. Domestic multi-category platforms leverage local inventory pools to promise next-day delivery across mainland urban clusters, while cross-border marketplaces augment SKU breadth at competitive prices. Marketing spend tilts toward social-commerce integrations that resonate with Gen Z, whose disposable-income share exceeded 25% in 2024.
B2B commerce, at 13.60% of turnover, is forecast to compound at 17.48% annually through 2031—outstripping the wider Croatia e-commerce market. Mandated e-invoicing and eIDAS-grade signatures compress transaction lead times and broaden procurement networks across the EU. Industrial distributors migrate catalogues online, inserting punch-out integrations into enterprise resource-planning systems to capture long-tail orders. Early adopters report internal process-cost savings of up to 30%, validating the economic case for further digital migration. As corporate buyers automate approval chains, order frequency rises, deepening vendor lock-in and lifting platform stickiness.


By Device Type: Mobile Commerce Dominates While Alternative Devices Emerge
Smartphones captured 61.45% of the Croatia e-commerce market share in 2025, reflecting superior 4G/5G coverage and a mobile internet culture anchored in chat-based service interactions. Retailers optimise glide-paths with one-hand checkout, biometric authentication, and push-notification re-engagement loops. Seamless in-app loyalty widgets drive higher repeat purchase propensity relative to desktop sessions.
Alternative devices—smart TVs, voice assistants, wearables—are poised for a 15.88% CAGR, signalling the next shopper interface wave. Media-streaming platforms embed “buy-as-you-watch” overlays, while voice commerce gains traction for routine household replenishment. Desktop relevance persists for high-involvement, research-heavy purchases such as enterprise IT gear, underscoring the omnichannel imperative. Device-agnostic payment tokens harmonise experience quality, reinforcing the total Croatia e-commerce market size advantage built on frictionless access across screens.
By Payment Method: Digital Wallets Challenge Card Dominance
Cards remained the primary tender with 39.25% of the Croatia e-commerce market size in 2025, underpinned by widespread issuer coverage and strong consumer chargeback protection. A surge in tokenisation, 3-DS2 protocols, and instant refund features helps sustain trust.
Digital wallets are scaling at a 21.63% CAGR, closing the gap via embedded loyalty, cross-border fee transparency, and behavioural-data-driven offers. Revolut’s RevPoints programme signed up 100,000 Croatian users within one month of debut, accelerating wallet penetration. BNPL volumes double-digit grow, especially in fashion baskets, as zero-interest instalments resonate with budget-sensitive millennials. Cash-on-delivery recedes yet retains relevance in rural same-day niches. Regulatory PSD2 support for open-banking APIs paves the way for account-to-account pay-by-link flows, broadening choice and fee competition.
By B2C Product Category: Food & Beverages Surge While Electronics Lead
Consumer electronics held a 20.60% share of the Croatia e-commerce market size in 2025, propelled by standardised SKUs and high value-to-weight economics. Specialist sites deploy augmented reality configurators and AI-powered product guides to mitigate feature complexity and reduce returns. Cross-border sellers maintain price pressure, pushing domestic players toward service bundles such as extended warranties and onsite installation.
Food & beverages, advancing at a 17.31% CAGR, benefits from grocery chains’ dark-store investments and cold-chain fleet upgrades. Konzum’s EUR 10 million (USD 10.9 million) injection into fulfilment infrastructure in 2024 accelerated slot availability and reduced substitution rates. Seasonal tourism skews volume toward the coast, enabling density-driven cost optimisation. Fashion and beauty categories continue to scale on the back of free returns and influencer-led discovery, whereas furniture growth is moderated by bulky-goods logistics constraints.
Geography Analysis
Zagreb and its wider metropolitan zone account for roughly 39.60% of Croatia e-commerce market transactions owing to dense broadband coverage, high purchasing power, and proximity to the Zagreb–Karlovac logistics corridor. Fulfilment centres cluster near highway junctions, allowing next-day delivery across central Croatia even under peak Black Friday loads. Warehouse labour shortages, however, inflate operating costs and necessitate robotics adoption for picking and packing.
The Adriatic coastal belt, anchored by Split, Rijeka, and Dubrovnik, posts the sharpest seasonal swings as tourism inflates basket volumes by up to 85% during summer. Automated parcel-locker networks at ports absorb off-hours pickups, enhancing customer experience and dampening courier overtime expenses. Retailers calibrate regional stock buffers to prevent stock-outs of consumables popular with visitors, such as sunscreen and convenience snacks.
Island municipalities and interior rural areas still trail in order frequency due to elevated shipping surcharges and patchy address databases. The government has earmarked EUR 133 million (USD 145 million) for gigabit connectivity to 100,000 underserved households by 2026. As coverage improves, mobile commerce is expected to leapfrog desktop adoption, offering merchants new growth corridors once last-mile costs normalise through locker mini-hubs and maritime schedule optimisation.
Regulatory Landscape
Croatia’s e-commerce operating environment is increasingly shaped by EU digital-platform rules and domestic digitization mandates. The Act on the Implementation of the Digital Services Act was published on 10 April 2025 and entered into force on 18 April 2025, designating HAKOM as the national Digital Services Coordinator and introducing formal obligations for intermediary service providers (including notification via HAKOM’s e-Provider DSA system). In parallel, Regulation (EU) No 910/2014 (eIDAS) underpins legally valid electronic signatures and trust services, with the Ministry of Economy and Sustainable Development acting as the supervisory body for trust service providers and maintaining the national trusted list.
On the transactional side, Fiscalization 2.0 and mandated B2B e-invoicing and real-time reporting took effect for VAT-registered businesses from 1 January 2026, reinforcing the role of eRačun and structured digital audit trails in B2B trade flows. Compliance requirements now extend beyond checkout and delivery to cover invoice data integrity, standardized product and service classification in e-invoices, and platform governance processes aligned to DSA rules. This combination raises baseline compliance costs for merchants and platforms, while also reducing friction in cross-border procurement and dispute handling when digital identity, signature, and invoicing rails are embedded end-to-end.
Value Chain Analysis
Croatia’s e-commerce value chain begins with merchants and brand owners that predominantly prioritize proprietary online stores over third-party marketplaces, which concentrates decision-making on first-party site performance, merchandising, and customer service. Demand generation is then translated into conversion through local payment stacks and bank rails, with payment service providers and gateways enabling card payments and a growing mix of digital wallets and mobile banking. Order capture feeds into inventory positioning and warehousing, where Zagreb and the Zagreb-Karlovac logistics corridor act as the primary storage and dispatch hub for national coverage, while coastal demand surges during peak tourism periods add variability in picking, packing, and courier capacity requirements.
Downstream, last-mile delivery is executed by parcel carriers, postal operators, and an expanding parcel-locker layer that supports 24/7 pickup, particularly along Adriatic transport hubs and ferry-linked routes. Logistics performance is closely tied to Croatia’s road-transport-dominant freight profile, while rail remains underdeveloped, keeping fulfillment dependent on trucking economics and labor availability. The governance layer has become a functional part of the chain, as platforms and intermediary service providers must complete DSA-related notification processes with HAKOM and operationalize content and trader-account controls, while B2B participants align invoicing and reporting processes to Fiscalization 2.0 from 2026, linking front-end order data to compliant back-office invoicing and reporting workflows.
Competitive Landscape
The top ten platforms capture an estimated 65% of Croatia e-commerce market turnover, evidencing moderate concentration. Local leaders eKupi, Konzum, and Sancta Domenica anchor share on the strength of domestic warehousing, proximity sourcing, and Croatian-language after-sales support. International entrants Zalando and About You deploy data-science-driven assortment curation and cross-border shipping subsidies to win fashion-savvy millennials. Amazon and AliExpress, while present through direct-to-consumer imports, face longer transit times that cap share growth in impulse categories.
Competition pivots on fulfilment speed, payment choice, and niche category mastery. Konzum’s EUR 15 million (USD 16.4 million) automated Zagreb facility triples e-grocery throughput, signalling a shift toward high-automation fulfilment as labour markets tighten. eKupi’s acquisition of Chipoteka consolidates the electronics long tail and yields buying-power synergies. Lidl’s same-day coastal delivery pilot tests the viability of micro-fulfilment nodes targeting tourist hotspots.
Regulatory change also shapes strategic agendas. The upcoming Digital Product Passport under CWA 18186 will heighten transparency in sustainability attributes, favouring early adopters able to surface traceability data at point of sale. Meanwhile, SME voucher recipients intensify competitive churn as an influx of newly online micro-retailers fragments share in artisanal and region-specific product lines. Larger incumbents counter by integrating these SMEs into marketplace formats, preserving traffic scale while enriching assortment diversity.
Croatia E-commerce Industry Leaders
Ekupi d.o.o
Sancta Domenica d.o.o.
Fliba d.o.o.
Bauhaus-Zagreb k.d.
Pevex d.d.
- *Disclaimer: Major Players sorted in no particular order

Market Opportunities and Future Outlook
Mandatory B2B e-invoicing and real-time reporting from 1 January 2026 under Fiscalization 2.0 creates a clear commercialization path for ERP, accounting, e-invoicing, and integration providers that can connect webshops, procurement portals, and eRačun workflows into a single compliant process. This requirement also elevates demand for eIDAS-aligned trust services and digital signature integrations, particularly where Croatian SMEs transact cross-border within the EU and need legally binding, auditable approvals embedded in purchasing journeys.
Public-sector digitization initiatives provide additional whitespace for merchant enablement and payments acceptance. In February 2026, the Ministry of Economy launched the eInvestments platform to digitize state aid and strategic investment procedures, signaling continued migration of business interactions with the state toward end-to-end digital processes. Separately, AmCham Croatia’s 2026 engagement with the Ministry of Justice, Public Administration and Digital Transformation to broaden digital payment availability in public institutions (building on ePristojbe) supports higher wallet and card usage familiarity beyond retail checkouts. At the same time, EU oversight of Digital Services Act implementation, including an additional European Commission letter of formal notice in April 2026, increases the need for platform governance tooling, seller onboarding controls, and compliance services for marketplaces, classifieds, and cross-border platforms serving Croatian users.
Recent Industry Developments
- April 2026: The European Commission issued an additional letter of formal notice to Croatia concerning gaps in Digital Services Act implementation, including aspects tied to empowering the national Digital Services Coordinator and enforcement arrangements. This accelerates compliance work for platforms and intermediary services active in Croatia, pushing earlier investment in DSA-ready governance processes, trader onboarding controls, and reporting workflows.
- May 2025: Konzum opened an automated fulfillment center in Zagreb, expanding capacity and improving order throughput and accuracy. The upgrade tightens delivery-time competition in online grocery and raises the operational benchmark for cold-chain capable fulfillment in the Zagreb catchment area.
- December 2024: Revolut launched RevPoints in Croatia and signed up 100,000 users within one month. Faster wallet adoption strengthens the digital-payments mix for e-commerce merchants and increases the addressable base for loyalty-linked checkout experiences in categories such as fashion and travel-related physical goods.


Research Methodology Framework and Report Scope
Market Definition and Coverage
For this report, the Croatia e-commerce market is defined as the value of purchases of physical goods ordered through internet-enabled channels (websites or apps) by buyers located in Croatia, where the order is fulfilled through delivery networks or pickup.
Scope exclusions: We exclude digital-only content, travel bookings, online gambling, and pure financial transfers from the market totals.
Segmentation Overview
- By Business Model
- B2C
- B2B
- By Device Type
- Smartphone / Mobile
- Desktop and Laptop
- Other Device Types
- By Payment Method
- Credit / Debit Cards
- Digital Wallets
- BNPL
- Other Payment Method
- By B2C Product Category
- Beauty and Personal Care
- Consumer Electronics
- Fashion and Apparel
- Food and Beverages
- Furniture and Home
- Toys, DIY and Media
- Other Product Categories
Data Sources, Market Sizing, and Validation
Desk Research
Desk research was used to map Croatia's online buying environment and to set realistic guardrails around spend, delivery, and payment behavior. We referenced public sources such as the Croatian Bureau of Statistics for retail and household indicators, Eurostat for ICT and cross-border purchasing participation, and European Commission materials tied to Digital Single Market rules that shape online trade.
To anchor logistics and demand signals, we also reviewed sources such as the Universal Postal Union and national postal and courier updates where available, along with customs and trade statistics when they help explain inbound goods flows. Company filings, investor presentations, and reputable press were used to sense-check category momentum, promotions, and changes in delivery models. In a few cases, paid database subscriptions for company financials, news and financials, and shipment-level import-export checks were used to validate scale and timing. The sources mentioned above are illustrative and not exhaustive, and many other public materials were also used for data collection, validation, and research clarification.
Primary Interviews and Surveys
We interview Croatian retailers, marketplaces, logistics specialists, payment experts, and digital commerce managers. Their input tests online demand, order frequency, average basket value, channel mix, and business-to-business activity against desk findings. Re-contact is triggered when reported trends conflict with observed retail or consumer signals.
Distribution of primary research fieldwork respondents
| Company type | Respondent position |
|---|---|
| Top tier: 30% | CXOs: 20% |
| Mid tier: 50% | Functional/Unit leaders: 30% |
| Smaller Players: 20% | Managers: 50% |
Market-Sizing & Forecasting
The core sizing logic uses a top-down build that reconstructs online physical-goods spending from Croatia-specific demand signals, followed by adjustments that reflect how orders are fulfilled and paid for. In practice, we start from online purchase participation and the active buyer base, apply realistic online spend per buyer, then align the total to observable online retail intensity within the country.
Several market inputs were treated as key drivers because they move the total in measurable ways. These include online shopper penetration, the share of retail spending that shifts online, average order value and order frequency patterns, the mix of domestic versus cross-border orders that are billed or fulfilled in Croatia, and the split between home delivery, parcel lockers, and store pickup. Where an input was noisy, we handled gaps by using bounded ranges, then narrowed them using interview feedback and simple arithmetic checks.
Forecasts were built using scenario analysis, since growth is influenced by adoption pace, pricing pressure, and delivery capacity rather than a single straight-line trend. Assumptions on internet usage, payment acceptance, fulfillment reach, and retailer investment plans were taken from expert views and applied consistently across the forecast years. To keep the totals realistic, the top-down outcome was corroborated with selective bottom-up approximations such as sampled merchant GMV ranges, channel checks on pricing and promotions, and volume times ASP spot checks for high-traffic categories.
Data Validation & Update Cycle
Before numbers are finalized, our team checks whether the model behaves like the real market by comparing outputs against independent signals such as online purchase participation rates, retail benchmarks, and delivery and payment adoption patterns. Outliers are reviewed, assumptions are revisited, and any large variance triggers a re-contact with relevant interviewees so we do not carry forward a weak input.
We run a multi-step analyst review so arithmetic, definitions, and scope boundaries stay consistent across historical years and the forecast window. Reports are refreshed annually, and interim updates are made when material events occur that can shift demand, pricing, or cross-border buying behavior. Before delivery, an analyst performs a fresh pass so clients receive the latest updated view.
Mordor Intelligence's Croatia Ecommerce Market Estimate Compared With Other Published Estimates
Published market sizes for Croatia e-commerce often do not match because authors count different elements and apply different conversion, timing, and growth assumptions. Common differences show up in whether an estimate is tracking GMV versus net revenue, whether cross-border orders are counted, and how pick-up and locker fulfillment are treated.
Online shopping participation indicators and fulfillment reality checks (courier and parcel locker use, plus how spending maps back to national retail signals) provide the evidence that ties Mordor Intelligence to a physical-goods-only scope that excludes travel and digital-only services, which tends to shift totals versus broader online spending views.
Benchmark comparison
| Source | Market Size | Gaps in Research Methodology |
|---|---|---|
| Mordor Intelligence | USD 1.05 B (2025) | |
| Government Trade Brief A | USD 1.30 B (2023) | Uses a broader country-level e-commerce value view that can blend domestic and cross-border activity without consistently separating physical-goods GMV from adjacent service spend, which can lift totals depending on inclusion choices. |
| E-commerce Data Platform B | USD 1.00 B (2025) | Tracks online channel revenue with limited visibility on fulfillment location and cross-border billing treatment, so totals can run lower when marketplace GMV and offline-to-online pickup models are not fully captured. |
From the publisher comparison, the main takeaway is that definitions and measurement units create most of the gap, and then FX timing and growth assumptions widen it further. Our model keeps the total traceable to buyer participation, spend intensity, and fulfillment patterns so decision-makers can follow each step and recreate the logic with the same inputs.


Key Questions Answered in the Report
How large is the Croatia e-commerce market in 2026 and how fast is it growing?
The Croatia e-commerce market is valued at USD 1.2 billion in 2026 and is on track for a 14.05% CAGR to reach USD 2.31 billion by 2031.
Which business model is expanding the fastest in Croatian e-commerce?
B2B commerce, currently 13.60% of turnover, is rising at an 17.48% CAGR as mandatory e-invoicing and digital signatures streamline corporate procurement.
What payment method is gaining the most traction online?
Digital wallets, boosted by Revolut’s RevPoints launch, are set to grow at a 21.63% CAGR, challenging the 39.25% share still held by cards.
Why are automated parcel lockers important for Croatia’s market?
Lockers reduce last-mile costs by 22% and failed deliveries by 37% along the coast, mitigating high courier tariffs and seasonal volume spikes.
Which product category tops online sales and which is growing fastest?
Consumer electronics leads with a 20.60% share, while food & beverages is the fastest-growing category at a 17.31% CAGR to 2031.
How concentrated is the competitive landscape?
The top ten platforms command about 65% of sales, reflecting moderate concentration with ongoing space for specialist entrants and regional niches.
Page last updated on:


 Your data is secure and never sold or shared.


