
Counterfeit Drug Detection Device Market Size and Share
Market Overview
| Study Period | 2020 - 2031 |
|---|---|
| Market Size (2026) | USD 1.63 Billion |
| Market Size (2031) | USD 2.21 Billion |
| Growth Rate (2026 - 2031) | 6.30 % |
| Fastest Growing Market | Asia Pacific |
| Largest Market | North America |
| Market Concentration | Medium |
Major Players *Disclaimer: Major Players sorted in no particular order Image © Mordor Intelligence. Reuse requires attribution under CC BY 4.0. | |
Counterfeit Drug Detection Device Market Analysis by Mordor Intelligence
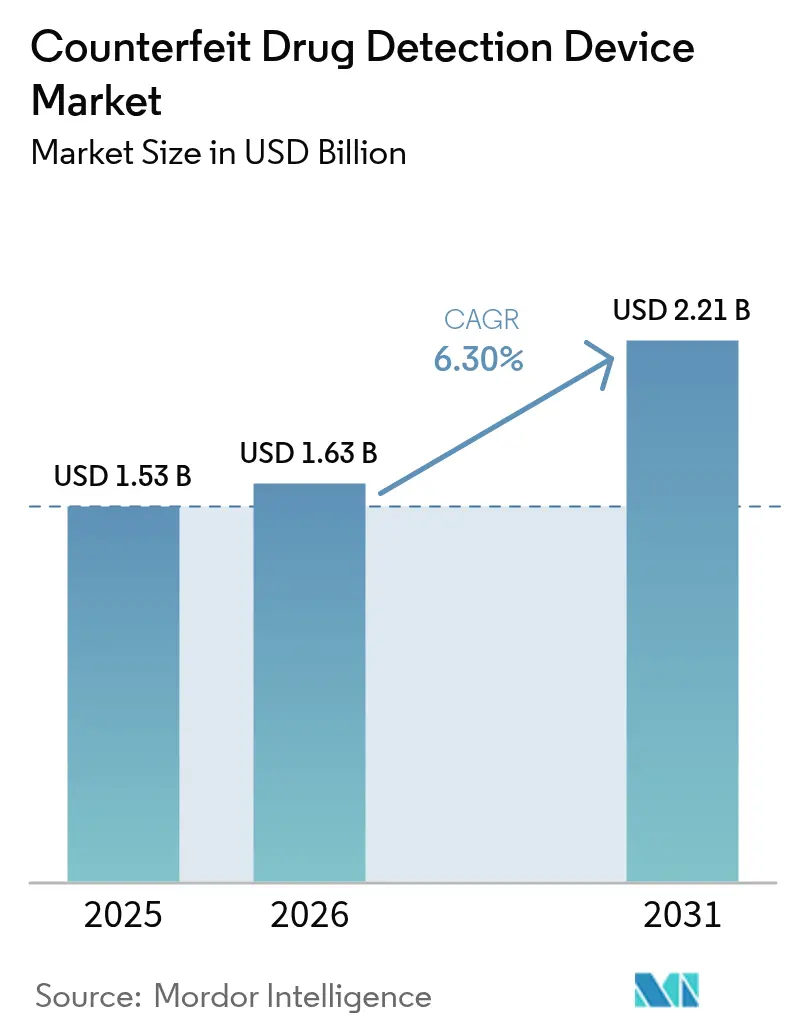
The Counterfeit Drug Detection Device market size is expected to grow from USD 1.53 billion in 2025 to USD 1.63 billion in 2026 and is forecast to reach USD 2.21 billion by 2031 at 6.30% CAGR over 2026-2031.
Heightened global vigilance against falsified medicines, stricter serialization mandates, and gains in spectroscopy sensitivity underpin this trajectory. Pharmaceutical brand owners now view on-dosage authentication as a strategic risk-mitigation investment, while the rise of high-value biologics broadens the opportunity base. Handheld Raman systems remain the workhorse for frontline screening; however, demand is rapidly shifting toward AI-enabled Surface-Enhanced Raman Spectroscopy (SERS) platforms that capture sub-ppm anomalies. Supply-chain digitalization creates a parallel pull for devices able to integrate seamlessly with blockchain and IoT data layers, positioning software-centric entrants to challenge established instrument makers.
Key Report Takeaways
- By technology, raman spectroscopy led with 40.92% of counterfeit drug detection device market share in 2025; surface-enhanced raman spectroscopy is set to compound at a 8.94% CAGR through 2031.
- By modality, handheld devices captured 51.05% of the counterfeit drug detection device market size in 2025, while portable back-pack systems are forecast to register an 8.11% CAGR to 2031.
- By application, chemical-composition verification accounted for a 58.88% share of the counterfeit drug detection device market size in 2025 and mixed-dosage analysis is advancing at a 10.75% CAGR through 2031.
- By end user, pharmaceutical manufacturers represented 46.25% of the counterfeit drug detection device market size in 2025; drug-testing laboratories are projected to increase at a 7.29% CAGR to 2031.
- By geography, North America held 38.22% of the counterfeit drug detection device market share in 2025, whereas Asia Pacific exhibits the fastest regional CAGR at 9.33% to 2031.
Note: Market size and forecast figures in this report are generated using Mordor Intelligence’s proprietary estimation framework, updated with the latest available data and insights as of 2026.
Global Counterfeit Drug Detection Device Market Trends and Insights
Drivers Impact Analysis*
| Driver | (~) % Impact on CAGR Forecast | Geographic Relevance | Impact Timeline |
|---|---|---|---|
| Emphasis on advanced supply-chain surveillance | +1.1% | North America, European Union | Medium term (2-4 years) |
| Shift from packaging to on-dosage security | +0.8% | Asia Pacific emerging markets | Long term (≥ 4 years) |
| Supportive government & regulatory mandates | +1.2% | North America, European Union, expanding to Asia Pacific | Short term (≤ 2 years) |
| AI-powered SERS enabling sub-ppm field tests | +0.9% | Developed markets worldwide | Medium term (2-4 years) |
| IoT-integrated smart packaging validation | +0.7% | North America, European Union, spill-over to Asia Pacific | Medium term (2-4 years) |
| Demand surge from cannabis edibles & personalized medicines | +0.6% | North America, newly legalized markets | Long term (≥ 4 years) |
| Source: Mordor Intelligence | |||
Emphasis on Advanced Supply-Chain Surveillance
Global regulators now demand end-to-end visibility, transforming detection from sporadic spot checks to continuous traceability. The Drug Supply Chain Security Act in the United States stipulates electronic interoperable exchange of serialized data at the package level, obliging every supply-chain node to validate authenticity before ownership transfer.[1]U.S. Food and Drug Administration, “Enhanced Drug Distribution Security Requirements,” fda.gov Parallel efforts in the European Union and Gulf Cooperation Council align serialization formats, allowing multinational companies to streamline compliance workflows. Device vendors therefore embed 2D-data-matrix decode, RFID interrogators, and cloud connectors into spectroscopic platforms. Nigeria’s historically high 70% counterfeit prevalence underscores why developing markets also accelerate investment once digital frameworks mature. As low-latency data sharing becomes a license to operate, procurement specifications increasingly list integration readiness alongside analytical performance.
Shift From Packaging to On-Dosage Security
Counterfeiters often recycle authentic secondary packaging, making pack-level markers less reliable. Pharmaceutical firms now embed microscopic identifiers on tablets and capsules, driving demand for optics that can read chemical or photonic signatures resident on the dosage itself. Asia Pacific generics manufacturers champion this shift following India’s QR code order for top-selling molecules. SERS micro-substrates bonded to dosage surfaces offer quick confirmatory reads, and portable imagers configured for narrow field-of-view detection ensure in-line process adoption. Drug-regulatory agencies welcome the trend because on-dosage devices travel with the medicine, simplifying border inspection procedures and reducing diversion risk. The design update also shortens investigation cycles because analysts can validate suspect lots without opening primary packs.
Supportive Government & Regulatory Mandates
Governments now treat falsified medicines as a public-health emergency. The European Medicines Agency enforces a directive requiring tamper-evident features plus unique identifiers on every prescription pack. The United States finalizes enhanced distribution security in November 2024, obliging electronic interoperable verification, while China’s National Medical Products Administration pilots GMP annexes for mandatory authenticity testing during release. Compliance deadlines convert optional authenticity projects into capital-budget line items, insulating device demand from macroeconomic cycles. They also force midsize contract manufacturers and pharmacies, previously exempt, to invest in starter handheld units to avoid supply-chain exclusion. The compulsion along with penalty structures accelerates device refresh cycles toward higher analytical resolution and audit-trail robustness.
AI-Powered SERS Enabling Sub-PPM Field Tests
Traditional Raman struggles with weak signals on colored tablets or viscous biologic vials. By adsorbing analytes onto engineered nano-substrates, SERS amplifies scattered light by factors of 10^6, while embedded AI models classify spectra in milliseconds without operator interpretation.[2]American Pharmaceutical Review, “Advances in SERS for Pharmaceutical Analysis,” americanpharmaceuticalreview.com Field units weighing under 3 kg now exceed laboratory sensitivity of earlier-generation bench systems. Continuous machine-learning updates let the algorithms detect formulation drifts or new adulterants, addressing the fast-evolving counterfeit tactics. Manufacturers favor AI-SERS for biologic injectables where micro-dosing errors pose acute toxicity risk. Customs agencies benefit as well, scanning cargo shipments without opening sealed secondary packs, thus preserving chain-of-custody evidence for prosecution.
Restraints Impact Analysis*
| Restraint | (~) % Impact on CAGR Forecast | Geographic Relevance | Impact Timeline |
|---|---|---|---|
| Low awareness in developing regions | −0.4% | Africa, Latin America, Southeast Asia | Long term (≥ 4 years) |
| High upfront cost of spectroscopy devices | −0.3% | Global, affecting small dispensers | Medium term (2-4 years) |
| Laser-safety limits on hospital use of handheld Raman | −0.2% | European Union, North America | Short term (≤ 2 years) |
| Lack of spectral libraries for novel drug–polymer combos | −0.3% | Personalized-medicine markets worldwide | Medium term (2-4 years) |
| Source: Mordor Intelligence | |||
Low Awareness in Developing Regions
Misconceptions about authentication technologies persist where primary healthcare budgets remain pressured. Surveys in Ethiopia show only 12% of pharmacists trained on counterfeit recognition techniques, hindering uptake even when external funding subsidizes devices. Manufacturers counter the deficit through donation programs bundled with virtual training modules, yet network connectivity gaps limit remote learning. Regional regulatory agencies often lack forensic labs to validate confiscated samples, suppressing the feedback loop needed to illustrate device value to frontline clinicians. Until governments formalize widespread pharmacovigilance curricula, penetration in these regions will trail global averages.
High Upfront Cost of Spectroscopy Devices
Baseline handheld Raman analyzers start near USD 10,000 while premium chemometric-enabled models surpass USD 50,000. Added to that, annual calibration, laser-safety audits, and operator certification inflate ownership costs. Small rural pharmacies exempted from serialization until November 2026 defer investment, opening a window for sub-standard products to circulate. Leasing programs mitigate sticker shock but require credit histories many micro-dispensers lack. Device-as-a-service contracts show early promise in Western Europe, yet uptake in emerging markets will depend on multilateral financing or pooled procurement schemes.
*Our forecasts treat driver/restraint impacts as directional, not additive. The impact forecasts reflect baseline growth, mix effects, and variable interactions.
Segment Analysis
By Technology: SERS Gains Momentum Against Established Raman
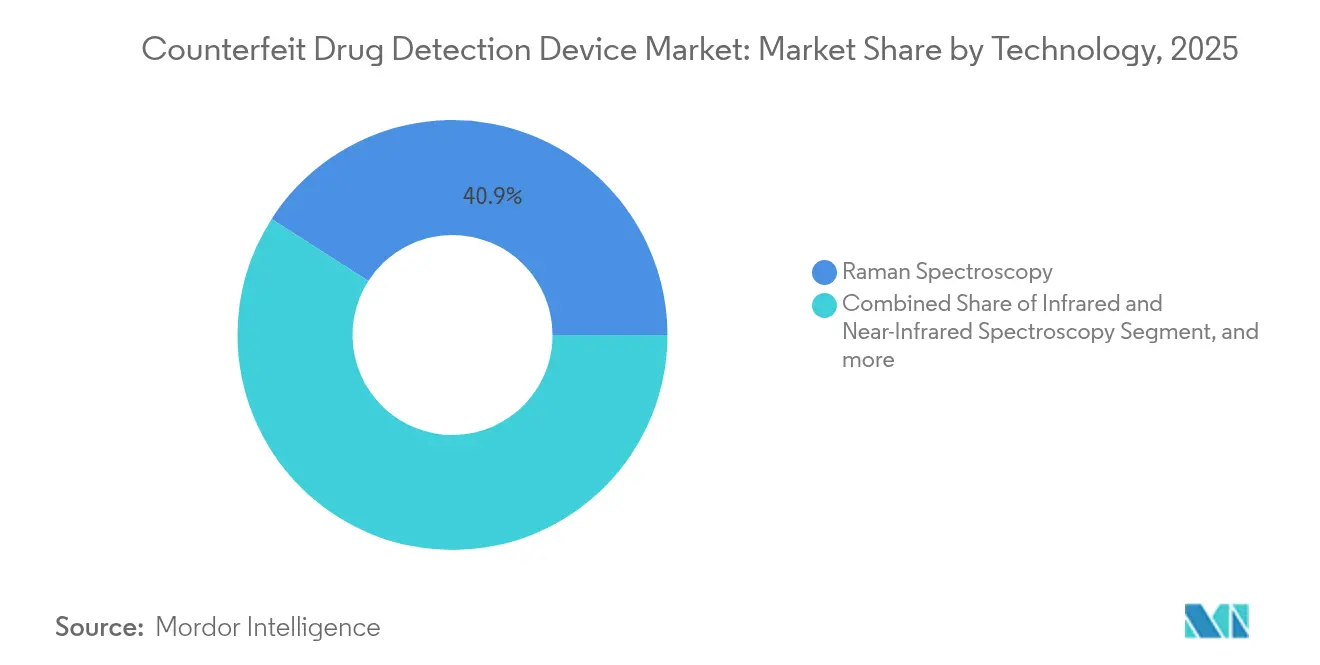
The counterfeit drug detection device market size for raman spectroscopy accounted for 40.92% in 2025. Despite this base, SERS will outpace all rival techniques with a projected 8.94% CAGR to 2031, narrowing the revenue gap rapidly. Raman’s dominance stems from its non-destructive nature and minimal sample prep, yet counterfeiters’ switch to molecularly similar adulterants pushes traditional Raman to its detection ceiling. SERS employs plasmonic nano-structures that intensify Raman signals, unlocking a detection threshold below 1 ppm, a crucial benchmark for biologics and controlled substances. Instrument builders integrate AI models to autosubtract background fluorescence, enabling frontline staff to interpret outputs accurately. Infrared (IR) and near-infrared (NIR) methods continue as affordable options for excipient verification, while microfluidic lab-on-chip platforms appeal to high-throughput batch release by merging sample dilution and optical interrogation on a single cartridge. RFID-plus-blockchain tagging rises fastest outside optical families, complementing spectroscopic reads by delivering immutable provenance records.
Technological convergence accelerates multi-modal platforms capable of sequential Raman, fluorescence, and hyperspectral imaging in under 60 seconds, maximizing identification certainty. Capital budgets formerly siloed by analytical function are consolidating, encouraging cross-department procurement of unified detection stacks. Start-ups focusing solely on one optical path risk marginalization unless partnering with data-analytics players. Spectral cloud repositories democratize access to reference libraries, but data-sovereignty rules in Europe compel on-premises deployment among some pharmaceutical contract manufacturers, spawning regional variations in cloud uptake.


By Modality: Portable Systems Narrow Gap With Handheld Leaders
Handheld units held a 51.05% of counterfeit drug detection device market share in 2025. Portable backpack systems now record an 8.11% CAGR through 2031, benefiting from miniaturized lasers and GPU-equipped micro-controllers that execute onboard chemometrics. End-users evaluate modalities against workflow throughput and sample accessibility: warehouse inspectors favor handhelds that scan blister packs within seconds, whereas field surveillance teams choose backpack rigs to assay drums or IBC totes with deeper penetration optics. The counterfeit drug detection device market size for benchtop instruments remains resilient in QC laboratories where regulated environments justify stationary setups and peak resolution specifications.
Emerging modular designs allow users to dock handheld probes into larger base units for extended spectral range, creating a continuum rather than discrete categories. Hospitals trial cart-mounted hybrids in pharmacy compounding rooms, achieving hospital-grade contamination control without sacrificing portability. Integration of battery management systems offering eight-hour duty cycles resolves earlier adoption hesitations tied to runtime limitations. Modality diversification aligns neatly with supply-chain decentralization smaller batch sizes and direct-to-patient distribution lines stretch authenticity checkpoints beyond plant walls, requiring devices that travel where the product flows.
By Application: Mixed-Dosage Verification Accelerates Adoption Curve
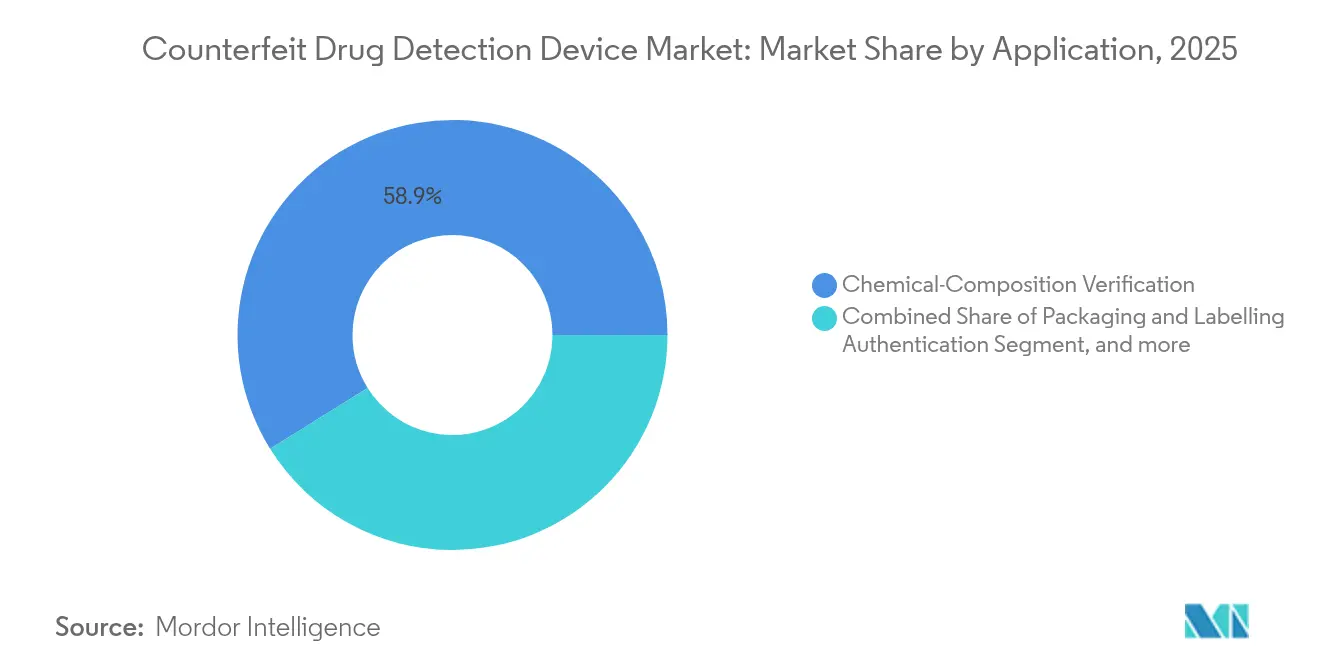
Chemical-composition verification continues as the backbone application, responsible for 58.88% of 2025 revenue, chiefly because regulators mandate API identity confirmation for every finished batch. Mixed-dosage analysis, however, will eclipse USD 515 million in revenue by 2031 after sustaining a 10.75% CAGR. Personalized poly-pill therapies and oncology cocktails embed multi-API regimens in single capsules, forcing detectors to resolve overlapping spectra. Multivariate analysis algorithms separate constituent signatures, reducing reliance on chromatographic lab confirmation. Packaging and labeling authentication holds steady as serialization compliance stabilizes across major markets, yet secondary-pack focus alone fails to address scenarios where counterfeiters refill genuine boxes with spurious pills.
Growth in mixed-dosage analysis intensifies demand for cross-validated reference sets encompassing co-crystals and polymer carriers. Instrument makers differentiate through proprietary chemometric models trained on pharmaceutical co-formulations, while academic consortia work on open-source spectral deconvolution scripts. Hybrid authenticity toolkits bundle optical scanners with micro-fluidic reagent tests to cross-validate suspect lots without full laboratory diversion, reducing quarantine time. As regulators begin drafting guidance for combination therapies, device specs will increasingly cite limit-of-quantification across multi-API profiles, influencing procurement scoring rubrics.
By End User: Laboratories Harness Outsourcing Upswing
Pharmaceutical manufacturers remain the single largest buyers, yet their 46.25% share is slowly ceding ground to independent laboratories that ride a 7.29% CAGR to 2031. Outsourcing emerges as a cost-containment lever; contract research organizations integrate counterfeit verification alongside dissolution and stability assays, monetizing incremental sample throughput. The counterfeit drug detection device market size for labs correlates with soaring biologics pipelines that mandate complex release testing beyond many small biotech firms’ capabilities. Customs authorities, border forces, and regulatory inspectorates provide a third leg of demand, standardizing handheld Raman adoption for seizure confirmation at ports of entry.
Laboratories’ workflow intensity calls for benchtop or rack-mounted systems supporting 96-well plate automation, pushing vendors to revamp sample-handling stages. ISO-17025 accreditation cycles influence hardware refresh decisions, creating predictable revenue cadence for device suppliers. Software dashboards now export directly into regulatory submissions, reducing transposition errors and shortening dossier compilation. Collaborations between CROs and blockchain platforms enable secure spectral data exchange with sponsors, an emerging selling point during client audits.
Geography Analysis
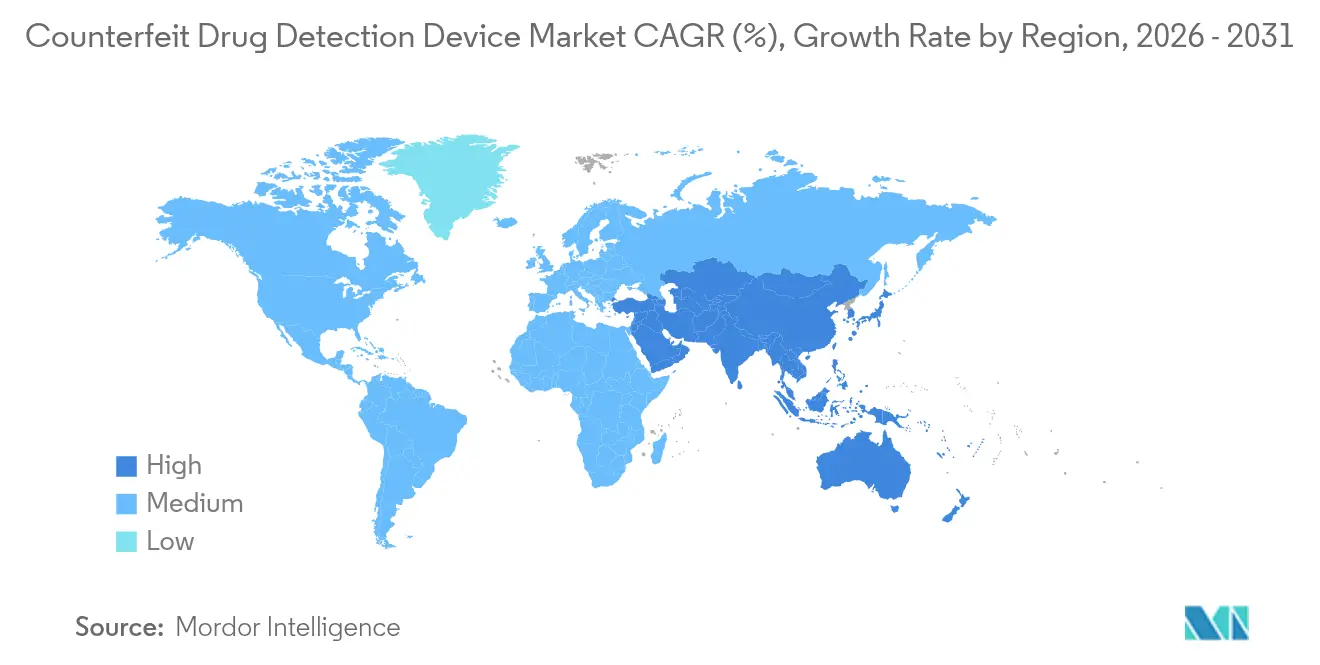
North America’s held market share of 38.22% in the counterfeit drug detection device market in 2025, buoyed by the Drug Supply Chain Security Act deadline that makes electronic verification compulsory. Device penetration in hospital pharmacies and specialty distributors remains among the world’s highest, and vendor support ecosystems cover calibration, compliance training, and third-party validation. The European Union maintains steady expansion as the Falsified Medicines Directive demands serialized packs and anti-tamper features. Benelux countries pioneer nation-wide blockchain registries interfacing with spectroscopy scanners, shortening authentication checks to under five seconds.
Asia Pacific now provides the steepest incline, with a 9.33% CAGR through 2031 as China tightens GMP rules and India enforces QR codes on the top 300 prescription brands. Local manufacturers, once reliant on visual inspection, pivot toward portable Raman units to satisfy export-market audits. Regional distributors also deploy mobile SERS devices in rural cold-chain routes where electricity outages mandate quick pass-fail decisions. Southeast Asian customs agencies adopt handheld scanners to intercept ASEAN-wide illicit flows before onward transit to Europe.
Latin America and Middle East-Africa collectively account for less than 10% of global revenue but represent outsized counterfeiting hotspots. Nigeria’s high counterfeit incidence drives donor-funded pilots that bundle detection devices with capacity-building workshops. Saudi Arabia’s track-and-trace platform Tatmeen aligns with GS1 standards, incentivizing device purchases compatible with 2D-data-matrix scans. Adoption remains sensitive to public-sector procurement schedules and multilateral aid cycles, but steady alignment with international pharmacovigilance norms signals medium-term upside.

Regulatory Landscape
Regulation continues to anchor demand around end-to-end traceability and verifiable product identity. In the United States, the FDA-administered Drug Supply Chain Security Act (DSCSA) drives electronic, interoperable exchange of serialized package-level data across trading partners, with phased timelines that culminate in a November 27, 2026 compliance deadline for small dispensers (25 or fewer employees) for certain requirements. These DSCSA obligations increase the need for inspection-grade authentication tools, particularly when supply-chain nodes must rapidly determine and communicate illegitimate product findings under time-bound reporting expectations.
In Europe, the Falsified Medicines Directive (FMD) safety features framework remains a core compliance baseline for prescription packs. The European Commission updated its Q&A guidance on safety features (version 22) on July 10, 2026, reinforcing interpretation consistency across member states. At the global level, WHO programs on substandard and falsified medical products support common surveillance and regulatory capacity-building, keeping pressure on national authorities to tighten post-market monitoring and standardize reporting approaches. Together, these mandates and guidance updates push device specifications toward audit trails, serialization compatibility (for example, DataMatrix scanning), and interoperability with broader supply-chain integrity systems.
Competitive Landscape
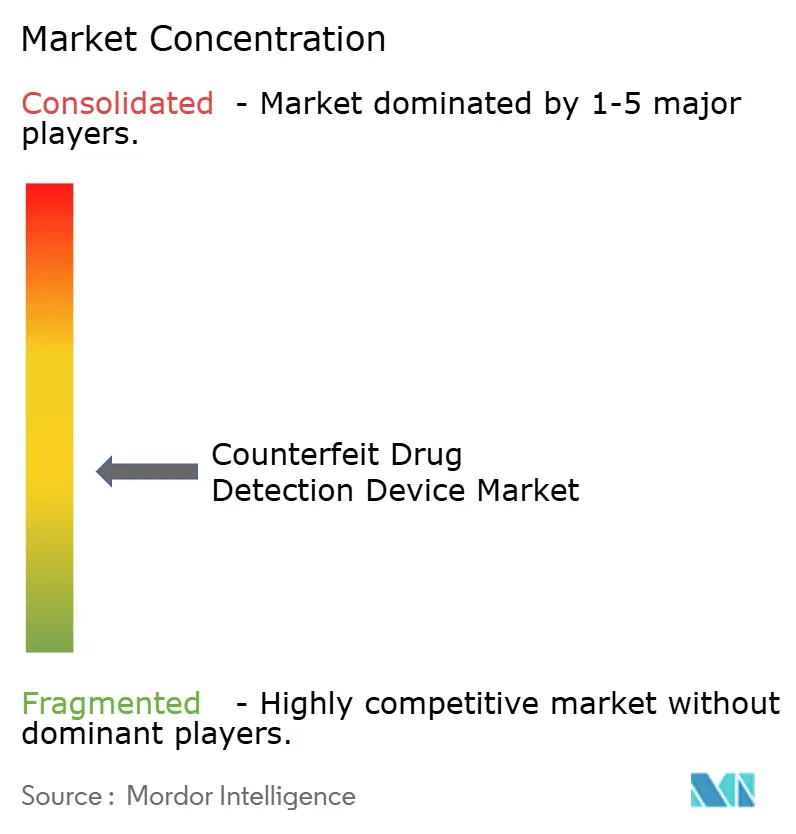
The counterfeit drug detection device market supports a moderately fragmented roster. Thermo Fisher Scientific, Agilent Technologies, and Bruker Corporation dominate high-end laboratory Raman platforms through robust service networks and bundled chemometric suites. Their combined revenue share across optical modalities remains under 35%, leaving ample territory for specialists. B&W Tek and Rigaku concentrate on ultra-portable Raman and handheld XRF hybrids, pitching to border control and field epidemiology teams. Strategic acquisitions accelerate scale: Bruker absorbed Sierra Sensors to integrate plasmonic chips, while Waters bought Wyatt Technology to inject light-scattering analytics into authenticity workflows.
AI-centric newcomers such as TrueMed and AlpVision deliver software-only authenticity layers that harness smartphone optics or camera feeds, courting consumer health brands seeking cost-efficient solutions. Hardware incumbents reply by opening APIs, enabling third-party AI engines to mine spectral data. Blockchain consortia like MediLedger partner with device makers to automate consensus checks at every scan. Price competition intensifies in the mid-tier handheld bracket as Taiwanese OEMs leverage MEMS production clusters to undercut Western rivals by 15-20%.
Patenting activity gravitates toward nanostructured SERS substrates and federated-learning spectroscopic AI, with 210 global applications filed in 2024 alone. Cross-licensing agreements proliferate; Agilent, for instance, grants use of its polymer-based nano-pillars to a German start-up in exchange for proprietary clustering algorithms. As end-users favor holistic platforms over single-purpose devices, the field edges toward ecosystem competition rather than point-product rivalry.
Counterfeit Drug Detection Device Industry Leaders
Bayer AG
GAO Group
Systech International
Spectral Engines Oy
Thermo Fisher Scientific Inc.
- *Disclaimer: Major Players sorted in no particular order

Market Opportunities and Future Outlook
A clear whitespace sits at the intersection of digital traceability compliance and frontline chemical verification. DSCSA requirements in the United States emphasize electronic, interoperable package-level tracing, commonly implemented using GS1 standards such as EPCIS for data exchange and a GS1-compliant DataMatrix-based identifier on packs. This creates an integration pull for counterfeit detection devices that can pair spectroscopic results with serialized event data. Device vendors that provide connectors and workflows aligned to trading-partner data exchange, and that support rapid exception handling and documentation for suspected illegitimate product determinations, can compete for budgets already being mobilized for DSCSA readiness.
Another opportunity is in deployments where authentication must be performed without disrupting operations, including pharmacy receipt verification, 3PL handling, and CMO/CPO rework environments. The November 27, 2026 DSCSA deadline for small dispensers concentrates demand for practical, low-burden verification workflows, including combinations of packaging-level checks with on-dosage or field spectroscopy for risk-based secondary confirmation. WHO-authentication-technology guidance covering physical chemical identifiers and field-based spectroscopy also supports uptake in markets building regulatory capacity, especially where procurement programs prioritize tools that function in constrained settings while still producing defensible evidence for enforcement and quality surveillance.
Recent Industry Developments
- July 2026: The European Commission updated its Q&A guidance on safety features for medicinal products for human use (version 22). The update sharpened operational interpretation of Falsified Medicines Directive requirements, encouraging supply-chain participants to tighten verification workflows and documentation that can be supported by integrated authentication tools.
- February 2025: Systech launched UniSecure artAI, a cloud-based authentication capability that uses AI to create digital blueprints from existing packaging artwork for verification. The launch expanded non-invasive approaches to counterfeit screening and reinforced the market shift toward software-led authentication layers that complement device-based inspection.
- March 2024: Systech acquired Pharmacontrol Electronic GmbH (PCE) and established a European headquarters in Heppenheim, Germany. The acquisition expanded track-and-trace and packaging-line execution capabilities in Europe, strengthening regional support for regulated serialization and aggregation workflows that tie into anti-counterfeiting programs.


Research Methodology Framework and Report Scope
Market Definition and Coverage
For this study, the counterfeit drug detection device market covers revenue from equipment used to check medicine authenticity and quality, including field screening tools and lab-grade analyzers used across the pharma supply chain.
Scope exclusions: The sizing excludes consumable test strips, standalone packaging materials, and track-and-trace software licenses unless they are bundled into the device sale price.
Segmentation Overview
- By Technology
- Infrared & Near-Infrared Spectroscopy
- Raman Spectroscopy
- Surface-Enhanced Raman (SERS)
- Microfluidic Lab-on-Chip
- Rapid Chemical Testing Kits
- RFID / Blockchain Tagging
- Other Emerging Technologies
- By Modality
- Handheld Devices
- Benchtop Devices
- Portable/Back-pack Systems
- By Application
- Chemical-Composition Verification
- Packaging & Labelling Authentication
- Mixed-Dosage Analysis
- By End User
- Pharmaceutical Manufacturers
- Drug Testing Laboratories
- Other End Users
- By Geography
- North America
- United States
- Canada
- Mexico
- Europe
- Germany
- United Kingdom
- France
- Italy
- Spain
- Rest of Europe
- Asia-Pacific
- China
- Japan
- India
- Australia
- South Korea
- Rest of Asia-Pacific
- Middle East & Africa
- GCC
- South Africa
- Rest of Middle East & Africa
- South America
- Brazil
- Argentina
- Rest of South America
- North America
Data Sources, Market Sizing, and Validation
Desk Research
Desk work sets the guardrails for the model by clarifying what qualifies as a detection device, how it is purchased, and where demand is coming from. We reviewed public health and safety references such as WHO alerts and reports, plus enforcement and quality signals from agencies such as the FDA and customs authorities that publish seizures and compliance actions.
To keep assumptions grounded, we also checked open sources that connect to device adoption, such as GS1 standards materials on identification and verification, United Nations trade statistics for broader instrument trade trends, and peer-reviewed journal articles describing spectroscopy and screening use in medicines. On the commercial side, annual reports, investor presentations, product brochures, and reputable news helped us map pricing tiers and typical buying cycles. Paid subscriptions were used selectively for company financials and for patent tracking to understand where device capability is moving. The sources listed here are illustrative, and many other public and paid references were used for data collection, validation, and clarification.
Primary Interviews and Surveys
Primary conversations were used to verify what gets counted as device revenue, and to test adoption patterns across manufacturers, distributors, pharmacies, hospitals, and public labs. Expert input also helped us sanity-check regional differences, especially where regulatory enforcement intensity and import exposure tend to change how quickly buyers move from evaluation to procurement.
Distribution of primary research fieldwork respondents
| Company type | Respondent position | Region |
|---|---|---|
| Top tier: 34% | CXOs: 12% | APAC: 43% |
| Mid tier: 52% | Functional/Unit leaders: 41% | EMEA: 36% |
| Smaller Players: 14% | Managers: 47% | Americas: 21% |
Market-Sizing & Forecasting
The sizing starts with a top-down build that reconstructs demand from the inspection and verification workload across the supply chain, then filters for how often on-site screening is used versus lab confirmation. We translate that demand pool into spend using typical device placement patterns across end users, supported by average selling price bands by modality, such as handheld screening versus benchtop analytical tools.
Key inputs that shape the model include the intensity of anti-counterfeit enforcement actions, cross-border medicine flows, the mix shift toward portable screening in field settings, replacement cycles linked to calibration and service needs, and procurement lead times in public health systems. Where data points were patchy, gaps were handled with conservative ranges, then narrowed through interview checks on placement rates and observed price movements.
For the forecast, scenario analysis is used so growth is not driven by a single assumption. The scenarios were anchored on expected policy enforcement momentum, device cost trends, and adoption in high-risk channels, then adjusted after expert review to keep the path realistic year by year. A selective bottom-up approximation was also used, sampling ASP x estimated unit volumes and cross-checking channels, to corroborate totals and refine outliers without turning the whole model into a full supplier roll-up.
Data Validation & Update Cycle
Model outputs are checked against independent signals such as import risk indicators, public recall and seizure patterns, and observable procurement activity, then the assumptions behind any sharp jumps are revisited. If a region shows an unusual swing, we re-check currency timing, pricing bands, and whether the device type boundary was applied consistently across end users.
Before sign-off, the work goes through multi-step internal reviews where calculations, definitions, and year-to-year bridges are re-tested, and open questions are pushed into follow-up expert calls when needed. Reports are refreshed annually, and interim updates are made when material events occur, such as major regulatory deadlines or meaningful technology shifts. Right before delivery, an analyst performs a fresh pass so clients receive the latest updated view.
Mordor Intelligence's Counterfeit Drug Detection Device Market Size Measured Against Other Published Estimates
Published values for this market can differ more than buyers expect because the device boundary is not handled the same way, and because some studies rely on different growth assumptions around enforcement and adoption. The starting year also matters since pricing and currency timing can shift reported revenue even when unit demand looks stable.
Public seizure and recall signals, alongside interview checks on device placements across pharmacies, hospitals, and labs, are used to keep Mordor Intelligence's 2026 estimate tied to the actual verification workload rather than a broader anti-counterfeiting spend bucket. Differences usually come from whether consumables are counted as device revenue, whether packaging authentication tools are included, and whether the model assumes aggressive ASP uplift that is still matched to modality mix and replacement cycles.
Benchmark comparison
| Source | Market Size | Gaps in Research Methodology |
|---|---|---|
| Mordor Intelligence | USD 1.63 B (2026) | |
| Industry Publisher A | USD 1.74 B (2025) | Uses a 2025 base and commonly bundles adjacent detection-related items, with less clarity on separating device revenue from ongoing consumables and services, which can push the starting value upward. |
| Industry Publisher B | USD 1.20 B (2025) | Applies a narrower spend lens and a longer forecast horizon, and the lower 2025 value is consistent with more conservative adoption and price progression assumptions that are not tightly linked to end-user placement checks. |
The spread in the table is mostly explained by boundary choices and how pricing and adoption are carried forward from the base year. By keeping device-only revenue rules consistent and validating assumptions with observable risk signals and end-user placement feedback, the final number stays traceable to clear inputs and repeatable steps.


Key Questions Answered in the Report
What is the projected value of the counterfeit drug detection device market in 2031?
The market is forecast to reach USD 2.21 billion by 2031, reflecting a 6.30% CAGR from 2026.
Which technology is growing fastest for on-site drug authentication?
Surface-Enhanced Raman Spectroscopy (SERS) leads with a projected 8.94% CAGR through 2031 due to its sub-ppm sensitivity.
Why is Asia Pacific posting the highest growth rate?
Regulatory reforms in China and India that mandate serialization and QR codes are accelerating device adoption, yielding a 9.33% regional CAGR.
How are AI capabilities influencing device choices?
AI-driven chemometrics enable real-time spectral interpretation, expanding use of portable systems in field settings and reducing operator dependency.
What factors restrain adoption among small dispensers?
High upfront costs and extended laser-safety compliance requirements delay purchases, particularly in resource-limited settings.
Which end-user segment will grow quickest by 2031?
Independent drug-testing laboratories, buoyed by outsourcing trends, are projected to advance at a 7.29% CAGR.
Page last updated on:


 Your data is secure and never sold or shared.


