
Counter Cyberterrorism Market Size and Share
Market Overview
| Study Period | 2020 - 2031 |
|---|---|
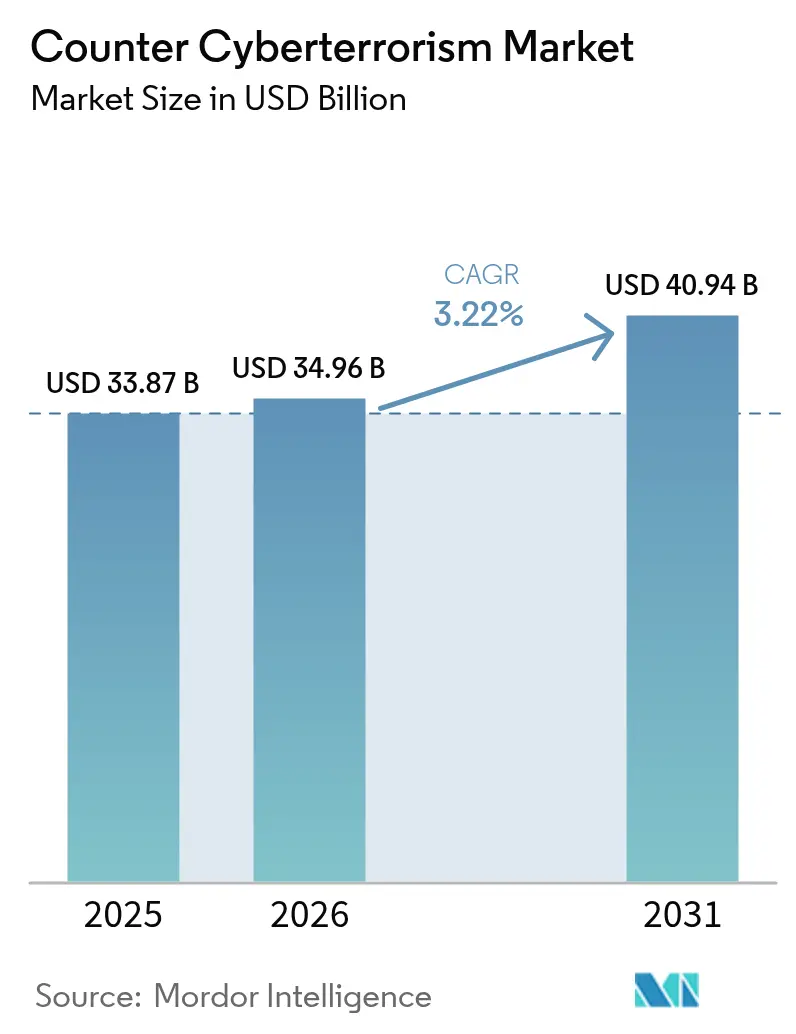
| Market Size (2026) | USD 34.96 Billion |
| Market Size (2031) | USD 40.94 Billion |
| Growth Rate (2026 - 2031) | 3.22 % |
| Fastest Growing Market | Asia-Pacific |
| Largest Market | North America |
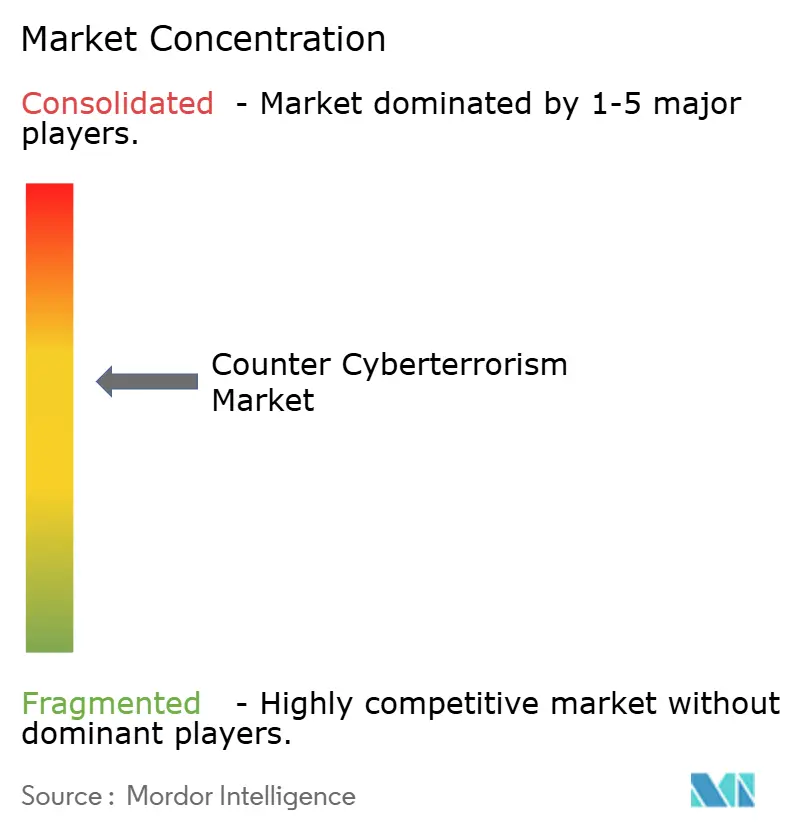
| Market Concentration | Medium |
Major Players *Disclaimer: Major Players sorted in no particular order Image © Mordor Intelligence. Reuse requires attribution under CC BY 4.0. | |
Counter Cyberterrorism Market Analysis by Mordor Intelligence
The counter cyberterrorism market size was valued at USD 33.87 billion in 2025 and estimated to grow from USD 34.96 billion in 2026 to reach USD 40.94 billion by 2031, at a CAGR of 3.22% during the forecast period (2026-2031). Rising government allocations, escalating nation-state offensives, and wider adoption of AI-enabled security tools underpin this moderate but steady expansion. Federal programs such as the United States’ USD 27.5 billion cybersecurity budget and the Pentagon’s USD 14.5 billion cyber request demonstrate the scale of public-sector demand.[1] Growing defense-grade spending combines with corporate pivots from perimeter controls to threat-intelligence ecosystems, while cloud migration sustains demand for flexible deployment models. Vendor consolidation 362 cybersecurity deals worth USD 49.9 billion in 2024 also influences growth trajectories by bundling formerly discrete capabilities under integrated platforms.[2]
Key Report Takeaways
- By solution type, network security led with 27.10% of the counter cyberterrorism market share in 2025, whereas AI-driven security is projected to expand at a 22.80% CAGR through 2031.
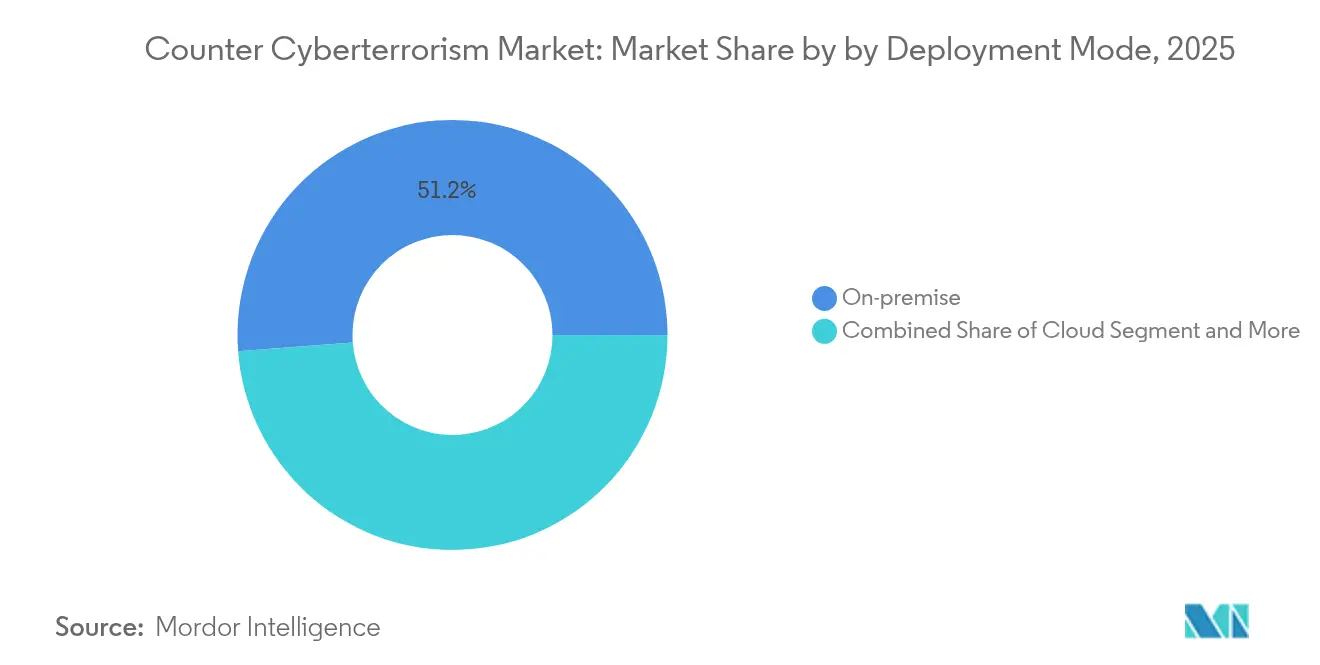
- By deployment mode, on-premise led with 51.20% of the counter cyberterrorism market share in 2025, whereas the cloud segment is projected to expand at a 13.20% CAGR through 2031.
- By security layer, network led with 29.55% of the counter cyberterrorism market share in 2025, whereas the data/cloud segment is projected to expand at an 17.80% CAGR through 2031.
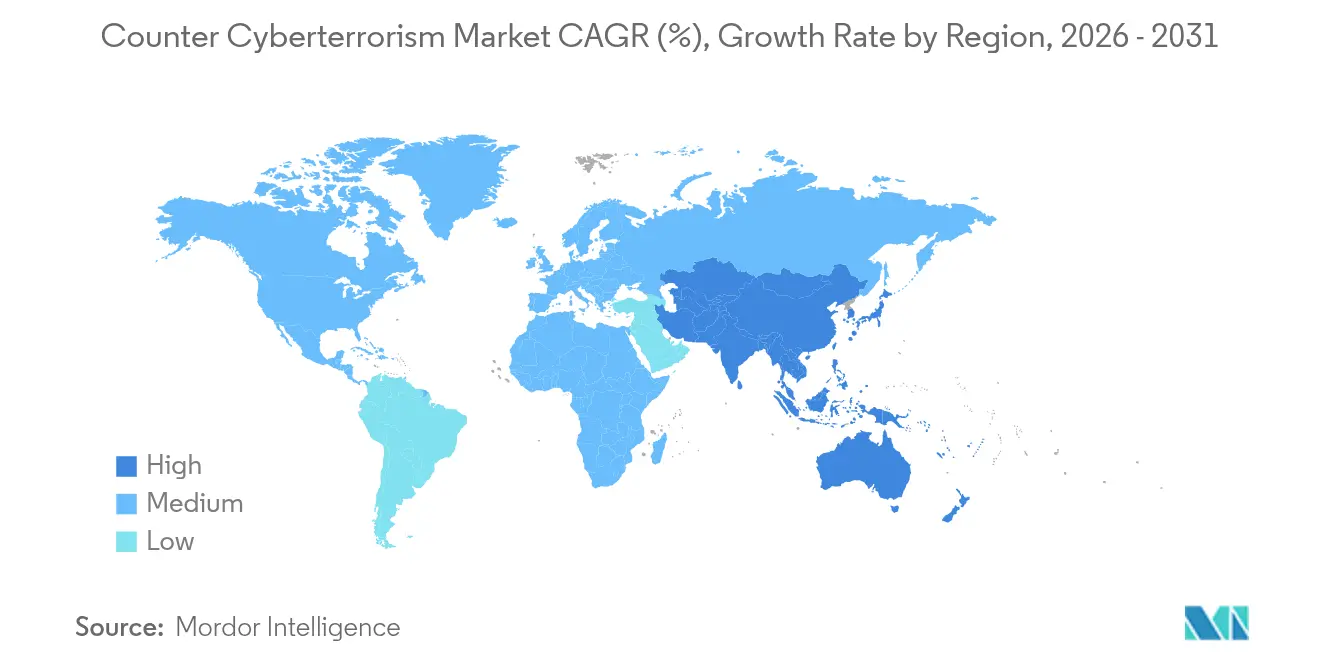
- By geography, North America commanded 34.80% revenue share of the counter cyberterrorism market size in 2025, while Asia-Pacific is advancing at a 13.95% CAGR to 2031.
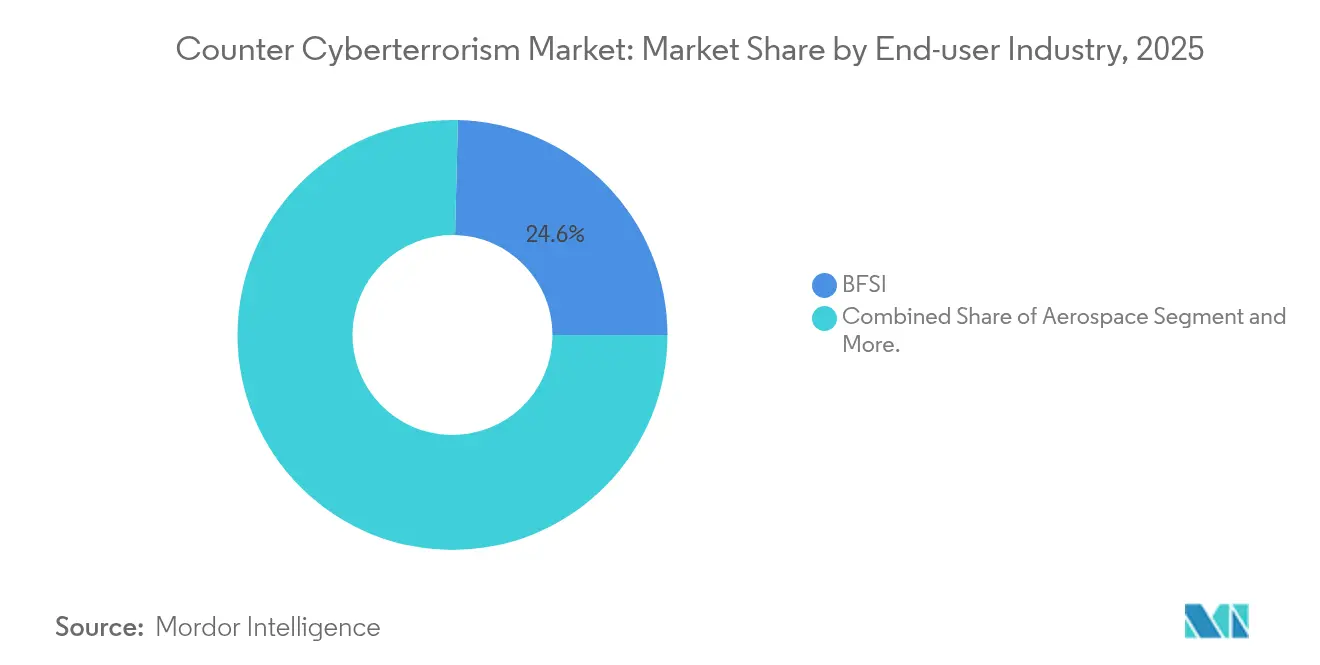
- By end-user, BFSI held 24.60% of the counter cyberterrorism market size in 2025; healthcare is accelerating at an 17.20% CAGR through 2031.
Note: Market size and forecast figures in this report are generated using Mordor Intelligence’s proprietary estimation framework, updated with the latest available data and insights as of 2026.
Market Trends and Insights
Drivers Impact Analysis of Counter Cyberterrorism Market*
| Driver | (~) % Impact on CAGR Forecast | Geographic Relevance | Impact Timeline |
|---|---|---|---|
| Growing nation-state cyber offensives | +0.8% | Global, with concentration in North America and Europe | Medium term (2-4 years) |
| AI-enabled threat detection adoption | +1.2% | Global, led by North America and APAC | Short term (≤ 2 years) |
| Expansion of 5G/IIoT attack surface | +0.6% | APAC core, spill-over to North America and Europe | Long term (≥ 4 years) |
| Rise of Cybersecurity-as-a-Service (C-aa-S) | +0.9% | Global, with early adoption in North America | Medium term (2-4 years) |
| Escalating regulatory fines on data breaches | +0.7% | Europe and North America, expanding to APAC | Short term (≤ 2 years) |
| Real-time dark-web threat-intel exchanges | +0.5% | Global, concentrated in developed markets | Medium term (2-4 years) |
| Source: Mordor Intelligence | |||
Growing Nation-State Cyber Offensives Drive Defense Modernization
Persistent state-backed campaigns now target critical infrastructure and democratic processes with multi-vector tactics. The Pentagon earmarked USD 3.1 billion for zero-trust and next-generation encryption in its 2025 cyber budget, anchoring moves from incident response to active threat-hunting.[3]U.S. Cyber Command’s USD 1.7 billion appropriation further prioritizes counteroffensive readiness and multi-domain coordination.[4]Such high-level focus incentivizes platform vendors to embed attribution, forensics, and automation features that satisfy national-security procurement criteria.
AI-Enabled Threat Detection Transforms Security Operations
Production-scale AI now shapes security operating centers as average breakout times shrink to 62 minutes. CrowdStrike-NVIDIA tests halve processing loads while doubling detection speeds, easing analyst fatigue. Adaptive models ingest endpoint, network, and cloud telemetry to predict adversary behavior, yet 40% of analyst hours still chase false positives. Vendors thus refine generative-AI enrichment and context-aware prioritization to boost signal-to-noise ratios and maximize limited human expertise.
Expansion of 5G/IIoT Attack Surface Creates New Vulnerabilities
Industrial 5G rollouts interconnect operational-technology assets once isolated from IT networks. Forty-five OT product families carry embedded flaws, exposing critical utilities to lateral-movement exploits. As quantum threats loom, NIST prioritizes post-quantum cryptography to safeguard 5G backbone encryption, accelerating market demand for data-layer protections and zero-trust segmentation even in legacy industrial environments.
Rise of Cybersecurity-as-a-Service Reshapes Market Dynamics
Managed security platforms democratize enterprise-grade defense for resource-constrained organizations. CrowdStrike’s USD 1 billion AWS Marketplace milestone highlights SaaS viability and price elasticity for scalable threat-hunting services. Providers leverage multi-tenant data lakes and AI correlation across clients, reducing per-tenant costs while elevating detection accuracy, a compelling value proposition amid the 4.8 million-person global skills gap.
Restraints Impact Analysis of Counter Cyberterrorism Market*
| Restraint | (~) % Impact on CAGR Forecast | Geographic Relevance | Impact Timeline |
|---|---|---|---|
| Shortage of tier-1 cyber warfare talent | -0.9% | Global, most acute in North America and Europe | Long term (≥ 4 years) |
| Inter-agency data-sharing silos | -0.4% | North America and Europe, emerging in APAC | Medium term (2-4 years) |
| Legacy OT systems with proprietary protocols | -0.6% | Global, concentrated in industrial regions | Long term (≥ 4 years) |
| High false-positive rates in ML models | -0.3% | Global, affecting early AI adopters | Short term (≤ 2 years) |
| Source: Mordor Intelligence | |||
Shortage of Tier-1 Cyber Warfare Talent Constrains Growth
The U.S. alone posts 663,000 unfilled roles, inflating wage premiums and throttling project rollouts. With advanced skills requiring 5-7 years of experiential learning, enterprises pivot to automation and MSSP partnerships to bridge gaps, reinforcing demand for C-aa-S offerings over in-house builds.
Classification barriers and incompatible formats undermine real-time collaboration despite programs like CISA’s USD 470 million Continuous Diagnostics and Mitigation initiative. Private firms often hold fresher threat data yet hesitate to exchange insights, stalling holistic situational awareness and dulling collective defense posture.
*Our forecasts treat driver/restraint impacts as directional, not additive. The impact forecasts reflect baseline growth, mix effects, and variable interactions.
Counter Cyberterrorism Market Segment Analysis
By End-User Industry:
Healthcare Accelerates Defensive SpendHealthcare’s 17.20% CAGR through 2031 outpaces all sectors, even as BFSI retains the largest slice of the counter cyberterrorism market share in 2025. Daily incident losses reached USD 2 million, and 92% of providers reported targeted attacks, pushing hospitals to adopt zero-trust and managed detection despite budget constraints. Government grants worth USD 800 million help low-resourced facilities modernize defenses. BFSI maintains robust controls driven by regulatory audits and high-value data, while defense-aerospace budgets anchor classified-system requirements.
Rising ransomware premiums and patient-safety implications move boards to treat cybersecurity as enterprise risk, not IT overhead. Overlapping IoT medical devices and legacy electronic-health-record systems add complexity, reinforcing integration demand for AI-driven anomaly detection. Across sectors, the counter cyberterrorism market supports bespoke service tiers that map vertical regulations, demonstrating why industry-aligned MSSPs capture expanding wallet share.

By Solution Type:
AI-Driven Innovation Outpaces Traditional SecurityNetwork security tools hold 27.10% of the counter cyberterrorism market size; yet predictive AI solutions registering a 22.80% CAGR signal a strategic tilt from perimeter hardening to behavior analytics. Endpoint suites remain indispensable as remote work persists, and cloud security surges alongside multi-cloud adoption. Data-centric controls grow amid stricter privacy mandates, while identity platforms evolve continuous-auth models assessing both user intent and device posture.
Software-supply-chain attacks elevate application-security budgets, spurring demand for SBOM validation and DevSecOps automation. Vendors fuse threat-intel feeds with zero-trust orchestration, creating unified consoles that slash tool sprawl an attractive proposition as procurement favors platform breadth over point-solution depth.
By Deployment Mode:
Cloud Gains Even as On-Premise DominatesOn-premise installations still account for 51.20% of the counter cyberterrorism market size due to sovereignty mandates and cultural trust in owned infrastructure. Yet cloud deployments are climbing at 13.20% CAGR, buoyed by the scalability of SaaS threat-intel engines. Hybrid models serve risk-averse enterprises that keep crown-jewel assets local while leveraging cloud analytics for less sensitive workloads.
Integration alliances such as CrowdStrike with Google Cloud secure workloads across multicloud estates, addressing a 75% spike in cloud intrusions. Regulatory frameworks increasingly codify encryption and logging standards rather than dictating location, easing adoption barriers and pushing procurement toward OPEX-friendly subscriptions.
By Security Layer:
Data Protection Becomes Core ObjectiveNetwork-layer controls deliver 29.55% revenue but data-layer security is the fastest climber at 17.80% CAGR, reflecting acceptance that attackers often pierce perimeters. NIST’s quantum-resistant guidelines spur cryptography refresh cycles, and boards earmark funding for classification, tokenization, and immutable backups. Endpoint-layer investments persist as device sprawl and remote work expand attack surfaces, while application-layer defenses gain priority to blunt software-supply-chain exploits.
Organizations converge around data-centric frameworks that monitor assets regardless of hosting environment, reinforcing demand for encryption-key orchestration and real-time data-loss-prevention engines. Vendors differentiate via ease of integration and policy automation, advancing competitive friction from signature depth to orchestration breadth.
Geography Analysis
North America Counter Cyberterrorism Market
North America anchors 34.80% of the counter cyberterrorism market size, driven by the U.S. federal USD 27.5 billion cybersecurity allocation and USD 30 billion annual military cyber outlays. Canada cooperates through the U.S.–Canada Cyber Action Plan, and Mexico accelerates critical-infrastructure safeguards under trilateral frameworks. Mature compliance regimes such as CMMC and GLBA push enterprises toward continuous threat monitoring, sustaining platform renewals across sectors.
APAC Counter Cyberterrorism Market
Asia-Pacific records the fastest 13.95% CAGR as governments respond to a 16% jump in weekly attacks and 50% growth in cyber-insurance uptake. China’s Data Security Law and India’s CERT-IN mandates expand mandatory reporting, while Japan funds USD 6 billion for industrial cyber-fortification. Australia’s 2025–2030 Cyber Strategy emphasizes sovereign capability development, amplifying MSSP demand across mid-market enterprises.
Europe Counter Cyberterrorism Market
Europe holds a steady share under GDPR-driven accountability measures that levied EUR 1.2 billion in 2024 fines. The EU’s coordinated post-quantum roadmap catalyzes member-state grants for cryptographic retrofits, benefiting platform vendors offering hybrid encryption. The U.K.’s National Cyber Force merges offense-defense mandates, France accelerates SecNumCloud certifications, and Germany’s KRITIS-Dachgesetz expands critical-infrastructure scope, stimulating integrated-security procurement.
Regulatory Landscape
Counter-cyberterrorism requirements continue to be shaped by overlapping national security, critical-infrastructure, and data-protection regimes, alongside international standard-setting. In 2024, the UN General Assembly adopted the International Convention against the Criminal Use of Information Technologies, reinforcing cross-border cooperation and criminalization approaches that affect incident handling, evidence preservation, and requests for assistance in cyberterrorism-linked cases.
In the United States, National Security Memorandum 22 (April 30, 2024) elevated critical-infrastructure coordination by designating the CISA Director as National Coordinator for Security and Resilience of Critical Infrastructure. Legislative activity such as H.R. 2659 (119th Congress) also points to continued focus on interagency tasking against state-sponsored cyber threats. On the standards side, ISO/IEC 27001:2022 remains a global baseline for information security management, while ITU-T Study Group 17 maintains the ICT Security Standards Roadmap, together anchoring procurement checklists for audits, third-party assurance, and cross-border operations.
Value Chain Analysis
The counter cyberterrorism value chain spans upstream secure hardware and cryptography inputs, core software platforms (endpoint, network, identity, SIEM/SOAR/XDR, threat intelligence), and downstream deployment and operations through system integrators, MSSPs, and government/defense contractors. Critical dependencies include trusted compute and cryptographic components, secure software development practices (including SBOM-oriented assurance), and compliant cloud infrastructure for scalable analytics. Procurement increasingly favors integrated platforms that consolidate telemetry and response under unified operating models.
Regulatory and sectoral initiatives are tightening supply-chain expectations for critical infrastructure operators and their vendors. In Europe, the EU Cyber Solidarity Act (Regulation (EU) 2025/38) establishes a European Cybersecurity Alert System with National and Cross-Border Cyber Hubs, pulling more providers into shared detection and situational awareness workflows. In North America, power-sector supply-chain governance is being refreshed through NERC CIP-013-4 (formally posted in April 2026), which updates security controls for supply chain risk management for Bulk Electric System cyber assets and raises the bar for vendor due diligence, monitoring, and contractual security clauses across the ecosystem.
Competitive Landscape
Moderate consolidation defines the counter cyberterrorism market as leading suites integrate endpoint, network, and identity functions. CrowdStrike, Palo Alto Networks, Microsoft, and Cisco leverage scale, data-lake breadth, and AI pipelines to sustain double-digit product growth. Platform stickiness deepens as customers prioritize unified telemetry and automated response to combat analyst scarcity.
Acquisition momentum remained high with 362 deals in 2024; for example, Palo Alto’s buyout of cloud-security specialist Cider Security and Cisco’s takeover of Splunk closed Q1 2025, illustrating moves to fuse SIEM, SOAR, and XDR into cohesive fabrics. Partnerships eclipse one-off integrations: Zscaler–CrowdStrike Zero-Trust tie-ups enable shared risk scoring and policy orchestration, while Fortinet alliance plugs endpoint insight into next-gen firewalls for lateral-movement containment.
White-space remains in quantum-safe cryptography, where adoption sits near 0.03% despite NIST draft standards. Niche vendors exploit this gap with lattice-based key exchange plug-ins, while generative-AI innovators craft context-aware phishing-detection models. Competitive differentiation thus hinges on AI-model fidelity, integration openness, and time-to-value rather than feature checklists.
Counter Cyberterrorism Industry Leaders
-
Palo Alto Networks
-
Cisco Systems, Inc.
-
Microsoft Corporation
-
Fortinet, Inc.
-
CrowdStrike Holdings, Inc.
- *Disclaimer: Major Players sorted in no particular order
Counter Cyberterrorism Market Companies Covered in this Report
- Palo Alto Networks, Inc.
- Cisco Systems, Inc.
- Microsoft Corporation
- Fortinet, Inc.
- International Business Machines Corporation
- AO Kaspersky Lab
- Dell Technologies Inc.
- DXC Technology Company
- International Intelligence Limited
- Nexusguard Limited
- Leidos Holdings, Inc.
- Raytheon Technologies Corporation
- Broadcom Inc. (Symantec Enterprise)
- SAP SE
- CrowdStrike Holdings, Inc.
- Check Point Software Technologies Ltd.
- Okta, Inc.
- Zscaler, Inc.
- Cloudflare, Inc.
- Trend Micro Incorporated
- BAE Systems plc
- Booz Allen Hamilton Holding Corporation
Market Opportunities and Future Outlook
Active government programs are expanding whitespace around coordinated vulnerability response, critical-infrastructure OT security, and procurement-linked resilience requirements. In July 2026, the White House announced the Gold Eagle initiative (under Executive Order 14409 dated June 2, 2026) to coordinate cybersecurity vulnerability response across federal entities and private-sector infrastructure partners. This expands demand for capabilities that operationalize vulnerability intake, prioritization, coordinated disclosure, and rapid mitigation across complex supplier networks.
Critical infrastructure operators are also formalizing roadmaps that translate into spend on identity hardening, segmentation, and monitored access paths into OT environments. NERCs January 2026 CIP Roadmap prioritized standards modifications around mandatory multi-factor authentication and expanded network security tied to public telecommunications infrastructure dependencies. This supports opportunities for vendors that can deliver MFA in constrained environments, jump-server governance, passive monitoring, and IT/OT boundary controls. At the same time, investor diligence in digital and telecom infrastructure increasingly treats cyber risk as a gating factor (76% citing it as a primary influence in a recent survey), creating room for security providers that package assessment, continuous monitoring, and remediation programs aligned to deal cycles and post-close integration.
Recent Industry Developments in Counter Cyberterrorism Market
- June 2026: Palo Alto Networks and Deutsche Telekom announced an AI-driven security collaboration with sovereignty controls aimed at European regulated industries. The partnership ties platform capabilities to data residency and regulated-sector operating requirements, supporting adoption where compliance and localization constraints shape security architecture decisions.
- May 2026: Microsoft was awarded a USD 9.7 billion Pentagon contract focused on enterprise software license consolidation. The deal reinforces large-scale government demand for standardized security baselines and centralized management across sprawling environments, influencing adjacent requirements for identity, monitoring, and secure configuration at scale.
- August 2024: Cisco announced its intent to acquire Robust Intelligence to strengthen AI security capabilities. The transaction signal highlighted growing emphasis on securing AI models and pipelines, aligning security portfolios with emerging risks from AI-enabled workflows and automated decision systems.
Counter Cyberterrorism Market Report Scope and Research Methodology
Market Definition and Coverage
For this methodology, the counter cyberterrorism market is defined as spending on technologies and services used to prevent, detect, analyze, and respond to cyber attacks linked to terrorism and national security threats across public and private critical functions.
Scope exclusions: We exclude general-purpose IT security purchases that are not tied to cyberterrorism-driven use cases or programs.
Segments Covered in This Report
- By End-user Industry
- Defense
- Aerospace
- BFSI
- Corporate/Enterprise
- Power and Utilities
- Government and Intelligence Agencies
- Healthcare
- By Solution Type
- Network Security Solutions
- Endpoint Security Solutions
- Cloud Security Solutions
- Application Security
- Data and Database Security
- Identity and Access Management
- Threat Intelligence and MSSP
- By Deployment Mode
- On-premise
- Cloud
- Hybrid
- Managed / Hosted
- By Security Layer
- Network Layer
- Endpoint Layer
- Application Layer
- Data / Cloud Layer
- By Geography
- North America
- United States
- Canada
- Mexico
- South America
- Brazil
- Argentina
- Rest of South America
- Europe
- Germany
- United Kingdom
- France
- Italy
- Spain
- Russia
- Rest of Europe
- Asia-Pacific
- China
- Japan
- India
- South Korea
- Rest of Asia-Pacific
- Middle East and Africa
- Middle East
- Saudi Arabia
- United Arab Emirates
- Turkey
- Israel
- Rest of Middle East
- Africa
- South Africa
- Nigeria
- Rest of Africa
- Middle East
- North America
Data Sources, Market Sizing, and Validation
Desk Research
Desk research started by building a clear picture of demand signals and public sector priorities linked to cyberterrorism risk. We used open, reputable sources such as CISA advisories, NIST cybersecurity publications, FBI IC3 annual reports, and the ITU Global Cybersecurity Index, and then cross-checked themes using defense and interior ministry releases in major economies.
To make the model usable, we also reviewed vendor public filings, investor presentations, and trusted press to understand solution mix and typical buying motions across government, defense, BFSI, and critical infrastructure. In a few places, paid subscriptions for company financials and patent databases were used to fill gaps around product positioning and innovation intensity, which helped keep assumptions grounded. The sources listed above are illustrative, and many other public references were also used for data collection, validation, and clarification.
Primary Interviews and Surveys
Primary work focused on speaking with security leaders, program owners, and delivery teams who see counter-cyberterrorism budgets and deployment realities firsthand. We used these discussions to confirm what buyers consider in-scope, how cloud versus on-premise choices are changing, and what parts of spend sit inside broader cybersecurity programs.
Coverage included viewpoints across APAC, EMEA, and the Americas so regional procurement patterns and threat priorities could be checked before finalizing sizing assumptions.
Distribution of primary research fieldwork respondents
| Company type | Respondent position | Region |
|---|---|---|
| Top tier: 30% | CXOs: 22% | APAC: 51% |
| Mid tier: 48% | Functional/Unit leaders: 29% | EMEA: 30% |
| Smaller Players: 22% | Managers: 49% | Americas: 19% |
Market-Sizing & Forecasting
Sizing was built using a top-down approach where public cyber incident signals, critical infrastructure exposure, and government security priorities were converted into an addressable spend pool by region and end user, and then allocated across solution and deployment patterns. The results were then checked using selective bottom-up approximations, such as sampled vendor revenue exposure to relevant programs and average contract value checks shared in interviews, and totals were adjusted when the two views did not line up.
Inputs used in the model included observed ransomware and intrusion activity trends, reported breach and complaint volumes, cloud migration pace in sensitive environments, regulatory and standards adoption (for example, frameworks used in public sector procurement), and the share of security budgets typically earmarked for threat intelligence, monitoring, and incident response. When data was missing in smaller countries, assumptions were bridged using peer market proxies based on digitalization level and public sector spend intensity, and then validated with regional experts.
For forecasting, scenario analysis was applied around threat escalation and procurement cycles, and the final curve was smoothed using time-series trend checks so step-changes only appeared when policy or funding shifts were confirmed through interviews.
Data Validation & Update Cycle
Model outputs were compared against independent signals such as public threat reporting, budget direction indicators, and the implied spend per protected asset group, which helped flag outliers early. Any large variance by region or end user triggered a second review, followed by a re-check of assumptions like adoption timing and pricing progression.
Before sign-off, the work goes through multi-step analyst reviews so calculation logic, unit consistency, and currency handling are verified. Reports are refreshed annually, and interim updates are made when material events occur, such as major regulatory moves or step-changes in cyber incident patterns. Right before delivery, we complete a fresh pass to ensure clients receive the latest updated view.
Mordor Intelligence's Counter Cyberterrorism Trends Challenges Market Size Measured Against Other Published Estimates
Published market sizes for counter cyberterrorism can look far apart because the boundary between specialized counter-terror programs and broader cybersecurity spend is not drawn the same way. Differences also come from the base year chosen, the time window used for forecasts, and how quickly pricing and adoption are assumed to change.
Breach and threat reporting trends, plus buyer feedback on what is funded as a counter-terror requirement, are the checks that keep Mordor Intelligence tied to a defined spend pool rather than the full cybersecurity stack.
Benchmark comparison
| Source | Market Size | Gaps in Research Methodology |
|---|---|---|
| Mordor Intelligence | USD 34.96 B (2026) | |
| Global Research Publisher A | USD 12.40 B (2024) | Uses an earlier base year and a narrower interpretation centered on critical infrastructure and essential services programs, which can exclude broader enterprise spend tied to counter-cyberterrorism mandates. |
| Market Dataset B | USD 36.20 B (2026) | Keeps a similar base-year level but extends the forecast window to 2034 and applies different inclusion rules around specialized hardware and service bundles, which can shift totals depending on how bundled deals are counted. |
Across the table, the spread is mainly explained by what gets counted as counter-cyberterrorism versus general cybersecurity, and by the choice of base year and forecast horizon. When scope boundaries are kept consistent and assumptions are repeatedly checked with observable threat signals and buyer workflows, the final number becomes easier to trace and reproduce.
Key Questions Answered in the Report
What is the current value of the counter-cyberterrorism market?
The counter cyberterrorism market size is USD 34.96 billion in 2026.
How fast is the sector expected to grow over the next five years?
It is forecast to expand at a 3.22% CAGR, reaching USD 40.94 billion by 2031.
Which geographic region is expanding the quickest?
Asia-Pacific leads with a projected 13.95% CAGR through 2031.
Which solution type is seeing the highest growth rate?
AI-driven security solutions are advancing at a 22.80% CAGR through 2031.