
Cosmetic Peptide Synthesis Market Size and Share
Market Overview
| Study Period | 2020 - 2031 |
|---|---|
| Market Size (2026) | USD 259.63 Million |
| Market Size (2031) | USD 337.09 Million |
| Growth Rate (2026 - 2031) | 5.34 % |
| Fastest Growing Market | Asia-Pacific |
| Largest Market | North America |
| Market Concentration | Medium |
Major Players *Disclaimer: Major Players sorted in no particular order Image © Mordor Intelligence. Reuse requires attribution under CC BY 4.0. | |
Cosmetic Peptide Synthesis Market Analysis by Mordor Intelligence
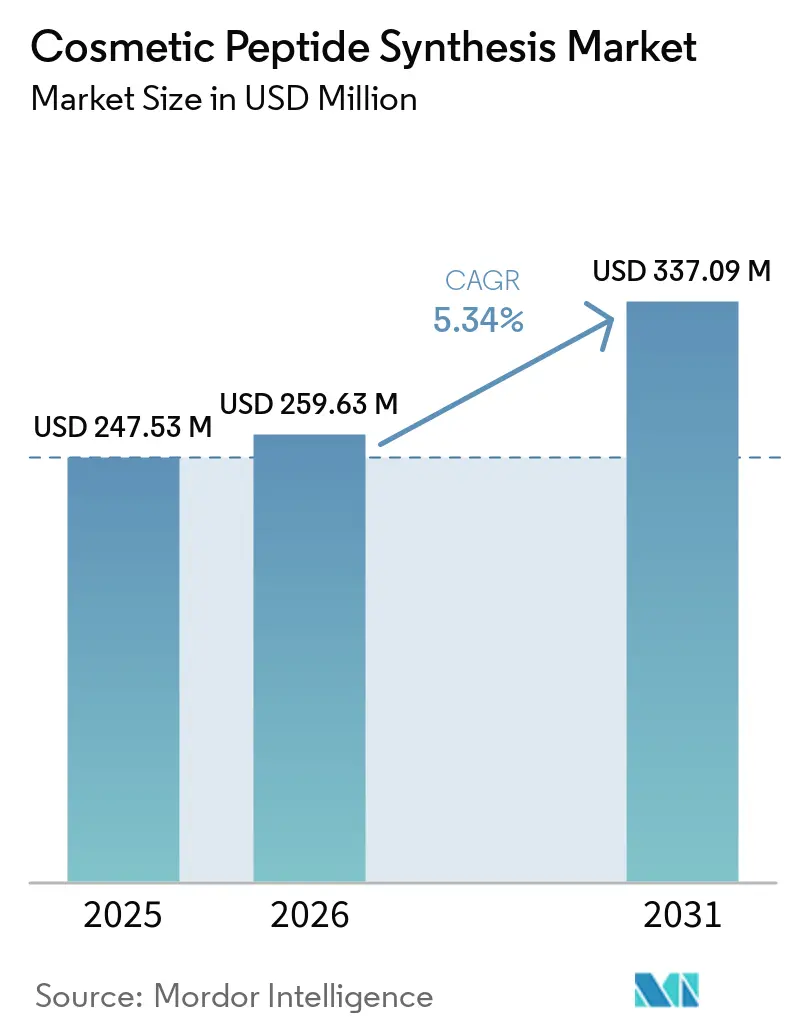
The Cosmetic Peptide Synthesis Market size was valued at USD 247.53 million in 2025 and is estimated to grow from USD 259.63 million in 2026 to reach USD 337.09 million by 2031, at a CAGR of 5.34% during the forecast period (2026-2031).
Advances in microwave-assisted solid-phase systems have trimmed synthesis cycles from weeks to days, while machine-learning models now predict peptide stability and skin permeability with better than 85% accuracy, giving formulators confidence to replace legacy actives. Demand is also migrating from single-function to multi-stack formulations, prompting brands to co-develop proprietary sequences with suppliers to secure exclusivity and higher price points. Regulatory fast-track pathways in the United States and South Korea shorten review times for functional cosmetics, enabling quicker commercialization of novel peptides. Finally, recombinant biosynthesis is reducing solvent use and production costs, helping the cosmetic peptide synthesis market adopt “clean-beauty” positioning without compromising purity.
Key Report Takeaways
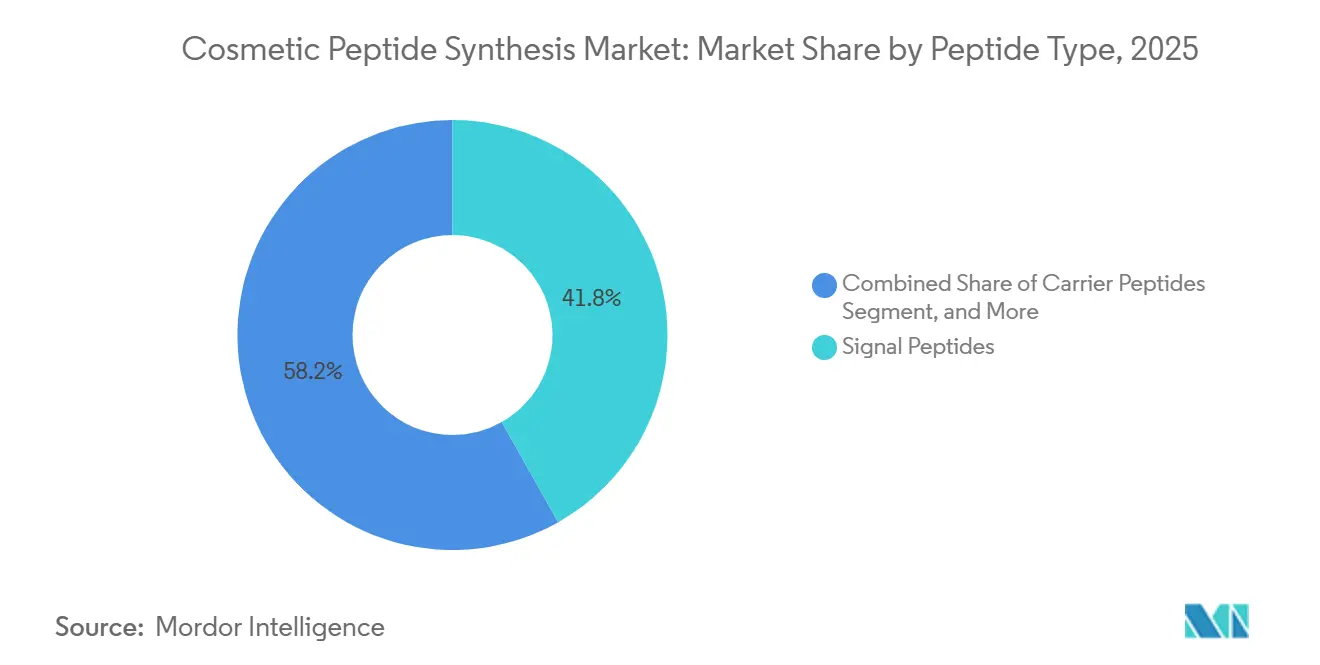
- By peptide type, signal peptides led with 41.82% of the cosmetic peptide synthesis market share in 2025, while carrier peptides are projected to expand at a 6.43% CAGR through 2031.
- By application, anti-aging accounted for 48.27% of the cosmetic peptide synthesis market size in 2025, whereas hair-care and scalp products are expected to post the fastest 8.72% CAGR to 2031.
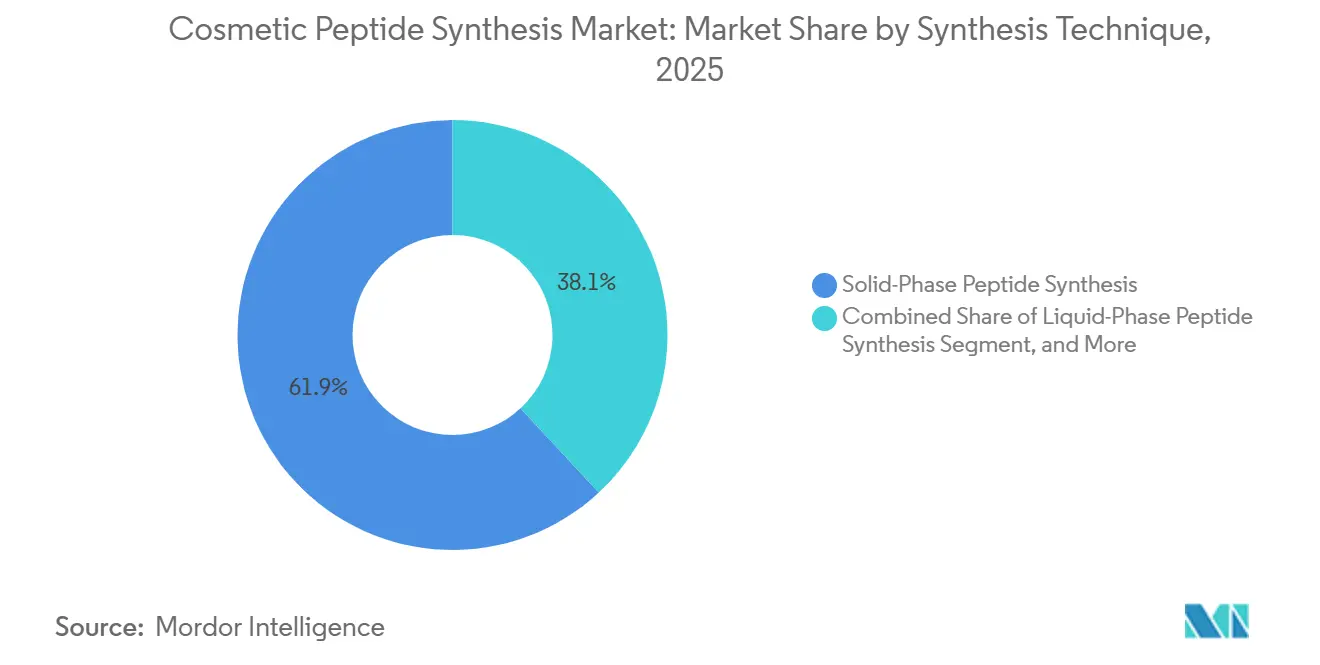
- By synthesis technique, solid-phase peptide synthesis held a 61.91% share in 2025, and recombinant or cell-free biosynthesis is advancing at a 7.45% CAGR between 2026 and 2031.
- By purity grade, ≥98% cosmetic grade accounted for 51.78% of the market in 2025 and is projected to grow at a 7.66% CAGR through 2031.
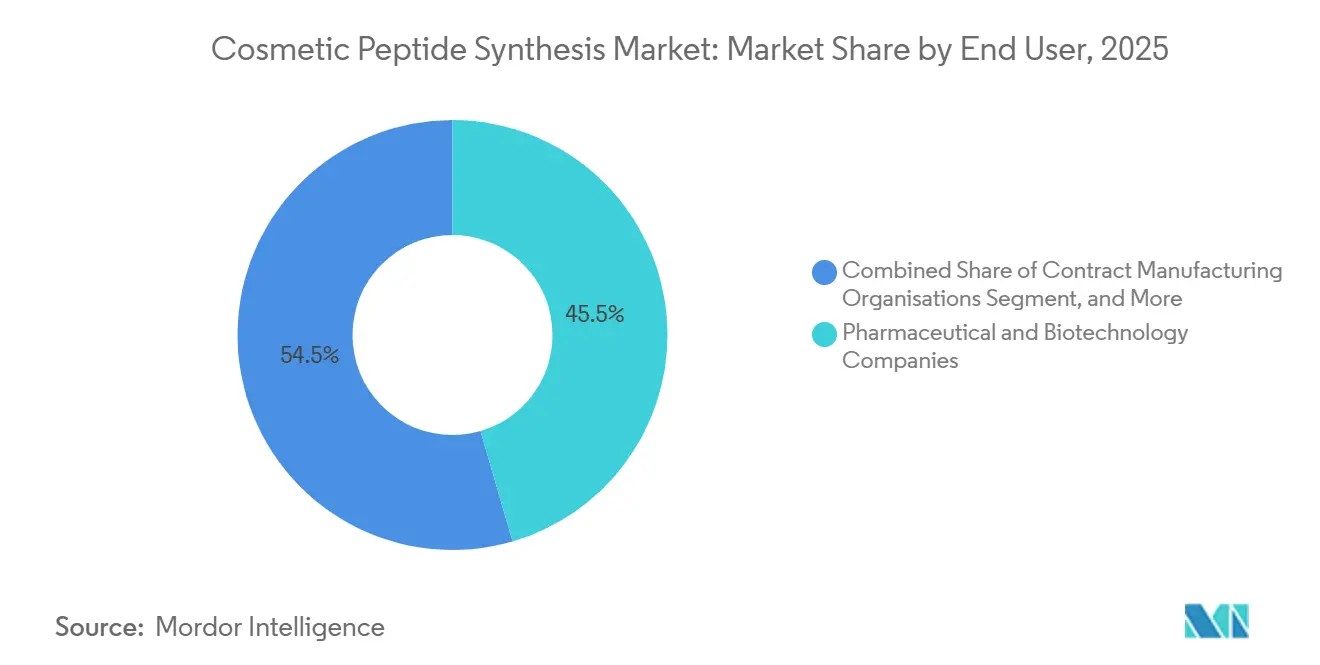
- By end user, pharmaceutical and biotechnology companies commanded 45.48% share in 2025, but contract manufacturing organizations are projected to register the highest 8.06% CAGR to 2031.
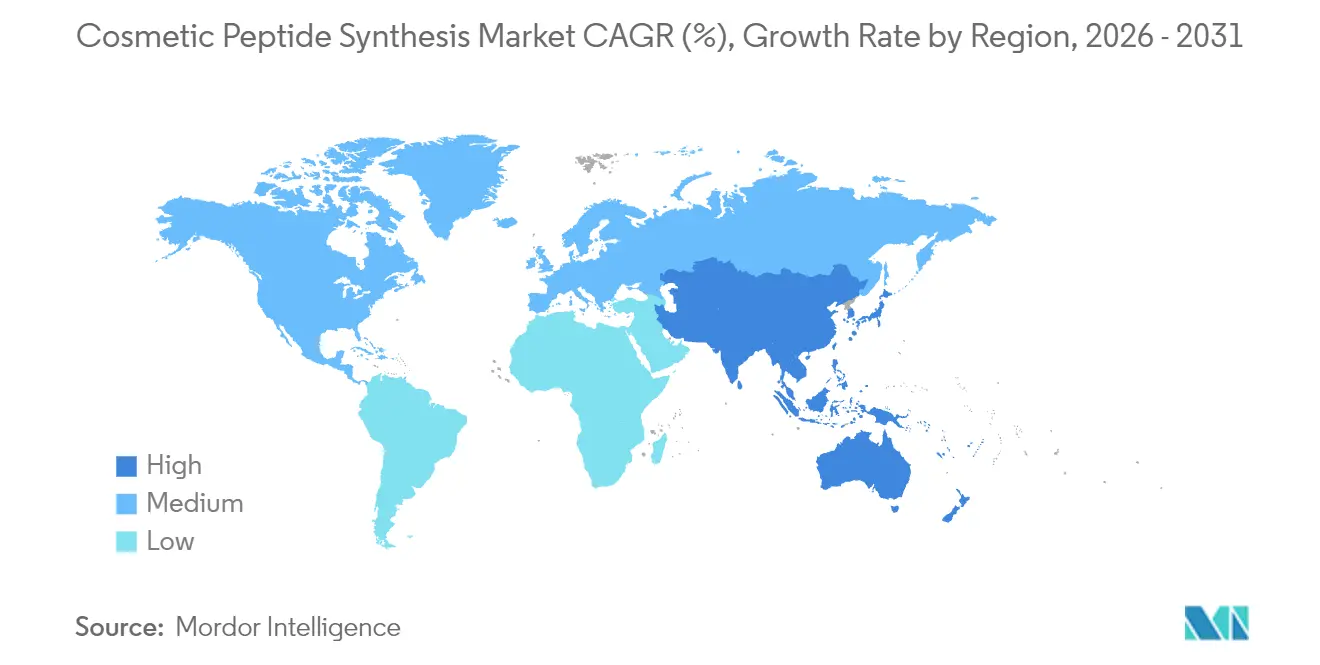
- By geography, North America retained a 42.84% share in 2025, whereas the Asia-Pacific is forecast to expand at a 9.36% CAGR through 2031.
Note: Market size and forecast figures in this report are generated using Mordor Intelligence’s proprietary estimation framework, updated with the latest available data and insights as of 2026.
Market Trends and Insights
Drivers Impact Analysis of Cosmetic Peptide Synthesis Market*
| Driver | (~) % Impact on CAGR Forecast | Geographic Relevance | Impact Timeline |
|---|---|---|---|
| Rising Demand for Biomimetic Anti-Aging Actives | +1.8% | Global, early uptake in North America & Europe | Medium term (2-4 years) |
| Lower-Cost High-Throughput SPPS Automation | +1.5% | Asia-Pacific core, spill-over to North America | Short term (≤ 2 years) |
| Premiumization of South-Korean Peptide Serums | +0.9% | South Korea & Japan, diffusing into Southeast Asia | Medium term (2-4 years) |
| Brand-Supplier Co-Development of Signature Peptides | +0.7% | North America & Europe, emerging in APAC | Long term (≥ 4 years) |
| AI-Driven Sequence Design Shortening R&D Cycles | +1.2% | North America & Europe, South Korea | Medium term (2-4 years) |
| Fast-Track Functional-Cosmetic Regulations | +0.6% | South Korea, Japan, selective EU markets | Short term (≤ 2 years) |
| Source: Mordor Intelligence | |||
Rising Demand for Biomimetic Anti-Aging Actives
Clinical evidence shows palmitoyl pentapeptide-4 can reduce wrinkle depth by up to 20% within twelve weeks without the irritation seen with topical retinoids. Acetyl hexapeptide-8 attenuates muscle contraction by blocking the SNARE complex, delivering visible smoothing comparable to low-dose botulinum toxin. Copper-GHK peptides further remodel extracellular matrix by activating metalloproteinases, improving dermal density by 18% after four months. Brands increasingly layer signal, carrier, and enzyme-inhibitor peptides into a single product, though this strategy increases the complexity of stability testing. Regulators still treat peptides as cosmetic ingredients unless explicit structure-function claims cross the drug threshold.[1]U.S. Food and Drug Administration, “Cosmetics Regulatory Guidance,” fda.gov
Lower-Cost High-Throughput SPPS Automation
Microwave-assisted reactors have cut coupling times from hours to minutes, halving labor costs and solvent use.[2]Rui Zhou et al., “Advances in Solid-Phase Peptide Synthesis and Automation,” Nature Communications, nature.com Continuous-flow SPPS eliminates manual resin transfers and lowers solvent demand by about 40%. Contract manufacturers equipped with these platforms can supply sub-kilogram batches inside four weeks, matching the agility of small-molecule suppliers. As a result, custom peptides now reach mid-tier products priced under USD 50, a price band historically out of reach for peptide actives. ISO 22716 guidelines ensure that higher throughput does not compromise traceability or contamination control.
AI-Driven Peptide Sequence Design Shortening R&D Cycles
Protein language models and diffusion-based generators evaluate thousands of candidate sequences weekly, predicting bioactivity and skin permeation with close to 90% accuracy. Evonik’s collaboration with GenScript identified a tetrapeptide that outperformed palmitoyl pentapeptide-4 by 22% in fibroblast assays within six weeks of screening.[3]Evonik Industries, “AI-Enabled Peptide Discovery Platform,” evonik.com Reduced discovery time allows niche brands to commission proprietary actives without building in-house wet labs. Regulators have not issued peptide-specific AI guidance, so AI-generated sequences follow existing cosmetic-ingredient frameworks in the EU and U.S.
Premiumization of South-Korean Peptide Serums
South-Korean labels have popularized serums that combine PDRN with multi-functional peptides, often retailing above USD 80 per 30 mL. These products pitch peptides as “skin’s native language” and favor fermentation-derived sequences that align with clean-beauty narratives. Rising export volumes to North America and Europe show that premium peptide positioning is resonating outside Asia. South-Korean regulation classifies peptides under 50 amino acids as cosmetic ingredients, avoiding therapeutic review burdens and hastening launch timelines.
Restraints Impact Analysis of Cosmetic Peptide Synthesis Market*
| Restraint | (~) % Impact on CAGR Forecast | Geographic Relevance | Impact Timeline |
|---|---|---|---|
| High Purification Costs Curb Mass-Market Pricing | -1.1% | Global, acute in cost-sensitive APAC & South America | Long term (≥ 4 years) |
| Batch-to-Batch Variability in Liquid-Phase Synthesis | -0.7% | APAC contract labs, less in EU & North America | Medium term (2-4 years) |
| Scrutiny of Micro-Plastic Carriers in Formulas | -0.3% | EU core, expanding to North America | Medium term (2-4 years) |
| Consumer Sensitivity to “Synthetic-Sounding” INCI Names | -0.4% | Global, most acute in clean-beauty segments | Short term (≤ 2 years) |
| Source: Mordor Intelligence | |||
High Purification Costs Curb Mass-Market Pricing
Preparative HPLC can represent up to 40% of final peptide cost, mainly due to acetonitrile consumption and solvent disposal fee. Membrane-based and continuous chromatography can shave 25-35% off purification expense, but fewer than 15% of global lines have adopted them because of validation complexity. Brands aiming for mass-market price points often reduce peptide load below 0.5%, which compromises efficacy and reinforces the “luxury-only” perception around peptides.
Liquid-phase peptide synthesis (LPPS) leaves 2-8% unreacted amino acids in hydrophobic sequences, creating impurity swings of up to 12% between batches. Chinese and Indian facilities that favor LPPS report rejection rates near 10%, versus 3% for SPPS sites. Each rejected lot triggers re-formulation or inventory write-offs, adding USD 500-800 per batch in extra analytical testing.
*Our forecasts treat driver/restraint impacts as directional, not additive. The impact forecasts reflect baseline growth, mix effects, and variable interactions.
Cosmetic Peptide Synthesis Market Segment Analysis
By Peptide Type:
Signal Peptides Retain Lead as Carrier Peptides Gain MomentumSignal peptides represented 41.82% of the cosmetic peptide synthesis market share in 2025. Continued use of palmitoyl pentapeptide-4 and palmitoyl tripeptide-1 in anti-aging creams sustains demand, while brands favor these sequences for their predictable stability profiles. Multi-vendor supply chains also support pricing discipline, limiting shortages.
Carrier peptides are forecast to post the fastest 6.43% CAGR through 2031. Copper-GHK complexes now shuttle trace elements that catalyze extracellular matrix remodeling without depending on synthetic polymers, which are now under environmental review. Formulators view carrier peptides as a route to differentiate textures and improve delivery efficiency.
Neurotransmitter-inhibitor peptides, such as acetyl hexapeptide-8, held a 23.1% share in 2025 and remain popular in expression-line serums, offering consumers a topical alternative to botulinum toxin injections. Enzyme-inhibitor peptides that block elastase and collagenase reached a significant share, with the highest uptake in urban regions where particulate pollution accelerates skin aging. Other functional peptides, including antimicrobial and pigment-modulating sequences and their use is widening into acne and hyperpigmentation products.


By Application:
Anti-Aging Dominates while Hair-Care AcceleratesAnti-aging maintained 48.27% of the cosmetic peptide synthesis market size in 2025. Although growth moderates in mature regions, the segment still benefits from multi-peptide stacking strategies that promise synergistic collagen stimulation.
Hair-care and scalp treatments are projected to grow at an 8.72% CAGR between 2026 and 2031. Evidence that copper-GHK can keep follicles in the anagen phase up to 22% longer is encouraging formulators to extend peptides beyond facial care. Whitening and brightening products held a 16.8% share, driven by oligopeptide-68 and nonapeptide-1, which offer tyrosinase inhibition without the regulatory baggage of hydroquinone. Barrier-repair creams and moisturizers captured 14.3% share, helped by peptides that lower trans-epidermal water loss. Eye-care and sun-care collectively make up a modest but rising slice, with DNA-repair peptides under investigation for after-sun recovery.
By Synthesis Technique:
SPPS Dominates, Recombinant Platforms SurgeSolid-phase peptide synthesis accounted for 61.91% of 2025 revenue and remains the default for sequences under 30 amino acids, thanks to automated platforms that deliver ≥98% purity in 4 weeks. The cosmetic peptide synthesis market size for SPPS is projected to keep expanding, though its overall share will gradually erode.
Recombinant and cell-free biosynthesis, growing at a 7.45% CAGR, benefits from lower solvent use and alignment with “green chemistry” targets. Liquid-phase peptide synthesis retains relevance for very short sequences, but its share is constrained by batch-quality issues. Hybrid or fragment-condensation routes remain a niche for cyclic or highly hydrophobic peptides that challenge standard SPPS.
By Purity Grade:
≥98% Specifications Gain Retail PreferenceThe ≥98% cosmetic-grade tier held 51.78% share in 2025 and is forecast to expand at a 7.66% CAGR as premium brands highlight analytical certificates on product pages. Retailers increasingly require proof of high purity to minimize contamination risk, pushing mid-tier brands toward the 95-98% band. Industrial and R&D grades below 95% cover pilot studies and cost-sensitive formulations but are unlikely to grow beyond a 15% share because efficacy claims weaken at low inclusion rates.
By End User:
Pharma & Biotech Lead, CMOs Outpace on GrowthPharmaceutical and biotechnology firms leveraged existing peptide drug know-how to hold a 45.48% share in 2025. However, contract manufacturing organizations will post the fastest CAGR of 8.06%, reflecting brand reluctance to invest in cGMP infrastructure. CMOs equipped with microwave-assisted SPPS and continuous-flow lines deliver sub-kilogram lots in under a month, attracting indie and prestige brands alike. Academic labs and formulation houses form the balance, using web-based configurators to order sample quantities for proof-of-concept studies.
Geography Analysis
North America Cosmetic Peptide Synthesis Market
North America held 42.84% market share of the cosmetic peptide synthesis market in 2025, anchored by cGMP facilities in New Jersey, California, and Massachusetts. Regional growth of 4.8% CAGR will be underpinned by AI-driven design tools, which are disproportionately headquartered in the United States. Canada mirrors U.S. regulatory frameworks, smoothing cross-border supply, while Mexico’s growth is strongest in premium department stores that favor high-purity imports.
Europe Cosmetic Peptide Synthesis Market
Germany leads consumption thanks to in-house peptide units at BASF and Evonik, while France benefits from luxury-brand demand. The United Kingdom, Italy, and Spain follow, each showing mid-single-digit growth as peptides replace retinoids in sensitive-skin regimens.
APAC Cosmetic Peptide Synthesis Market
Asia-Pacific is the fastest-growing region, with a 9.36% CAGR through 2031. China hosts expanding recombinant-biosynthesis hubs in Shenzhen and Shanghai, while South Korean brands collaborate with local suppliers to launch signature hexapeptides. Japan’s regulatory designation of “functional cosmetics” allows structure-function claims once ingredients pass safety review, helping local brands market efficacy data. India and Southeast Asia show double-digit growth driven by rising discretionary incomes, though price sensitivity still favors lower inclusion rates.
South Africa Cosmetic Peptide Synthesis Market
High per-capita spending and tourism retail bolster demand, but limited local manufacturing means most peptides enter as finished products. South Africa represents the region’s secondary growth node, focused on remedies for hyperpigmentation and sun damage.
South America Cosmetic Peptide Synthesis Market
Brazil dominates, supported by local brands adding peptides to anti-aging creams designed for sun-exposed climates. Argentina and Chile follow, though currency volatility can disrupt import pipelines. Regional regulators such as ANVISA require safety dossiers but no pre-market efficacy approval, enabling relatively swift launches.

Regulatory Landscape
Cosmetic peptide synthesis suppliers operate within cosmetics ingredient and manufacturing frameworks, where claim substantiation and ingredient naming drive compliance. In the European Union, Regulation (EC) No 1223/2009 continues to govern cosmetic safety and labeling, and Regulation (EU) 2024/858 amended the framework to restrict specific nanomaterials, including Acetyl heptapeptide-9 Colloidal gold and Acetyl tetrapeptide-17 Colloidal Platinum (March 2024). This reinforces tighter control for novel peptide delivery formats.
In 2026, technical expectations for peptide quality documentation tightened across key jurisdictions. The European Medicines Agency Guideline on the Development and Manufacture of Synthetic Peptides (effective June 1, 2026) provides a clearer quality-by-design and control framework, shaping how CMOs build impurity controls and validation packages even when supplying cosmetic-grade peptides. In China, the National Medical Products Administration released five new cosmetic industry standards in April 2026, including YY/T 10001-2026 for biotechnology-derived ingredients and peptide-specific standards such as YY/T 10004-2026 (Acetyl Hexapeptide-8) and YY/T 10005-2026 (Copper Tripeptide-1). These standards take effect May 1, 2027, pushing suppliers toward more standardized test methods and dossiers for commonly used cosmetic peptides.
Competitive Landscape
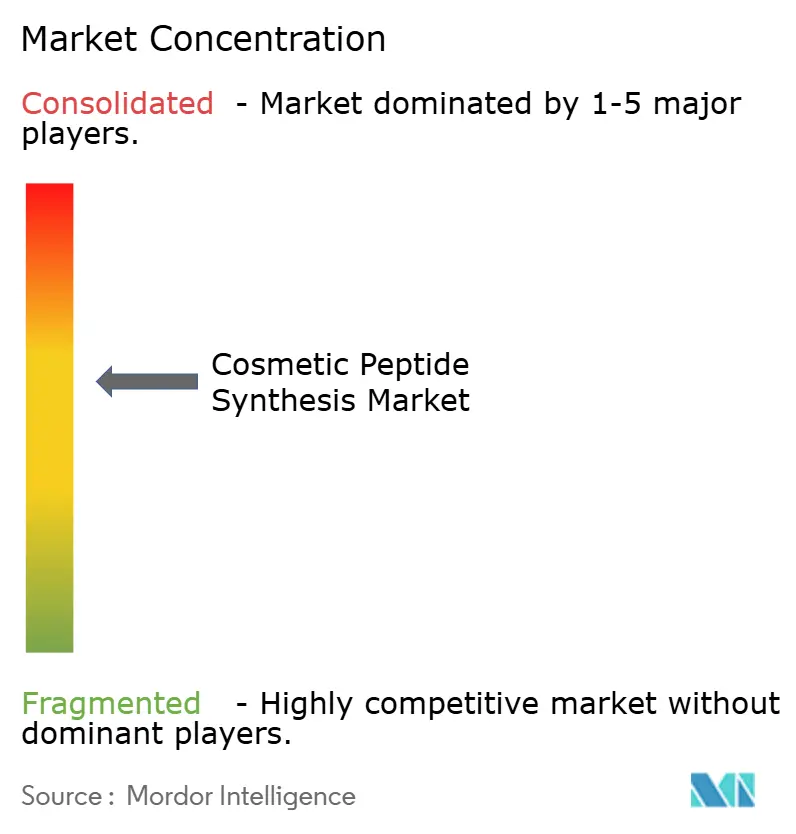
The cosmetic peptide synthesis market is moderately fragmented. Players compete on purity guarantees, sequence customization, and speed. Bachem’s 2026 Swiss plant expansion added microwave reactors that trim production timelines by 35%. PolyPeptide’s continuous-flow installation in Sweden reduces solvent use by 40%. BASF has commercialized fermentation-derived palmitoyl tripeptide-1, lowering per-gram costs by 38% while meeting clean-beauty claims.
AI partnerships are reshaping the landscape. Evonik’s alliance with GenScript screens 10,000 sequences weekly, bringing bespoke actives to market in under a year. Smaller firms such as Creative Peptides use automated configurators to quote and ship sub-kilogram lots within three weeks, attracting indie brands. Ingredient majors Givaudan and Croda are vertically integrating synthesis capacity to offer turnkey solutions from sequence ideation to finished formula testing.
Compliance remains non-negotiable. ISO 22716 certification and cosmetic GMP audits are routine, but leading brands now also request Ecocert or COSMOS validation. Consequently, suppliers are investing in recombinant platforms that minimize acetonitrile discharge and meet environmental audit requirements. The pivot to greener production is likely to tighten supply among firms still reliant on solvent-intensive chromatography.
Cosmetic Peptide Synthesis Industry Leaders
BASF SE
Croda International plc (Sederma)
Symrise AG
Givaudan SA (Active Beauty)
DSM-Firmenich (Pentapharm)
- *Disclaimer: Major Players sorted in no particular order
Cosmetic Peptide Synthesis Market Companies Covered in this Report
- AAPPtec
- Activotec
- AmbioPharm
- Ashland
- Bachem Holding
- BASF
- Bio Basic
- CEM
- Creative Peptides
- Croda International plc (Sederma)
- CSBio Company
- DSM-Firmenich (Pentapharm)
- Evonik Industries
- GenScript Biotech Corp.
- Givaudan SA (Active Beauty)
- Lubrizol
- PolyPeptide Group
- RS Synthesis LLC
- Symrise AG
- Shenzhen JYMed Technology

Market Opportunities and Future Outlook
Opportunities are clustering around peptides that fit clean-beauty positioning while meeting higher purity and documentation requirements. This is particularly visible in recombinant, cell-free, and precision-fermentation routes, which reduce solvent intensity compared with conventional SPPS purification. In April to June 2026, BASF expanded its personal care peptide and bioengineered protein positioning with launches linked to precision peptide and recombinant collagen III fragment technology (SkinNexus Collag3n developed with Bota Biosciences). The company’s push supports supplier-led differentiation beyond commodity signal peptides and creates whitespace for brands seeking bio-identical or fermentation-derived actives.
Capacity additions and localization moves also broaden addressable outsourcing for cosmetic-grade peptide programs, especially for CMOs that can support short lead-time, sub-kilogram campaigns for prestige and indie brands. SK pharmteco announced a USD 260 million investment (September 2024) in a new peptide facility in Sejong, South Korea. PolyPeptide Group reported 2024 debottlenecking in Torrance, California and the startup of large-scale SPPS capacity in Braine-l'Alleud, Belgium, which together expand supply options across North America and Europe. Separately, delivery and stability technologies are increasingly linked to premium pricing, including Croda's Matrixyl Neolide (April 2026) using encapsulation for extended release, which raises demand for peptide suppliers that can co-develop sequences alongside compatible delivery systems and provide robust stability packages.
Recent Industry Developments in Cosmetic Peptide Synthesis Market
- June 2026: BASF launched SkinNexus Collag3n, a recombinant, human-identical Collagen III fragment developed with Bota Biosciences for personal care applications. The move extends peptide-adjacent portfolios into bioengineered structural proteins, raising the bar for suppliers that compete on biologically derived actives and documented performance.
- June 2025: Symrise announced SymLash XTreme, a lipopeptide-based eyelash enhancement technology for beauty formulations. The launch highlights continued product innovation in performance-driven peptide formats beyond facial anti-aging, supporting broader application pull-through for cosmetic-grade peptide synthesis.
- September 2024: SK pharmteco announced a USD 260 million investment in a new peptide facility in Sejong, South Korea. The investment expands outsourcing capacity for cosmetic-grade peptide programs and strengthens supply options in Asia.


Cosmetic Peptide Synthesis Market Report Scope and Research Methodology
Market Definition and Coverage
This market covers the global value of synthesizing peptides that are formulated into cosmetic and personal care products, including the related contract manufacturing and in-house production that supports cosmetic use.
Scope exclusions: We exclude peptides that are manufactured and priced primarily for therapeutic drug development, medical devices, and general lab reagent use when they are not intended for cosmetic formulations.
Segments Covered in This Report
- By Peptide Type
- Signal Peptides
- Neurotransmitter Inhibitor Peptides
- Carrier Peptides
- Enzyme Inhibitor Peptides
- Other Functional Peptides
- By Application
- Anti-aging
- Whitening & Brightening
- Barrier Repair & Moisturising
- Hair-care & Scalp Treatments
- Eye-care Products
- Sun-care & After-sun
- By Synthesis Technique
- Solid-Phase Peptide Synthesis (SPPS)
- Liquid-Phase Peptide Synthesis (LPPS)
- Hybrid / Fragment Condensation
- Recombinant / Cell-free Biosynthesis
- By Purity Grade
- ≥ 98 % Cosmetic Grade
- 95 – 98 % Cosmetic Grade
- < 95 % Industrial / R&D Grade
- By End User
- Pharmaceutical & Biotechnology Companies
- Contract Manufacturing Organisations (CMOs)
- Other End Users
- By Geography
- North America
- United States
- Canada
- Mexico
- Europe
- Germany
- United Kingdom
- France
- Italy
- Spain
- Rest of Europe
- Asia-Pacific
- China
- Japan
- India
- Australia
- South Korea
- Rest of Asia-Pacific
- Middle East & Africa
- GCC
- South Africa
- Rest of Middle East & Africa
- South America
- Brazil
- Argentina
- Rest of South America
- North America
Data Sources, Market Sizing, and Validation
Desk Research
Desk research started with building a clean view of where cosmetic peptides sit inside the broader cosmetics ingredient and specialty chemicals ecosystem. We used public sources such as the US FDA cosmetics resources, the European Commission Cosmetics Regulation and CosIng ingredient database, and similar regulatory guidance that clarifies allowed claims and ingredient labeling.
To size the demand environment, we also reviewed materials from groups such as the Personal Care Products Council and Cosmetics Europe, along with trade data references from UN Comtrade and national customs dashboards for relevant chemical categories. Financial filings, investor decks, reputable press coverage, and patent databases were then used to track capacity signals, technology direction in synthesis routes, and typical purity-grade discussions. This list is not exhaustive, and many other public and subscription sources were also referenced for data collection, cross-checking, and clarifying open questions.
Primary Interviews and Surveys
Primary work was used to test what we saw in public materials, especially the mix of synthesis techniques, cosmetic-grade purity pricing, and how volumes move between in-house production and outsourced manufacturing. We spoke with peptide suppliers, contract manufacturers, distributors, and downstream formulators across APAC, EMEA, and the Americas to validate assumptions and correct any weak points in the desk model.
Distribution of primary research fieldwork respondents
| Company type | Respondent position | Region |
|---|---|---|
| Top tier: 35% | CXOs: 14% | APAC: 43% |
| Mid tier: 47% | Functional/Unit leaders: 37% | EMEA: 31% |
| Smaller Players: 18% | Managers: 49% | Americas: 26% |
Market-Sizing & Forecasting
The core model uses a top-down approach, translating cosmetics ingredient demand and manufacturing activity into an addressable peptide synthesis value pool, and then narrowing by cosmetic-grade adoption across key applications. We corroborated the totals using selective bottom-up checks, including sampled supplier capacity discussions, channel checks on cosmetic-grade peptide price bands, and a volume-by-purity mix that aligns with the interview feedback.
Key inputs that shaped the sizing included the share of anti-aging and brightening formulations that actively use peptides, the split of solid-phase versus liquid-phase synthesis across cosmetic production, typical purity grade thresholds used for cosmetics, regional mix of production and consumption, and the observed price progression for cosmetic-grade peptides (quoted in USD and normalized for timing). For forecasting, we used scenario analysis supported by expert consensus on adoption rates in anti-aging and barrier repair lines, expected outsourcing intensity, and the pace of scale-up in APAC. Where bottom-up visibility was thin, we handled gaps by applying conservative penetration ranges to the validated demand pool, then tightened those ranges after re-checks with primary respondents.
Data Validation & Update Cycle
Outputs are stress-tested through multiple cross-checks before sign-off, including variance checks by region, technique, and purity mix, so that no single assumption quietly drives the full total. We compare modeled totals with independent signals, such as broad cosmetics production trends, ingredient import patterns, and the direction of peptide-related patent activity, and then we re-contact experts if any metric looks out of line.
A second analyst review is completed to confirm that calculations are traceable and that conversion and timing assumptions are applied consistently. The report is refreshed annually, and interim updates are made when material events occur that can shift pricing, capacity, or demand. Before delivery, a fresh pass is completed so clients receive the most current view available at that time.
Mordor Intelligence's Cosmetic Peptide Synthesis Market Size Versus Other Published Estimates
Published market sizes for cosmetic peptide synthesis can differ quite a bit, even when the topic name looks the same, because included revenue streams and end-use filters are not always aligned. Differences also come from how firms treat purity grades, which year they anchor pricing to, and whether they refresh assumptions after large capacity or demand shifts.
Peptides sold mainly as pharma and biotech actives are kept outside Mordor Intelligence's scope, which removes a large adjacent revenue pool that some estimates blend into the cosmetics story. The other big gap drivers we see are whether recombinant routes are counted as full synthesis revenue or only as an enabling step, how aggressive the ASP curve is for cosmetic-grade purity, and whether regional demand is tied back to cosmetic formulation activity versus broader peptide manufacturing output.
Benchmark comparison
| Source | Market Size | Gaps in Research Methodology |
|---|---|---|
| Mordor Intelligence | USD 259.63 M (2026) | |
| Industry Association A | USD 310.00 M (2026) | Often presented as a broader peptide manufacturing value that includes non-cosmetic end uses, and it can apply a single average price without adjusting for cosmetic-grade purity mix. |
| Trade Journal B | USD 210.00 M (2025) | Typically uses a different base year and simpler currency timing, and it may treat contract synthesis service revenue as separate from peptide material sales, which lowers the combined total. |
The spread in the table is mainly explained by end-use boundaries, purity and pricing treatment, and base-year alignment, rather than by disagreement on the direction of demand. By keeping assumptions tied to cosmetic formulation pull-through and checking them through interview-led reality checks, the final value stays traceable to clear variables that can be repeated and updated.


Key Questions Answered in the Report
What is the forecast value of the cosmetic peptide synthesis market by 2031?
What is the forecast value of the cosmetic peptide synthesis market by 2031?
Which peptide category is expected to grow the fastest through 2031?
Carrier peptides are projected to register the highest 6.43% CAGR.
Why are contract manufacturing organizations gaining share?
Brands prefer outsourcing to CMOs that offer four-week turnaround times, validated GMP suites, and cost flexibility.
How is recombinant biosynthesis impacting peptide production?
Fermentation-based methods cut solvent use and lower per-gram costs by about 40%, aligning with clean-beauty goals.
Which region will experience the quickest growth?
Asia-Pacific is forecast to expand at a 9.36% CAGR through 2031, led by China and South Korea.
Page last updated on:


 Your data is secure and never sold or shared.


