
Cosmetic Antioxidants Market Size and Share
Market Overview
| Study Period | 2020 - 2031 |
|---|---|
| Market Size (2026) | USD 155.8 Million |
| Market Size (2031) | USD 204.82 Million |
| Growth Rate (2026 - 2031) | 5.62 % |
| Fastest Growing Market | Asia-Pacific |
| Largest Market | Asia Pacific |
| Market Concentration | Medium |
Major Players *Disclaimer: Major Players sorted in no particular order Image © Mordor Intelligence. Reuse requires attribution under CC BY 4.0. | |
Cosmetic Antioxidants Market Analysis by Mordor Intelligence
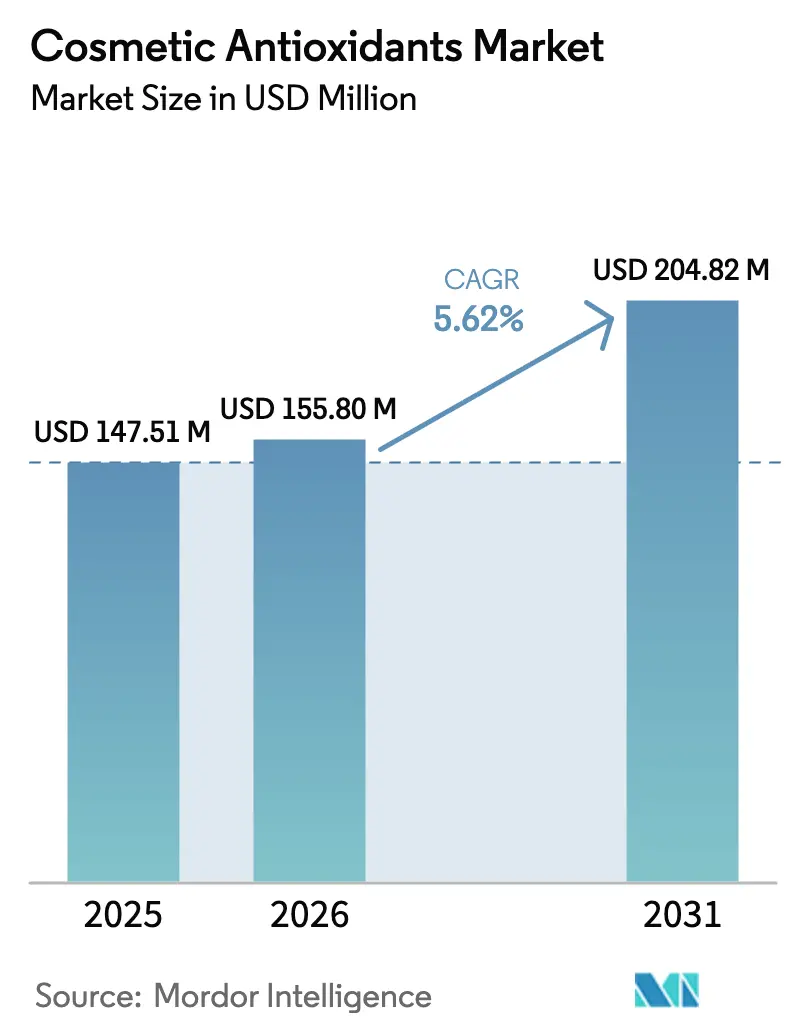
The Cosmetic Antioxidants Market size was valued at USD 147.51 million in 2025 and estimated to grow from USD 155.8 million in 2026 to reach USD 204.82 million by 2031, at a CAGR of 5.62% during the forecast period (2026-2031). Demand momentum rests on consumer migration toward clean-label, plant-derived actives, stronger appeal for multifunctional ingredients that simplify routines, and the steady expansion of direct-to-consumer (D2C) channels that spotlight ingredient transparency. Brand owners are revamping portfolios around antioxidants that shield against ultraviolet radiation, urban pollution, and blue-light exposure, a shift that is broadening value pools beyond traditional anti-aging claims. Cost-effective synthetic molecules still dominate volumes, yet superior growth rates for natural alternatives illustrate rising willingness to pay premiums for traceable, sustainably sourced inputs. Mid-sized contract manufacturers and biotech startups benefit from regulatory harmonization that accelerates product registrations, especially in Asia-Pacific, where formulators leverage regional biodiversity and advanced fermentation techniques to commercialize next-generation antioxidant actives.
Key Report Takeaways
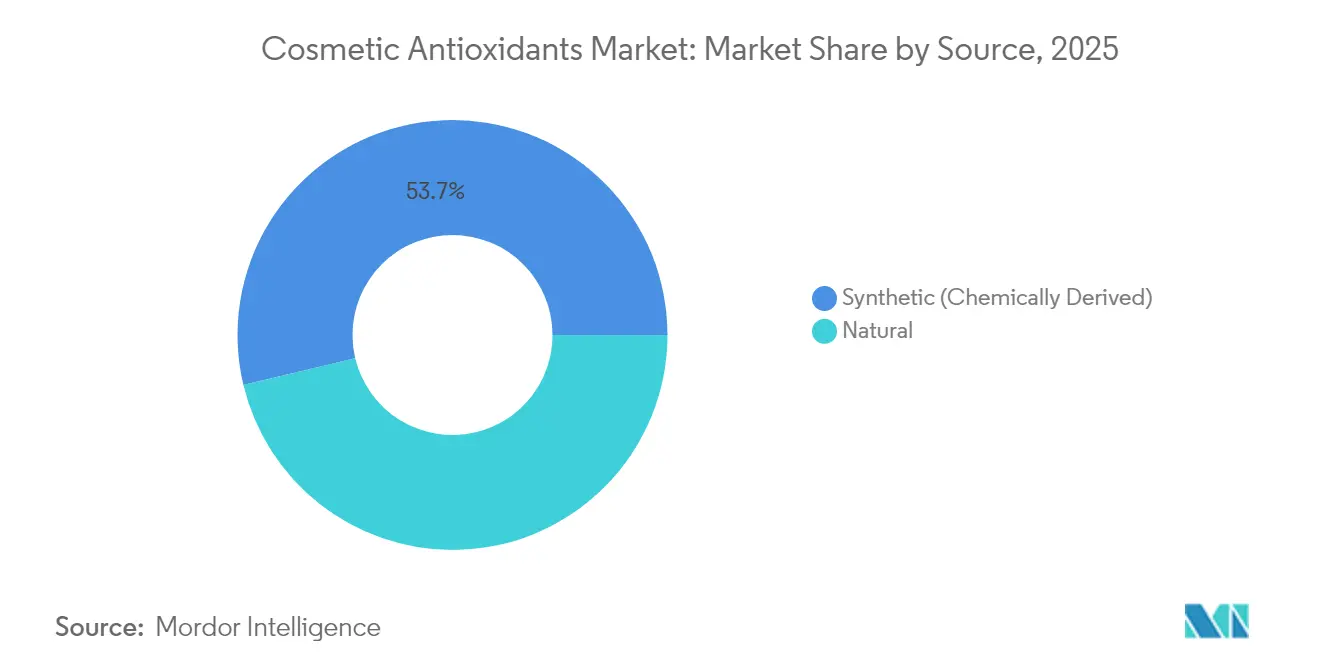
- By source, synthetic ingredients retained 53.74% of the cosmetic antioxidants market share in 2025, while natural counterparts are projected to rise at a 6.74% CAGR through 2031.
- By type, vitamin E held 38.45% revenue share in 2025; polyphenols are forecast to expand at a 6.88% CAGR to 2031.
- By function, anti-aging products accounted for 40.05% of the cosmetic antioxidants market size in 2025, whereas anti-pollution and blue-light defense show the fastest trajectory at 6.49% CAGR over the same period.
- By application, skin-care contributed 60.98% revenue share in 2025; nutri-cosmetics is set to grow at a 6.92% CAGR to 2031.
- By region, Asia-Pacific commanded 38.76% of global revenue in 2025 and is advancing at a 6.52% CAGR to 2031.
Note: Market size and forecast figures in this report are generated using Mordor Intelligence’s proprietary estimation framework, updated with the latest available data and insights as of 2026.
Market Trends and Insights
Drivers Impact Analysis of Cosmetic Antioxidants Market*
| Drivers | (~) % Impact on CAGR Forecast | Geographic Relevance | Impact Timeline |
|---|---|---|---|
| Rising online D2C cosmetic purchases | 1.2% | Global, with early gains in North America, Europe, APAC core | Medium term (2-4 years) |
| Boom in male-grooming and gender-neutral beauty lines | 0.8% | North America and EU, spill-over to APAC | Medium term (2-4 years) |
| Growing demand for clean-label, plant-derived antioxidants | 1.5% | Global | Long term (≥ 4 years) |
| Rapid uptake of multifunctional antioxidants in SPF and anti-pollution products | 1.1% | APAC core, spill-over to MEA | Short term (≤ 2 years) |
| Increasing usage of beauty and personal care products | 0.9% | Global, with strongest impact in emerging markets | Long term (≥ 4 years) |
| Source: Mordor Intelligence | |||
Rising Online D2C Cosmetic Purchases
E-commerce enables beauty brands to communicate ingredient science directly to consumers who expect full formulation transparency. Niche formulators capitalize on lower entry barriers by targeting narrow skin-concern communities, rebalancing bargaining power in the cosmetic antioxidants market. Digital storefronts also shorten feedback loops, allowing rapid A/B testing of vitamin E or polyphenol concentrations that optimize both efficacy and texture. Fulfilment data show conversion uplift when brands publish third-party test results that validate antioxidant potency, reinforcing the business case for investments in high-quality actives. As 5G coverage scales, livestream-commerce formats further magnify reach, cementing D2C as an enduring growth vector.
Boom in Male-Grooming and Gender-Neutral Beauty Lines
Social platforms now normalize extended skin-care routines among men, with male serum usage climbing sharply between 2024 and 2025. Retail audits record a rise in SKU counts for vitamin C and niacinamide serums targeted at male barrier repair, signalling fresh addressable volumes for antioxidant suppliers. Gender-neutral formats elevate function over demographic targeting, pushing brands to formulate universally tolerated actives such as tocotrienols or ferulic acid that satisfy sensitive-skin criteria. Ingredient stories that fuse efficacy data with environmental-impact narratives resonate strongly with Gen Z shoppers, amplifying conversion rates in the cosmetic antioxidants market. Formulators that master scent neutrality and matte sensoriality gain incremental shelf facings in convenience and specialty retail. Retailers increasingly request ESG documentation alongside safety dossiers, prompting suppliers to audit feedstock chains and lower carbon footprints.
Growing Demand for Clean-Label, Plant-Derived Antioxidants
Botanical extracts rich in polyphenols and flavonoids display antioxidant capacities surpassing conventional synthetics while providing ancillary anti-inflammatory and photoprotective benefits[1]. Green-chemistry extraction methods such as supercritical CO₂ and enzyme-assisted hydrolysis enhance yield and preserve delicate actives, enabling competitive cost structures. Certification frameworks like COSMOS and NATRUE sharpen differentiation for premium brands, yet impose meticulous traceability demands that restructure procurement. Venture capital flows into ag-bio platforms that cultivate micro-algae strains for astaxanthin production, diversifying supply bases and mitigating crop-failure risks. Long-term supply agreements between global finished-goods multinationals and community farmers in Africa and Latin America bolster social-impact credentials while securing exclusive access to indigenous botanicals. The interplay of efficacy, ethics, and experiential storytelling positions natural antioxidants as critical levers for brand equity in the cosmetic antioxidants market.
Rapid Uptake of Multifunctional Antioxidants in SPF and Anti-Pollution Products
Urban particulate matter exacerbates oxidative stress, spurring formulators to layer antioxidants atop UV filters for holistic defense. Vitamin E ester blends reduce lipid peroxidation while vitamin C regenerates tocopherol radicals, jointly improving photostability of mineral sunscreens. Patented hydroxytyrosol derivatives sourced from up-cycled olive-press waste deliver dual antipollution and anti-inflammatory performance, offering evidence-based narratives for circular-economy marketing. Consumer willingness to reapply sunscreen multiple times daily remains low; therefore, multifunctional day creams embedding SPF30 and robust antioxidant systems command premium price points. Regional regulatory revisions that tighten permissible UVA/UVB ratios stimulate research and development collaborations between filter and antioxidant suppliers, accelerating co-encapsulation techniques that enhance dispersion and sensoriality.
Restraints Impact Analysis of Cosmetic Antioxidants Market*
| Restraints | (~) % Impact on CAGR Forecast | Geographic Relevance | Impact Timeline |
|---|---|---|---|
| Price premium of certified natural antioxidants | -0.9% | Global | Long term (≥ 4 years) |
| Stringent regional bans on selected synthetic antioxidants like BHA | -0.6% | EU, with spill-over to North America | Medium term (2-4 years) |
| High oxidative-stability testing costs for biotech antioxidants | -0.7% | Global, particularly impacting smaller players | Medium term (2-4 years) |
| Source: Mordor Intelligence | |||
Price Premium of Certified Natural Antioxidants
Certified organic polyphenols can cost three to five times more than synthetic butylated hydroxytoluene, largely due to low extraction yields and labor-intensive traceability audits. While prestige skincare tolerates higher cost-of-goods, mass-market channels resist price inflation, constraining penetration of natural actives in value segments. Transparent payroll and fair-trade premiums paid to smallholder farmers add another layer of expense, yet remain essential to brand narratives that promise social equity. As inflationary pressure squeezes consumer wallets in certain regions, private-label retailers favor cost-controlled synthetics to sustain accessible unit prices. Scale economics may gradually compress price gaps, but sustained research and development are required to lift antioxidant concentrations without compromising texture or stability in water-light formulations.
Stringent Regional Bans on Selected Synthetic Antioxidants Like BHA
EU Regulation (EC) 1223/2009 caps BHT at 0.8% in cosmetics and bans BHA outright in oral-care, compelling global brands to pursue region-specific reformulations[2]. Compliance introduces analytical-testing costs, regulatory-affairs overhead, and prolonged validation timelines. Smaller enterprises face disproportionate burdens due to limited toxicology resources, encouraging subcontracting to specialized formulation houses. Retail buyers in North America have begun adopting EU lists as de facto guidelines, foreshadowing additional market-access complexity. Companies with diverse antioxidant portfolios and robust predictive-toxicology platforms can switch ingredients efficiently, seizing shelf space vacated by less agile competitors.
*Our forecasts treat driver/restraint impacts as directional, not additive. The impact forecasts reflect baseline growth, mix effects, and variable interactions.
Cosmetic Antioxidants Market Segment Analysis
By Source:
Natural Growth Accelerates Despite Synthetic DominanceSynthetic molecules held 53.74% share of the cosmetic antioxidants market in 2025, insulated by proven stability, broad availability, and low unit costs. Vitamin E acetate and BHT remain staples in high-volume lotions and shampoos where formulation latitude is limited, supporting steady but slower revenue expansion. Natural extracts, in contrast, post a 6.74% CAGR through 2031, driven by clean-beauty positioning and the rise of short INCI lists that highlight single-origin active boosters. The cosmetic antioxidants market size for natural inputs is projected to swell alongside green-chemistry innovations that raise extraction yields and cut solvent usage. Biodiversity legislations like the Nagoya Protocol also incentivize traceability, nudging multinational buyers toward equitable benefit-sharing contracts with local growers. Despite certification expenses, gross margins remain attractive for vertically integrated suppliers who command premium transfer prices on limited-edition botanicals.

By Type:
Polyphenols Challenge Vitamin E SupremacyVitamin E dominated revenues at 38.45% in 2025, benefiting from decades of regulatory acceptance and consumer recognition. Tocopherol versatility allows incorporation into oil-based serums, anhydrous sticks, and waterless balms, reinforcing its ubiquity. Yet polyphenols rise at a 6.88% CAGR, propelled by superior radical-scavenging capacity that supports hyper-transparency claims in prestige skincare. The cosmetic antioxidants market size for polyphenols is primed to scale further as encapsulation technologies enhance stability against oxidation and pH fluctuations. Emerging marine polyphenols extracted from seaweed provide novel marketing angles around “blue beauty,” resonating with coastal conservation themes popular in Asia-Pacific tourism hubs.
By Function:
Anti-Pollution Segment Disrupts Traditional Anti-Aging FocusAnti-aging maintained a 40.05% share in 2025, anchored by consumer familiarity with collagen support and wrinkle reduction. However, smartphone overuse and dense urban living spark anxiety over digital and atmospheric aggressors, catapulting anti-pollution and blue-light defense to a 6.49% CAGR. Labels now feature micron-level pollution-blocking data alongside antioxidant ORAC scores, driving trade-up in day creams. The cosmetic antioxidants market share for anti-pollution products climbs further as dermatologists validate links between particulate exposure and premature pigmentation.
Regulatory pressure to upgrade sun-protection factors lifts demand for antioxidants that stabilize UV filters, creating cross-functional opportunities. Moisturization and barrier-repair remain evergreen, especially for sensitive-skin portfolios targeting atopic demographics. Hybrid SKUs unite niacinamide, ceramides, and tocopherol into single-step solutions, simplifying routines while satisfying dermatologist recommendations. This convergence blurs lines between classical functional groupings, encouraging suppliers to build broad-spectrum antioxidant complexes that address multiple stressors simultaneously.
By Application:
Nutri-Cosmetics Revolutionize Beauty-from-Within ConceptsTopical skincare contributed 60.98% of 2025 revenues, but ingestible nutri-cosmetics record a 6.92% CAGR as consumers embrace supplements to reinforce external regimens. Collagen-vitamin-C gummies enjoy shelf prominence across pharmacy chains, bridging functional nutrition and beauty categories. Hair-care manufacturers infuse shampoos with maqui-fruit antioxidants that neutralize free radicals generated by thermal styling tools, echoing skin-care narratives of repair and protection. Decorative cosmetics now include microencapsulated carotenoids that guard lip color against UVA degradation, broadening antioxidant exposure across routines.
Professional injectable antioxidants enter dermatology clinics as adjuncts to resurfacing procedures, indicating a medical-beauty crossover that ultimately funnels demand back to raw-material suppliers. The cosmetic antioxidants market, therefore benefits from multi-channel consumption, cushioning volatility in any single product category. Formulator interviews reveal growing interest in “beauty stack” strategies where oral, topical, and procedural formats share complementary actives, reinforcing lifetime customer value for ingredient vendors.

Geography Analysis
APAC Cosmetic Antioxidants Market
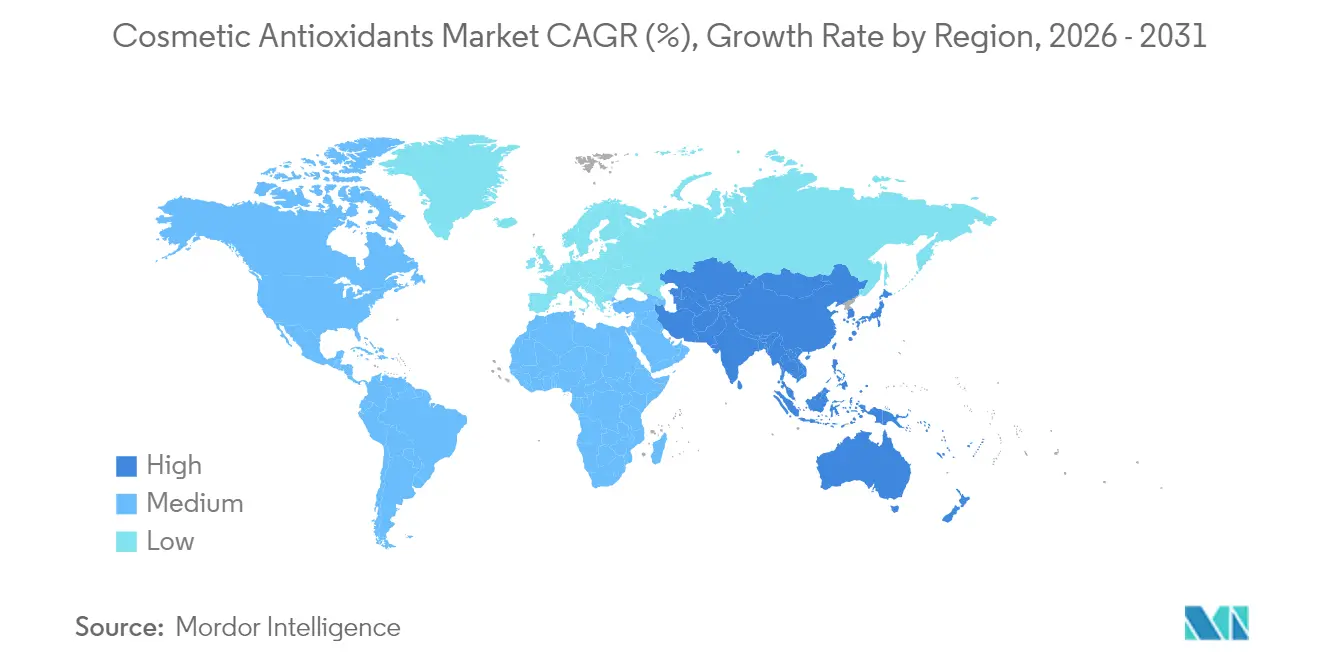
Asia-Pacific leads both absolute demand and growth velocity in the cosmetic antioxidants market. The region accounted for an estimated 38.76% share in 2025 and is forecast to maintain a 6.52% CAGR, supported by rising disposable incomes, elevated skin-care literacy, and a cultural predisposition toward preventive rituals.
North America and Europe Cosmetic Antioxidants Market
North America constitutes a mature but innovation-hungry arena where male-grooming and gender-neutral lines inject dynamism. Dermatologist-dispensed brands increasingly rely on encapsulated vitamin C to circumvent oxidation, maintaining high repurchase rates among ingredient-savvy shoppers. Europe sustains premium price points underpinned by rigorous safety regulation and a long-standing tradition of herbal pharmacopoeia. The EU’s clampdown on contentious synthetics accelerates migration toward bio-derived antioxidants, especially in Germany and France, where pharmacies act as gatekeepers.
MEA and South America Cosmetic Antioxidants Market
South America and the Middle East, and Africa remain smaller in absolute terms. Brazilian formulators harness Amazonian biodiversity, extracting camu-camu vitamin C for brightening serums that resonate with domestic “Brazilian-glow” marketing. Gulf-region retailers, buoyed by rising female workforce participation, allocate more shelf space to multifunctional day creams that combine SPF and antioxidant protection to combat desert pollution.
Value Chain Analysis
Cosmetic antioxidant value chains start with petrochemical and oleochemical feedstocks for synthetic molecules (for example, BHT and tocopherol derivatives) and with agricultural and marine biomass for polyphenol- and carotenoid-rich extracts. Upstream participants include botanical growers and collectors, fermentation and biotech developers (including recombinant routes for molecules such as hydroxytyrosol), and chemical manufacturers supplying intermediates; midstream players encompass extractors using green-chemistry processes, specialty ingredient formulators and encapsulation houses, and analytical laboratories running oxidative-stability, microbiology, and safety testing to support Cosmetic Product Safety Reports.
Downstream, ingredient distributors and application labs supply contract manufacturers and brand owners across skin care, hair care, and nutri-cosmetics, with documentation (INCI, allergen statements, traceability files, and certification packs such as COSMOS/NATRUE where relevant) moving with the material. Key bottlenecks include variable natural raw material quality and yields, the cost and lead time of efficacy and stability validation for biotech actives, and region-specific compliance screening as EU cosmetics rules are updated (for example, European Commission amendments to Regulation (EC) No 1223/2009 in 2026). These pressures strengthen the pull of large suppliers with global regulatory support and encourage multi-sourcing, longer-term grower contracts, and standardization of botanical extracts for more consistent antioxidant performance.
Competitive Landscape
The market is moderately fragmented. Strategic moves center on supply-chain resilience and decarbonization. Global players erect barriers through global compliance support, on-demand formulation services, and just-in-time logistics. Market fragmentation below the top tier remains moderate, with niche specialists supplying territorial botanicals or patented encapsulation vehicles.
Cosmetic Antioxidants Industry Leaders
-
BASF
-
dsm-firmenich
-
Evonik Industries AG
-
Croda International Plc
-
Symrise
- *Disclaimer: Major Players sorted in no particular order

Cosmetic Antioxidants Market Companies Covered in this Report
- ADM
- Ashland
- BASF
- Croda International Plc
- dsm-firmenich
- Eastman Chemical Company
- Evonik Industries AG
- Kemin Industries, Inc.
- Lonza Group
- Sabinsa
- Seppic
- Symrise
- The Lubrizol Corporation
- Wacker Chemie AG
Market Opportunities and Future Outlook
White space is opening around higher-efficacy and more stable delivery systems for antioxidants used in anti-pollution and blue-light defense claims, as brands broaden beyond classic anti-aging positioning. In South Korea, Kolmar Korea reported development of a new antioxidant material, TOT (Tocopherol-Oxalate-Tocopherol), with Jeonbuk National University using smart liposome delivery (April 2026), which points to continued investment in encapsulation approaches that improve performance while helping formulators manage oxidation challenges commonly associated with vitamin C and polyphenols.
Sourcing and compliance requirements also create pull for suppliers that can deliver traceable, sustainability-aligned natural antioxidants at scale, especially for botanical and fermentation-derived inputs used in clean-label portfolios. EU sustainability and due-diligence programs, along with the shift toward regenerative agriculture, upcycling, and biotech fermentation, are pushing antioxidant procurement toward auditable supply chains and circular feedstocks, including inputs derived from up-cycled plant materials (for example, olive-derived phenolics referenced in market narratives). New efficacy benchmarks for alternative lipid and antioxidant systems are also emerging, including C16 Biosciences releasing independent test data for Torula Oil in standardized in vitro DPPH assays (July 2026), which supports product development pathways that reduce reliance on constrained natural resources and helps D2C-forward beauty brands differentiate antioxidant messaging.
Recent Industry Developments in Cosmetic Antioxidants Market
- April 2026: BASF highlighted Plantigenix Bisabolol and a biomass-balance version of Uvinul T 150 X EcoBalanced at in-cosmetics Global 2026. The launch activity underscores how major suppliers are coupling soothing and oxidative-stress narratives with sustainability-positioned platforms for UV-protection systems that rely on antioxidant support for photostability.
- April 2025: Evonik announced MaquiGlow, a new natural-origin antioxidant platform derived from maqui fruit, at in-cosmetics Global 2025. This move expands Evonik's clean-label antioxidant toolkit and strengthens options for brands seeking validated performance from botanical inputs.
- October 2024: BASF launched Pepsensyal, a synthetic peptide positioned for anti-aging skin care. The introduction reflects continued innovation on the synthetic and biotech-adjacent side of actives where suppliers aim to deliver differentiated efficacy while brand owners manage reformulation pressure and ingredient list scrutiny.
Cosmetic Antioxidants Market Report Scope and Research Methodology
Market Definition and Coverage
This market counts the value of antioxidant ingredients used in cosmetic and personal care formulations, where the ingredient is purchased and used to protect the formula or deliver skin and hair related benefits in finished products.
Scope exclusions: It excludes the retail value of finished beauty products and also excludes antioxidants used mainly for food, feed, pharma, or industrial uses.
Segments Covered in This Report
- By Source
- Natural
- Synthetic (Chemically-Derived)
- By Type
- Vitamins
- Polyphenols
- Enzymes
- Carotenoids
- Other Types (Peptides, CoQ10, etc.)
- By Function
- Anti-aging
- UV-Protection / Photo-stabilisation
- Anti-pollution and Blue-light Defense
- Moisturisation and Barrier-repair Support
- By Application
- Skin Care
- Hair Care
- Injectables / Nutri-cosmetics
- Make-up and Body Care
- By Geography
- Asia-Pacific
- China
- India
- Japan
- South Korea
- Rest of Asia-Pacific
- North America
- United States
- Canada
- Mexico
- Europe
- Germany
- United Kingdom
- France
- Italy
- Rest of Europe
- South America
- Brazil
- Argentina
- Rest of South America
- Middle-East and Africa
- Saudi Arabia
- South Africa
- Rest of Middle-East and Africa
- Asia-Pacific
Data Sources, Market Sizing, and Validation
Desk Research
We started by setting the market boundary using publicly available ingredient and cosmetics references, so the same definition can be applied across regions and years. Common starting points included sources such as the US FDA cosmetics resources, the European Commission Cosmetics Regulation pages, and the International Cosmetic Ingredient Dictionary (INCI) naming conventions used across product labels.
To anchor demand signals, we reviewed public trade and production indicators such as UN Comtrade for ingredient trade flows and national statistics offices for manufacturing and price indices, and then we cross checked with peer reviewed papers that discuss antioxidant types like vitamins, polyphenols, enzymes, and carotenoids in cosmetic use. Company annual reports, investor presentations, and reputable press coverage were used to understand portfolio focus and application shifts in skin care and hair care. Where gaps remained, paid databases for company financials, patent databases, and shipment level import export information were used selectively to confirm trends and remove obvious outliers. The named desk sources are illustrative only, and many other public documents were also referred to for data collection, validation, and research clarification.
Primary Interviews and Surveys
Primary work was used to sanity check what desk research cannot show clearly, such as average selling price movement for cosmetic grade antioxidants and the mix shift between natural and synthetic sourcing. We spoke with ingredient suppliers, distributors, formulators, and brand side teams across key regions so usage rates, substitution, and regulatory driven reformulation could be confirmed before finalizing the model.
Distribution of primary research fieldwork respondents
| Company type | Respondent position | Region |
|---|---|---|
| Top tier: 35% | CXOs: 14% | APAC: 41% |
| Mid tier: 51% | Functional/Unit leaders: 37% | EMEA: 32% |
| Smaller Players: 14% | Managers: 49% | Americas: 27% |
Market-Sizing & Forecasting
Market sizing was built using a top-down and bottom-up logic, where we first reconstructed the addressable ingredient demand pool from cosmetics production and trade signals, and then used conversion factors to isolate antioxidant ingredient value. For the top-down step, we linked regional cosmetics and personal care output, product mix, and reformulation trends to an estimated antioxidant inclusion rate, which was then translated into ingredient value using typical price bands by antioxidant type.
Bottom-up checks were added to keep totals realistic, using supplier revenue cues, channel discussions, and sampled calculations such as average price per kilogram times estimated volume for key antioxidant groups. When a country level data point was missing, proxy indicators like neighboring market import patterns, manufacturing growth, and label claims trends were used, and then adjusted through interview feedback. The model relied on practical inputs such as the split between skin care and hair care demand, the natural versus synthetic mix, typical dosage ranges by function (anti-aging, UV protection, barrier support), and pricing differences across vitamins, polyphenols, enzymes, and carotenoids. Forecasts were produced using scenario analysis, where variables like clean label adoption, regulatory pressure on certain synthetics, and cost inflation were set into a base case and then stress tested with conservative and aggressive paths described by interviewees.
Data Validation & Update Cycle
We validated outputs by checking whether growth rates and shares aligned with independent signals such as trade movement, cosmetics output momentum, and observed formulation shifts discussed by practitioners. Large variances were flagged, assumptions were revisited, and respondents were re-contacted when a key input like pricing progression or application mix appeared inconsistent with other evidence.
Before sign-off, the model and narrative go through a multi step internal review, with cross checks across regions to ensure the same scope logic is applied. Reports are refreshed annually, and interim updates are made when material events occur that can change demand or pricing. Right before delivery, a final pass is completed so clients receive the latest updated view.
Mordor Intelligence's Cosmetic Antioxidants Market Sizing Compared With Other Published Estimates
Published market sizes for cosmetic antioxidants can look far apart because groups do not always count the same ingredient scope, and they also differ on what year they call the starting point. Some estimates are built closer to finished product value signals, while others stay at the ingredient level, which naturally changes the total.
The benchmark table shows a tighter 2026 value because, in Mordor Intelligence's model, only antioxidant ingredients sold into cosmetic and personal care formulations are counted, and adjacent finished product revenues are not included. The other differences usually come from how natural versus synthetic pricing is handled, whether injectables and nutri-cosmetics are treated as in scope, and how currency conversion timing is applied when building multi-region totals.
Benchmark comparison
| Source | Market Size | Gaps in Research Methodology |
|---|---|---|
| Mordor Intelligence | USD 155.8 M (2026) | |
| Industry Association A | USD 182.0 M (2026) | This figure appears to expand the counted value by blending some finished product formulation value and not separating pure ingredient sales from broader functional cosmetic claims. |
| Trade Journal B | USD 139.0 M (2026) | This estimate is typically narrower, often focusing on a smaller set of antioxidant types like vitamins and excluding parts of the demand pool such as injectables and nutri-cosmetics, which reduces the total. |
Across the three numbers, the spread is explained more by what gets counted and how pricing is assumed than by disagreement on overall beauty demand. By keeping the scope tied to ingredient sales and by cross checking prices and usage assumptions with industry participants, the approach stays traceable to clear variables and can be repeated when the market changes.
Key Questions Answered in the Report
What is the current size of the cosmetic antioxidants market?
The cosmetic antioxidants market is valued at USD 155.8 million in 2026 and is forecast to reach USD 204.82 million by 2031 at a 5.62% CAGR.
Which antioxidant type is growing the fastest?
Polyphenols lead growth with a projected 6.88% CAGR, outpacing vitamin E due to superior bioavailability and multifunctional benefits.
Why is Asia-Pacific crucial for suppliers?
Asia-Pacific commands roughly 38.76% of global demand and posts the highest regional CAGR, driven by sophisticated beauty rituals and supportive regulatory frameworks.
How are regulations shaping ingredient choices?
EU limits on BHT and bans on BHA accelerate the shift toward natural and biotech-derived antioxidants, prompting global brands to reformulate.