
Corneal Pachymetry Market Size and Share
Market Overview
| Study Period | 2020 - 2031 |
|---|---|
| Market Size (2026) | USD 334.48 Million |
| Market Size (2031) | USD 419.2 Million |
| Growth Rate (2026 - 2031) | 4.62 % |
| Fastest Growing Market | Asia-Pacific |
| Largest Market | North America |
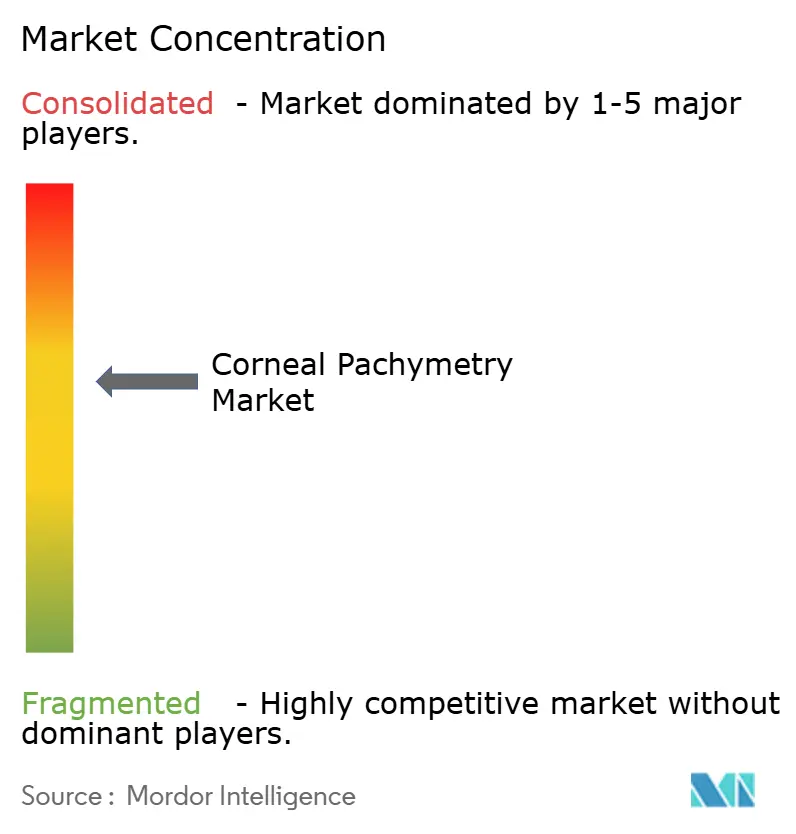
| Market Concentration | Medium |
Major Players *Disclaimer: Major Players sorted in no particular order Image © Mordor Intelligence. Reuse requires attribution under CC BY 4.0. | |
Corneal Pachymetry Market Analysis by Mordor Intelligence
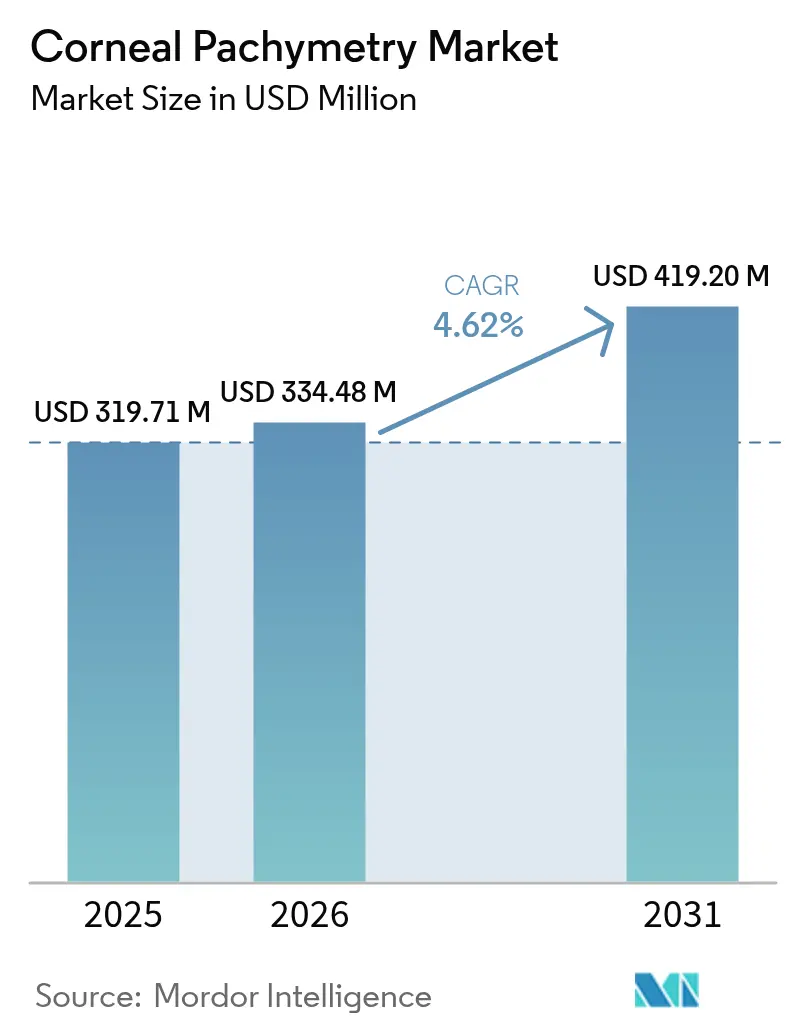
The Corneal Pachymetry Market size is expected to grow from USD 319.71 million in 2025 to USD 334.48 million in 2026 and is forecast to reach USD 419.2 million by 2031 at 4.62% CAGR over 2026-2031.
Growth stems from the everyday use of corneal‐thickness measurement in glaucoma management, rising refractive‐surgery volumes, and a steady transition from ultrasonic to optical coherence tomography (OCT)-based systems. Hospitals, clinics, and ambulatory centers seek faster, contact-free devices that fit seamlessly into digital workflows, while aging populations and higher myopia prevalence keep procedure demand elevated. At the same time, faster reimbursement approvals in mature economies and expanding eye-care capacity in Asia support wider access to these diagnostics. Technology suppliers focus on AI integration and cloud connectivity to differentiate, but regulatory compliance costs and data-privacy rules temper near-term momentum.
Key Report Takeaways
- By type, ultrasonic methods held 55.62% of the corneal pachymetry market share in 2025; optical methods are projected to expand at a 6.89% CAGR through 2031.
- By application, glaucoma diagnostics led with 60.55% revenue share in 2025, while keratoconus and ectasia screening is advancing at an 7.71% CAGR.
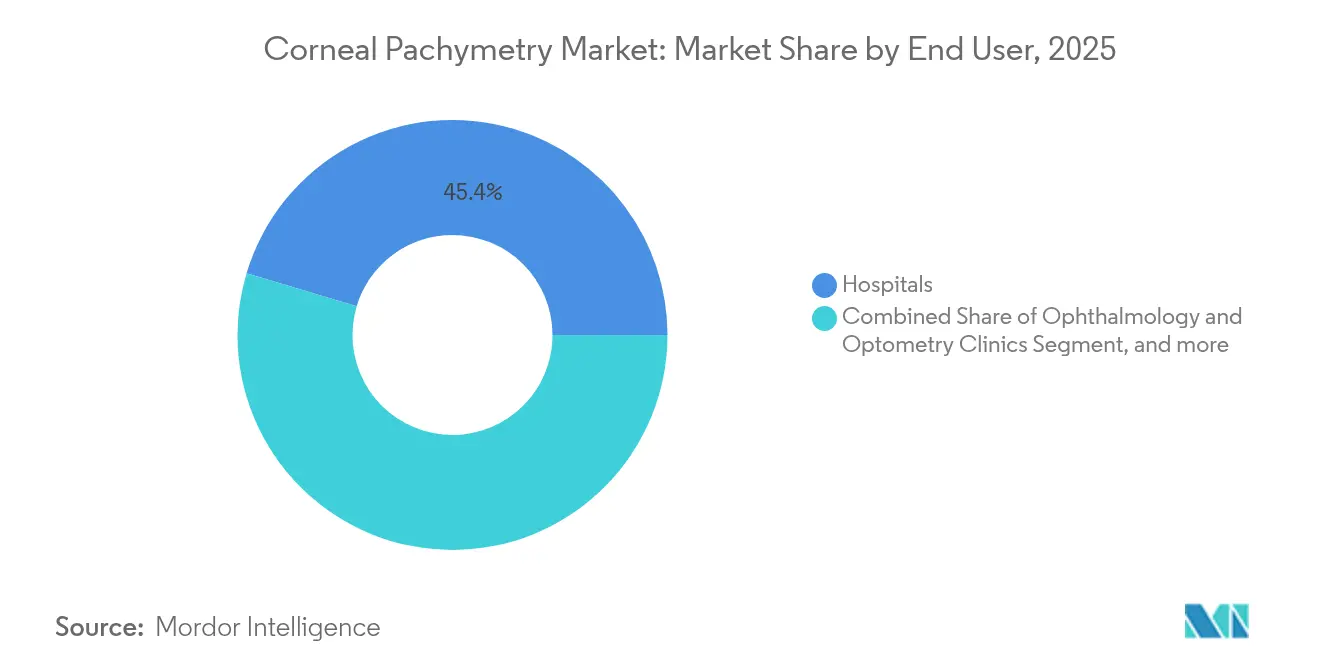
- By end user, hospitals captured 45.36% share of the corneal pachymetry market size in 2025; ambulatory surgical centers represent the fastest segment with an 8.12% CAGR.
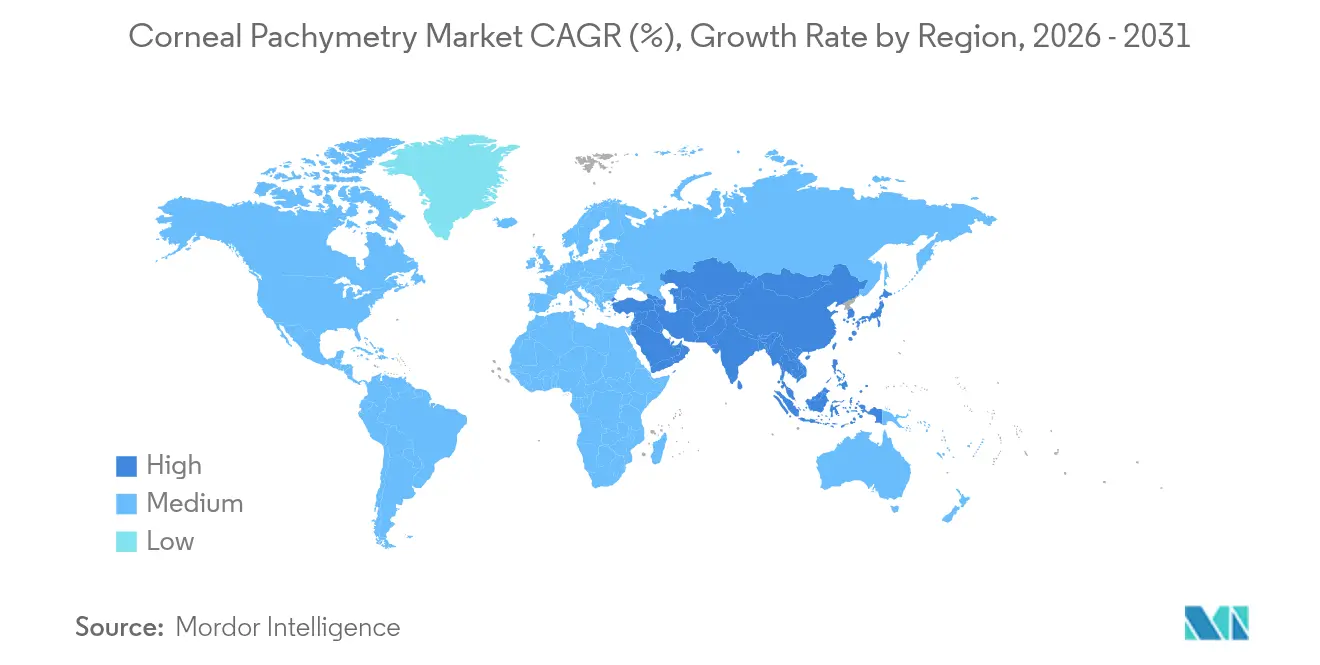
- By geography, North America commanded 38.21% of 2025 revenue; Asia-Pacific is forecast to grow at 7.32% through 2031.
Note: Market size and forecast figures in this report are generated using Mordor Intelligence’s proprietary estimation framework, updated with the latest available data and insights as of 2026.
Market Trends and Insights
Drivers Impact Analysis of Corneal Pachymetry Market*
| Driver | (~) % Impact on CAGR Forecast | Geographic Relevance | Impact Timeline |
|---|---|---|---|
| Rise in prevalence of glaucoma & ocular hypertension | +1.2% | North America, Europe, Global | Long term (≥ 4 years) |
| Growing cataract & refractive-surgery volumes | +0.9% | Asia-Pacific, Global | Medium term (2-4 years) |
| Rapid adoption of AS-OCT & Scheimpflug non-contact systems | +0.8% | North America, EU, spill-over to APAC | Medium term (2-4 years) |
| Expansion of eye-care services in middle-income countries | +0.7% | APAC core, spill-over to MEA | Long term (≥ 4 years) |
| Tele-ophthalmology push for handheld pachymeters | +0.5% | Rural Global | Short term (≤ 2 years) |
| AI-driven IOP-correction algorithms needing real-time CCT | +0.4% | North America, EU | Medium term (2-4 years) |
| Source: Mordor Intelligence | |||
Rise in Prevalence of Glaucoma & Ocular Hypertension
Central corneal thickness (CCT) is now accepted as a critical risk factor for glaucoma, after the Ocular Hypertension Treatment Study showed a 71% rise in conversion risk for every 40 µm reduction in CCT.[1]Steve Brito, “Central Corneal Thickness and Glaucoma Risk,” Dove Press, dovepress.com Routine pachymetry screening of adults over 50, therefore, becomes a non-negotiable element of preventive eye care. Health systems in North America and Europe reimburse pachymetry when combined with tonometry, which pushes device uptake in primary and specialist settings.[2]Aetna Medical Policy Bulletin, “Corneal Pachymetry,” aetna.com Ongoing monitoring also matters because CCT changes skew intraocular-pressure readings and can lead to mismanaged therapy. As the pool of glaucoma patients doubles each decade after 40, demand for accurate thickness data will keep rising, securing a steady pipeline for the corneal pachymetry market.
Growing Cataract & Refractive-Surgery Volumes
Cataract and laser vision-correction procedures continue to climb, with Asia-Pacific contributing the largest incremental volume. Surgical guidelines treat pachymetry as mandatory since corneal biomechanics steer lens selection, incision planning and postoperative healing. Alcon’s premium intraocular-lens portfolio illustrates how precise corneal metrics lift refractive outcomes. Similarly, refractive candidates undergo corneal mapping to avoid ectasia, making thickness profiling essential for screening out high-risk eyes. AI-driven surgical planners such as ZEISS VERACITY now import pachymetry data automatically, cutting chair time and lowering complication rates. These workflow linkages add repeat purchase drivers for advanced pachymeters.
Rapid Adoption of AS-OCT & Scheimpflug Non-Contact Systems
New optical platforms offer sub-5 µm repeatability without corneal contact, eliminating anesthesia risk and boosting patient comfort. Anterior-segment OCT supplies cross-sectional images that help surgeons gauge flap depth, angle, anatomy, and stromal remodeling.[3]Mary Smith, “Repeatability of AS-OCT Measurements,” MDPI Diagnostics, mdpi.com Scheimpflug cameras, typified by the Pentacam family, spot early keratoconus with tomographic maps that pick up curvature irregularities missed by ultrasound probes. Clinics value multipurpose use because a single device measures CCT, lens density, and anterior-chamber depth, raising return on investment. AI modules further reduce technician variability, adding momentum to the optical shift and lifting the corneal pachymetry market.
Expansion of Eye-Care Services in Middle-Income Countries
Government funding in China and India backs specialty hospitals, ambulatory centers, and tele-ophthalmology networks, which all require portable pachymeters. China’s state-directed healthcare investment fund has poured capital into vision-care consolidators, accelerating device procurement. Alcon’s Phaco Development program, which has trained more than 6,300 professionals in Asia-Pacific, speeds the clinical adoption curve by pairing technology supply with surgeon education. Outpatient cataract packages gain favor because they reduce cost and waiting time, so centers opt for handheld, battery-powered pachymeters that cover screening, surgery, and postoperative follow-up on one platform. The result is a rising share of global revenue flowing from emerging economies.
Restraints Impact Analysis of Corneal Pachymetry Market*
| Restraint | (~) % Impact on CAGR Forecast | Geographic Relevance | Impact Timeline |
|---|---|---|---|
| Inadequate reimbursement for pachymetry procedures | -0.8% | Emerging markets, Global | Long term (≥ 4 years) |
| Stringent device & data-privacy regulations | -0.6% | North America, EU | Medium term (2-4 years) |
| Lack of interoperability across imaging platforms | -0.4% | Integrated health systems | Short term (≤ 2 years) |
| Emergence of corneal-biomechanics devices as a substitute | -0.3% | North America, EU, spill-over to APAC | Medium term (2-4 years) |
| Source: Mordor Intelligence | |||
Inadequate Reimbursement for Pachymetry Procedures
Coverage gaps hinder routine use because many payers only reimburse pachymetry when linked to specific diagnoses. Medicare contractors vary widely in their local rules, and some private insurers tag pachymetry as investigational for screening, forcing providers to self-pay or forego testing. The financial uncertainty discourages primary-care clinics from including pachymetry in comprehensive eye exams, especially in emerging markets where out-of-pocket spending remains high. Without consistent payment codes the corneal pachymetry market cannot reach its full preventive-care potential.
Stringent Device & Data-Privacy Regulations
Design changes mandated by the FDA Quality System Regulation amendments that take effect in February 2026 will raise compliance costs, particularly for smaller innovators. In Europe, medical-device manufacturers also wrestle with General Data Protection Regulation rules, which compel robust encryption and strict consent protocols for cloud-based analytics. The dual burden of product safety testing and cybersecurity documentation lengthens time-to-market and may slow the refresh cycle for new pachymetry models.
*Our forecasts treat driver/restraint impacts as directional, not additive. The impact forecasts reflect baseline growth, mix effects, and variable interactions.
Corneal Pachymetry Market Segment Analysis
By Type:
Optical Methods Drive Technology TransitionUltrasonic pachymeters generated the majority of revenue, holding 55.62% of the corneal pachymetry market in 2025. Clinics appreciate their low price point and proven performance in edematous or scarred corneas. However, optical systems outpace them with a 6.89% CAGR, underscoring a clear pivot toward non-contact care. Occuity’s PM1 handheld device illustrates the user pull; clinical validation shows sub-5 µm repeatability without topical anesthesia. Optical units also deliver pachymetric maps, keratometry, and angle analysis in a single scan, enriching surgical planning.
Optical platforms pair naturally with telemedicine because technicians can capture scans and send raw data to remote experts for interpretation. AI overlays flag thinning zones and suggests keratoconus probability scores, which elevates diagnostic precision in high-throughput settings. As clinician confidence grows, and as service contracts bundle cloud analytics, optical share will keep expanding. Nevertheless, ultrasound retains a foothold for intraoperative measurement, especially in cases with corneal opacity where light-based devices struggle. The coexistence of both technologies therefore broadens the total corneal pachymetry market size without immediate cannibalization.


By Application:
Keratoconus Screening Emerges as Growth DriverGlaucoma diagnostics remained the most significant use case, bringing in 60.55% of 2025 revenue. Accurate CCT data recalibrate tonometry readings and refine risk scoring, so ophthalmologists incorporate pachymetry at every visit for patients with ocular hypertension. The corneal pachymetry market size linked to this task is stable, but incremental volume gains align with population aging. Refractive surgery planning is the next major segment because surgeons must rule out subclinical ectasia before corneal reshaping. Postoperative monitoring and corneal graft follow-up also rely on thickness trending to detect edema or rejection.
Keratoconus and ectasia screening stands out with an 7.71% growth rate. Multi-parameter indices mix pachymetric and biomechanical variables to spot disease earlier than topography alone. This need pulls high-resolution systems into optometry chains where young myopes first present, expanding the market’s addressable base. Insurers in some European markets now reimburse early keratoconus screening when combined with corneal tomography, creating a clear financial rationale. As awareness widens and contact-lens discomfort drives patients toward cross-linking, volumes should stay on a steep trajectory, deepening the corneal pachymetry market.
By End User:
Ambulatory Centers Lead Adoption TrendsHospitals still dominate sales, holding 45.36% revenue share because they handle complex corneal surgery, transplantation and trauma. Large academic centers integrate pachymetry into multimodal imaging suites that manage glaucoma clinics, cataract lanes and corneal specialty work. They also conduct clinical trials requiring longitudinal thickness tracking, further supporting unit demand. Clinics run by ophthalmologists and optometrists follow closely, using pachymetry for routine disease management and surgical comanagement.
Ambulatory surgical centers (ASCs) are the expansion hot spot, posting an 8.12% CAGR. Medicare counted 3.4 million beneficiaries treated in ASCs during 2023, and ophthalmology made up 18.5% of the volume. ASCs value portable or cart-mounted pachymeters that move easily between procedure rooms and pre-op bays, letting staff collect CCT data without slowing flow. Lower overhead and bundled payment models encourage device purchases when they shorten case duration. As more cataract and laser vision-correction work leaves hospitals, ASCs will claim a rising slice of the corneal pachymetry market share.
Geography Analysis
North America Corneal Pachymetry Market
North America accounted for 38.21% of global revenue in 2025, anchored by high disposable income, insurance coverage, and established glaucoma screening guidelines. Medicare reimburses pachymetry linked to tonometry under CPT 76514, and private insurers follow similar rules, sustaining baseline demand. Clinics routinely upgrade to OCT-based platforms for integrated anterior-segment imaging, making the region a reliable early adopter of AI-enhanced workflows. FDA guidance is stringent but predictable, giving suppliers a clear development path and plenty of post-market feedback for product refinement.
Europe Corneal Pachymetry Market
Europe offers a mature but innovation-friendly landscape. Aging demographics increase cataract load, while public health systems prefer preventive checks that delay costly vision loss. CE-marked pachymeters gain access across member states, although compliance with the European Medical Device Regulation adds paperwork and cybersecurity safeguards. EssilorLuxottica’s acquisition of Heidelberg Engineering underscores the strategic value of imaging within integrated eye-care portfolios. University hospitals in Germany and Italy spearhead research on tomography-based keratoconus screening, keeping the region at the forefront of clinical evidence generation.
APAC Corneal Pachymetry Market
Asia-Pacific is expanding fastest, clocking a 7.32% CAGR. China funds ophthalmology chains to widen service reach, with investment banks noting steady deal flow in the sector. Rising myopia among children and young adults lifts demand for corneal assessment in refractive-surgery planning. Government insurance schemes in Japan cover pachymetry when used for glaucoma management, while private hospitals in India advertise LASIK packages that bundle complete corneal mapping. Training programs sponsored by multinationals accelerate device literacy, ensuring that local clinicians can extract full value from advanced pachymeters. The region, therefore, shapes the longer-term revenue shift within the corneal pachymetry market.

Regulatory Landscape
Corneal pachymetry systems are regulated as diagnostic ophthalmic medical devices, with US market access typically proceeding through FDA Class II controls under 21 CFR Part 886 and 510(k) clearance supported by performance and electrical safety evidence. Manufacturers must also maintain establishment registration and device listing with the FDA on an annual cycle (October 1 to December 31), which creates recurring compliance steps for global suppliers serving US providers.
A key near-term compliance anchor is the FDA Quality Management System Regulation (QMSR), effective February 2, 2026, aligning quality system requirements more closely with ISO 13485:2016. This can affect design controls, documentation, and audit readiness for both ultrasound and optical pachymetry platforms. International standards that also show up in verification and interoperability discussions include ISO 19980:2021 for corneal topographer-related test methods and the ISO/TS 22218 series for ophthalmic device data output, which becomes more relevant as pachymetry data is routed into cloud analytics and EHR-connected workflows under tightening privacy and cybersecurity expectations, particularly in Europe under GDPR and EU MDR technical documentation requirements.
Competitive Landscape
The market remains moderately fragmented, with the top five suppliers holding significant combined revenue. Carl Zeiss Meditec, Topcon, NIDEK, Haag-Streit, and Oculus command mind share through optical platforms that link imaging with analytics. Zeiss deepened its surgical workflow offering by acquiring Dutch Ophthalmic Research Center, thereby bundling diagnostics with intraoperative tools. Topcon integrates pachymetry into its Maestro series, promoting one-stop exams for busy clinics.
Regional entrants carve out niches in handheld and value-tier ultrasound segments, while startups chase AI overlays that identify corneal disease with minimal operator input. Big Vision Medical raised USD 30 million to build a cloud-based screening platform that targets optometry chains. Portable units appealing to mobile screening programs add another competitive layer, with Occuity and other sensor innovators vying for price-performance leadership.
Strategic partnerships between device makers and software firms accelerate feature rollouts, especially for image sharing and electronic-record integration. Suppliers also court ambulatory centers with pay-per-use or rental models that lower upfront cost. The resulting arena rewards companies that balance global service networks with agile upgrades, keeping the corneal pachymetry market dynamic yet open to new entrants.
Corneal Pachymetry Industry Leaders
Reichert Inc.
Sonomed Escalon
DGH Technology, Inc
NIDEK Co. Ltd.
Lumibird Group (Quantel Medical)
- *Disclaimer: Major Players sorted in no particular order
Corneal Pachymetry Market Companies Covered in this Report
- Topcon
- Carl Zeiss
- DGH Technology
- NIDEK Co. Ltd.
- Reichert Inc. (AMETEK)
- TOMEY Corporation
- Lumibird Group
- Sonomed Escalon
- Heidelberg Engineering
- OCULUS Optikgeräte GmbH
- Accutome (Halma plc)
- HAAG-Streit
- Micro Medical Devices
- Optovue Inc.
- Canon
- Optikon S.p.A.
- Occuity Ltd.
- Sonostar Technologies
- Keeler Ltd.
- Alcon

Market Opportunities and Future Outlook
White-space is forming around turning corneal thickness capture into a broader, software-led anterior-segment assessment workflow, particularly where clinics want contact-free scans that feed automated analytics. The market already shows a measurable shift toward optical methods, which outpace ultrasound growth in the current segmentation mix. That supports vendor opportunity to package AS-OCT or Scheimpflug pachymetry with AI decision support for keratoconus and ectasia screening, which the report context flags as the fastest-growing application. One supporting evidence anchor for this direction is 2026 peer-reviewed validation work on AI architectures for keratoconus detection using dynamic corneal imaging data (CORVIS), which supports demand for systems that can export structured data into algorithm-ready pipelines rather than only delivering point thickness values.
A second opportunity sits in distributed eye-care delivery, where portable devices and tele-ophthalmology workflows reduce dependence on specialist-site equipment, aligning with the report's identified push for handheld pachymeters in rural and high-throughput settings. Reimbursement and guideline nuance remains a practical gate. For example, Medicare coverage is tied to specific indications, and the European Glaucoma Society guidance acknowledges central corneal thickness without endorsing simple CCT-adjusted IOP values, increasing the need for clinical decision support that is transparent, standards-aligned, and defensible in documentation. Vendors that meet these constraints while improving interoperability via ophthalmic data standards (ISO/TS 22218) and QMS harmonization under the FDA QMSR framework are positioned to expand placements in clinics and ambulatory surgical centers that prioritize speed, infection-control simplicity, and digital transfer into surgical planning and longitudinal glaucoma management.
Recent Industry Developments in Corneal Pachymetry Market
- May 2026: AMETEK Reichert announced integration of its SightChek Digital Phoroptor with the DigitalOptometrics tele-optometry platform to extend remote refraction workflows. While not a pachymeter launch, the announcement shows ongoing investment in connected, exam-lane tools that can pull diagnostic measurements into cloud-enabled care delivery models. This direction can influence purchasing criteria for adjacent anterior-segment diagnostics.
- March 2025: Alcon announced the acquisition of Lensar, adding femtosecond laser-assisted cataract surgery capabilities to its surgical portfolio. The deal strengthens Alcon’s end-to-end operating room stack, which can increase demand for tightly integrated pre-op corneal assessment data, including pachymetry, inside comprehensive surgical planning workflows.
- July 2024: EssilorLuxottica acquired a majority stake in Heidelberg Engineering, expanding its footprint in ophthalmic diagnostic imaging. The transaction supports broader platform bundling across optometry and ophthalmology settings, which raises competitive pressure for pachymetry solutions that integrate smoothly with multimodal imaging and practice software environments.


Corneal Pachymetry Market Report Scope and Research Methodology
Market Definition and Coverage
For this study, the market covers revenue generated from corneal pachymetry measurement systems that are used to measure corneal thickness in clinical and surgical eye care settings.
Scope exclusions: We exclude standalone general eye imaging platforms that do not provide pachymetry thickness measurement as a core function, along with procedure fees and broader ophthalmology services revenue.
Segments Covered in This Report
- By Type
- Ultrasonic Method
- Optical Method
- By Application
- Glaucoma Diagnostics
- Refractive Surgery Planning
- Keratoconus & Ectasia Screening
- Post-operative Corneal Edema Monitoring
- Corneal Transplant Evaluation
- By End User
- Hospitals
- Ophthalmology & Optometry Clinics
- Ambulatory Surgical Centres
- Academic & Research Institutes
- By Geography
- North America
- United States
- Canada
- Mexico
- Europe
- Germany
- United Kingdom
- France
- Italy
- Spain
- Rest of Europe
- Asia-Pacific
- China
- Japan
- India
- Australia
- South Korea
- Rest of Asia-Pacific
- Middle East & Africa
- GCC
- South Africa
- Rest of Middle East & Africa
- South America
- Brazil
- Argentina
- Rest of South America
- North America
Data Sources, Market Sizing, and Validation
Desk Research
Desk work started with public clinical and epidemiology signals that shape demand for corneal thickness measurement, especially around glaucoma workups and preoperative screening. We reviewed sources such as the World Health Organization, the US Centers for Disease Control and Prevention, and national health statistics portals that track eye health burden and care access.
To ground device adoption and practical use patterns, we also checked guidance and publications from the American Academy of Ophthalmology, peer reviewed journals indexed in PubMed, and regulatory databases such as the US FDA device listings and recalls. Company filings, investor decks, and credible press were used to understand product availability and sales positioning, and a paid subscription for company financials and news helped cross-check timelines and market moves. The desk sources listed here are illustrative only, and additional public references were used to collect, confirm, and clarify the final assumptions.
Primary Interviews and Surveys
Primary work focused on interviews and short surveys with ophthalmologists, optometrists, clinic managers, and distributor and service-side contacts who see purchasing cycles and installed-base replacement decisions. We covered key regions so that the pricing mix, modality preference (ultrasonic versus optical), and usage by application could be validated, and then the desk assumptions were adjusted where repeated interview feedback pointed to gaps.
Distribution of primary research fieldwork respondents
| Company type | Respondent position | Region |
|---|---|---|
| Top tier: 27% | CXOs: 16% | APAC: 52% |
| Mid tier: 55% | Functional/Unit leaders: 29% | EMEA: 29% |
| Smaller Players: 18% | Managers: 55% | Americas: 19% |
Market-Sizing & Forecasting
Sizing begins with a top-down demand build that reconstructs the addressable testing pool by linking eye-care visit volumes to the share of patients who typically undergo corneal thickness measurement for glaucoma assessment, refractive surgery planning, and keratoconus screening. After that demand pool is built, we translate it into device value by applying realistic utilization, replacement timing, and average selling price ranges that were checked through interviews.
We then use selective bottom-up approximations to corroborate totals, including sampled pricing checks by region and channel, plus supplier-side indications on shipment direction and installed-base replacement intensity. Key inputs (illustrative) include procedure volumes in refractive and cataract settings, glaucoma screening intensity, adoption split between ultrasonic and optical methods, typical device life and service cycles, and region-level price mix that shifts with outpatient expansion.
For forecasting, we used scenario analysis to keep the outlook practical, and drivers were adjusted based on how clinicians and buyers described budget cycles and throughput trends. When bottom-up signals were incomplete for smaller channels or emerging markets, we handled gaps by applying conservative penetration assumptions, then re-checking the implied per-site device counts with field feedback.
Data Validation & Update Cycle
Validation is done through multiple checks so the final numbers stay tied to real-world care delivery. We compare model outputs against independent signals such as procedure trends, regional device adoption discussion in clinical literature, and price movement seen in channel conversations, and then review outliers before sign-off.
If a major variance is found, respondents are re-contacted to confirm whether the change is coming from pricing, modality mix, or a demand shift in key applications. Reports are refreshed annually, with interim updates triggered by material events such as regulatory actions, product launches, or sharp currency moves. Before delivery, a final analyst pass is completed so clients get the most current view supported by documented assumptions.
Mordor Intelligence's Corneal Pachymetry Market Size Measured Against Other Published Estimates
Published values for this market can look far apart even when the topic label is the same, because different studies use different base years, include different device scopes, and treat pricing and modality mix in different ways. The outcome also changes when one model leans more on reported revenues, while another relies more on broader demand proxies.
The main gap comes from whether adjacent corneal measurement tools are blended into the total and whether pricing is carried forward using a flat ASP or a region and channel mix that shifts over time. This is also where Mordor Intelligence focuses on corneal pachymetry measurement revenue only, and re-checks the ultrasonic versus optical mix through repeated clinical and channel validation before locking the final value.
Benchmark comparison
| Source | Market Size | Gaps in Research Methodology |
|---|---|---|
| Mordor Intelligence | USD 319.71 M (2025) | |
| Global Consultancy A | USD 549.69 M (2025) | Uses a wider device interpretation that can pull in adjacent corneal diagnostics revenue, and the published value appears less constrained by procedure-linked demand checks, which can inflate the addressed pool. |
| Industry Publisher B | USD 391.90 M (2026) | Starts from a later year and often applies broader channel coverage and different modality splits, and differences in currency timing and regional price mix can push the total upward versus a tighter per-application demand build. |
Looking across the table, the spread is mainly explained by scope choices and how demand and ASP progression are translated into revenue totals. Our approach stays repeatable because each step ties back to clear application demand, usage patterns, and price mix checks that can be re-tested as the market changes.


Key Questions Answered in the Report
What is the current value of the corneal pachymetry market?
The corneal pachymetry market is valued at USD 334.48 million in 2026.
Which segment grows fastest over 2025-2031?
Keratoconus and ectasia screening shows the highest growth with an 7.71% CAGR.
Why are optical pachymeters gaining share?
Optical platforms provide contact-free measurements, richer corneal maps and AI compatibility, driving a 6.89% CAGR for the segment.
How large is North America’s share of global revenue?
North America held 38.21% of total revenue in 2025.
What factors restrain wider adoption in emerging markets?
Limited reimbursement and high device compliance costs slow uptake despite growing procedure demand.
Which end-user setting posts the highest growth?
Ambulatory surgical centers expand fastest with an 8.12% CAGR as outpatient eye surgery volumes climb.
Page last updated on:


 Your data is secure and never sold or shared.


