
Cooling Tower Rental Market Size and Share
Market Overview
| Study Period | 2021 - 2031 |
|---|---|
| Market Size (2026) | USD 1.47 Billion |
| Market Size (2031) | USD 1.97 Billion |
| Growth Rate (2026 - 2031) | 5.98 % |
| Fastest Growing Market | Asia Pacific |
| Largest Market | North America |
| Market Concentration | Medium |
Major Players *Disclaimer: Major Players sorted in no particular order Image © Mordor Intelligence. Reuse requires attribution under CC BY 4.0. | |
Cooling Tower Rental Market Analysis by Mordor Intelligence
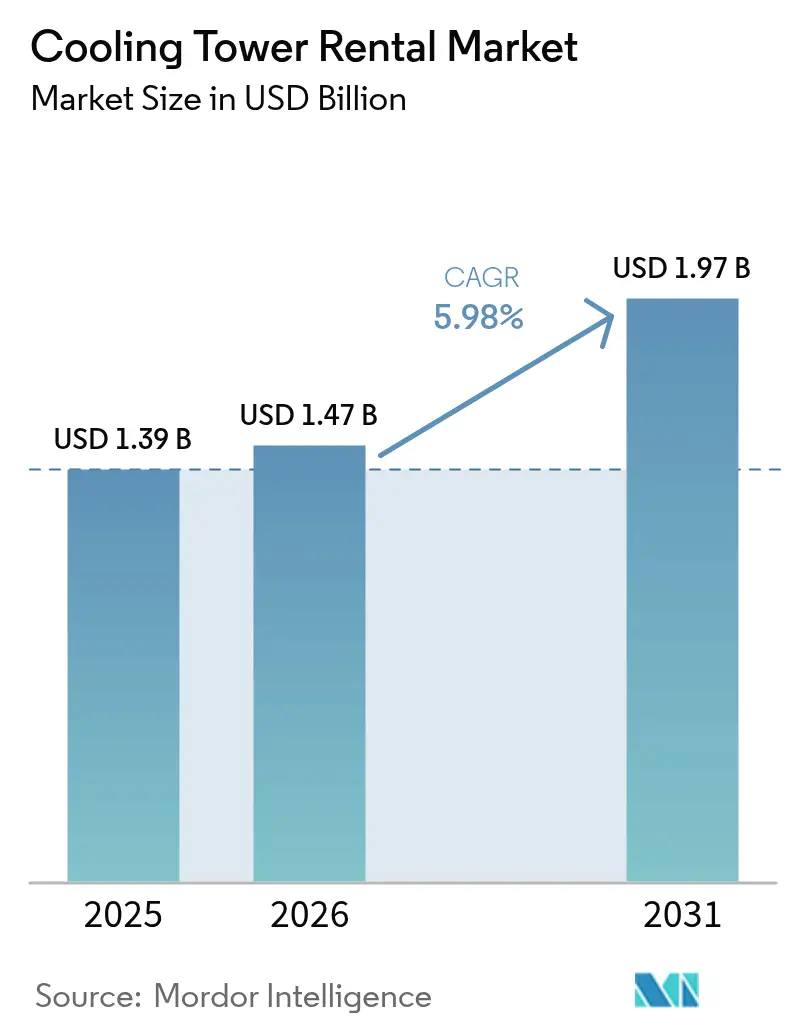
The Cooling Tower Rental Market size is expected to grow from USD 1.39 billion in 2025 to USD 1.47 billion in 2026 and is forecast to reach USD 1.97 billion by 2031 at 5.98% CAGR over 2026-2031.
Expanding data center footprints, longer industrial maintenance cycles, and climate-driven cooling needs collectively reshape the demand profile for cooling tower rentals. Providers benefit from modular tower designs that shorten installation times, while hyperscale data centers drive orders exceeding 20 MW, which in turn lift average contract values. Clients view rental cooling as an operational service rather than a fixed asset, which redirects capital budgets toward core production upgrades. Consolidation among rental specialists accelerates global coverage, although regional players continue to capture niche events that require rapid deployment.
Key Report Takeaways
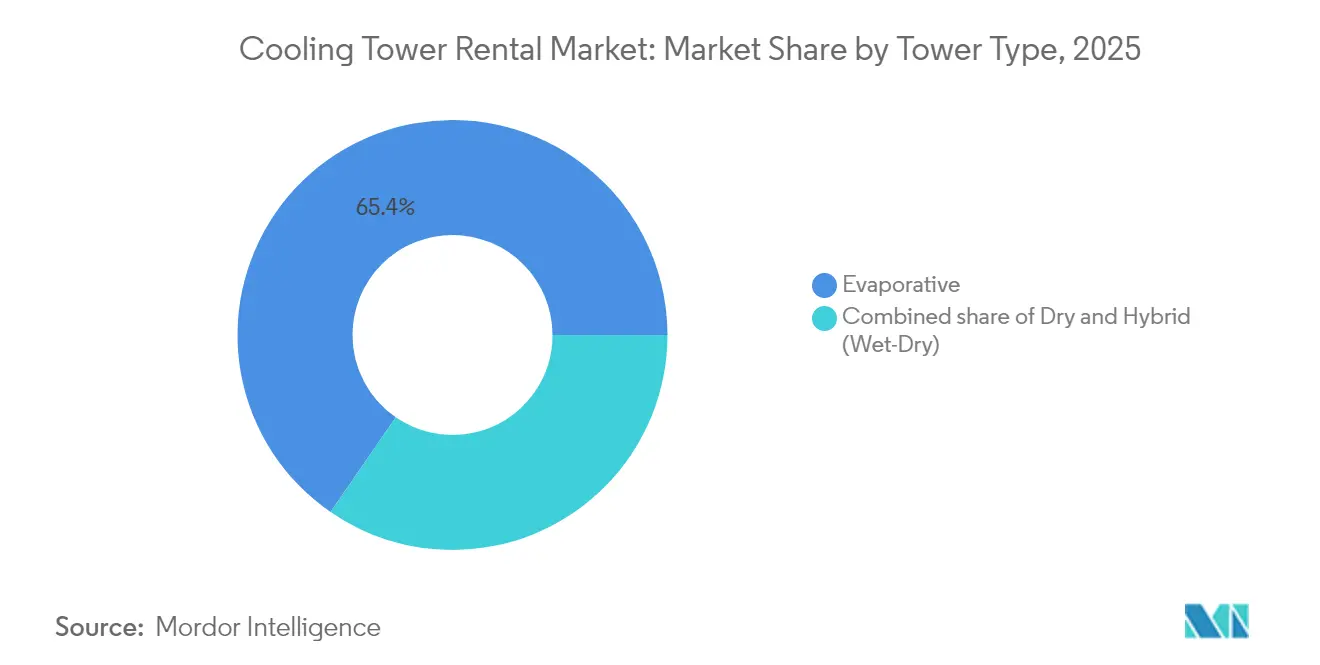
- By tower type, evaporative systems held 65.40% of the cooling tower rental market share in 2025, while hybrid towers are projected to post an 8.35% CAGR through 2031.
- By capacity range, 5-20 MW installations accounted for 42.60% of the cooling tower rental market size in 2025; units above 20 MW are projected to grow at a 7.55% CAGR through 2031.
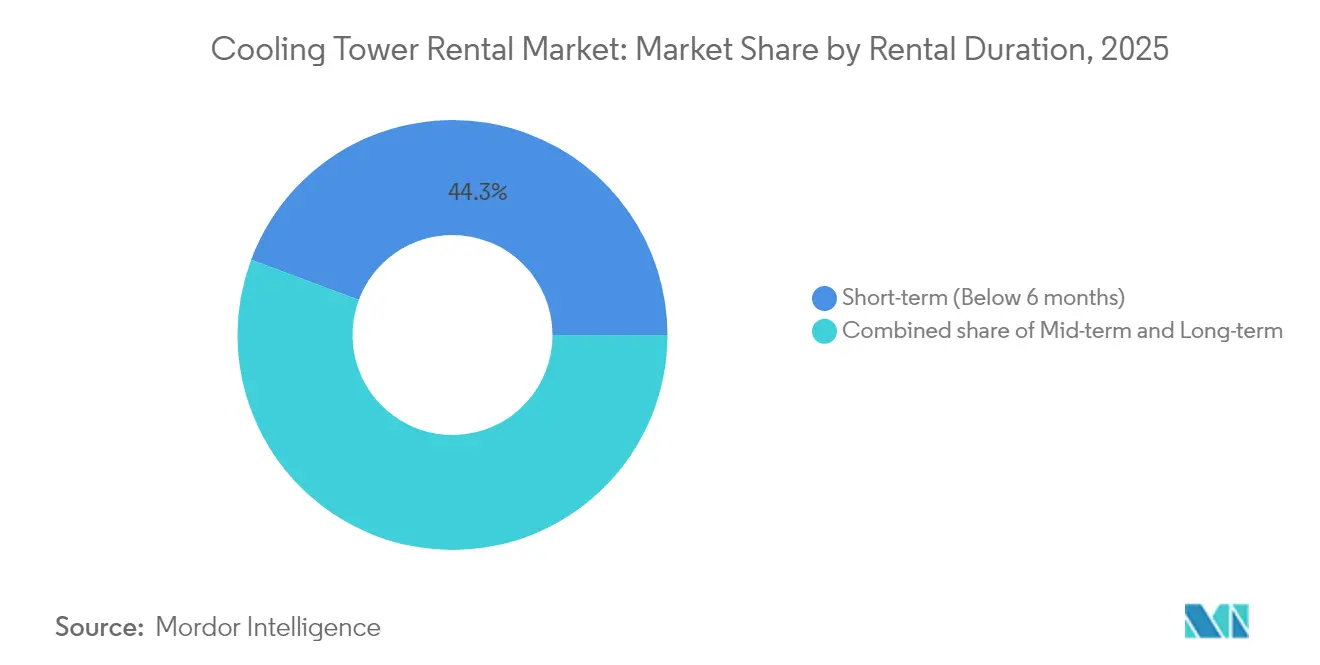
- By rental duration, short-term contracts of under six months captured a 44.30% share of the cooling tower rental market in 2025, whereas mid-term rentals of six to 24 months are expected to expand at a 7.12% CAGR.
- By end-user industry, the oil and gas sector commanded 27.40% of the cooling tower rental market size in 2025, but data centers are expected to record the fastest growth rate of 9.28% through 2031.
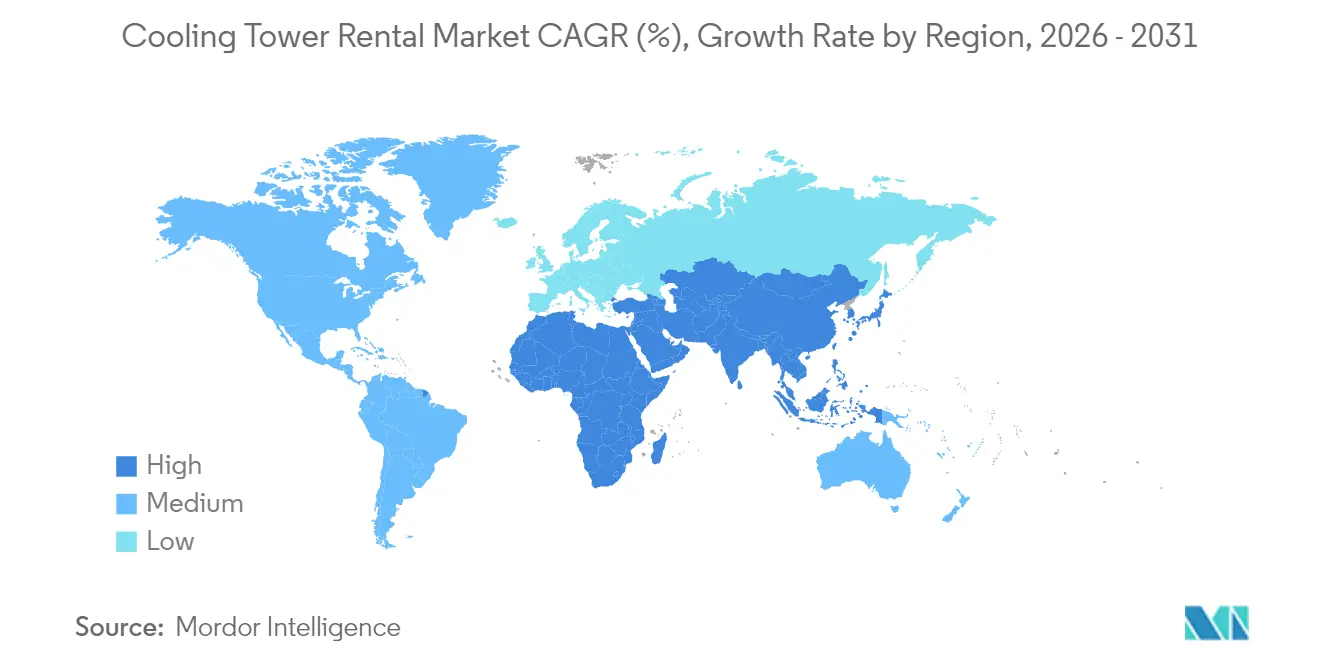
- By geography, North America led with a 36.40% revenue share in 2025; the Asia-Pacific region is forecast to register a 10.02% CAGR by 2031.
Note: Market size and forecast figures in this report are generated using Mordor Intelligence’s proprietary estimation framework, updated with the latest available data and insights as of 2026.
Market Trends and Insights
Drivers Impact Analysis of Cooling Tower Rental Market*
| Driver | (~) % Impact on CAGR Forecast | Geographic Relevance | Impact Timeline |
|---|---|---|---|
| Increasing frequency of industrial maintenance shutdowns | +1.20% | Global, with concentration in North America & Europe industrial hubs | Medium term (2-4 years) |
| Rapid build-out of data centres requiring temporary cooling redundancy | +1.80% | North America & Asia-Pacific, spill-over to Europe | Short term (≤ 2 years) |
| Stricter environmental regulations favouring high-efficiency rental towers | +0.90% | Europe & North America, early adoption in developed APAC markets | Long term (≥ 4 years) |
| Surge in mega-events in emerging economies driving short-term demand | +0.60% | Asia-Pacific & Middle East, with gains in Qatar, UAE, India | Short term (≤ 2 years) |
| Climate-induced heatwaves triggering emergency cooling deployments | +0.80% | Global, with acute impact in Middle East, Southern Europe, Southwest US | Medium term (2-4 years) |
| Modular plug-and-play designs reducing installation time and cost | +0.70% | Global, with early gains in North America, Europe, developed APAC | Medium term (2-4 years) |
| Source: Mordor Intelligence | |||
Increasing Frequency of Industrial Maintenance Shutdowns
Longer turnarounds increase temporary cooling requirements, especially within petrochemical and refining hubs, where shutdown windows now extend to eight weeks. Rental partnerships enable operators to avoid permanent capital outlays while ensuring heat-rejection reliability during overhaul periods. Contracts for refinery cooling now account for 60% of one leading provider’s industrial revenue, a shift from emergency-only demand. Vendors that bundle water treatment and on-site technicians tend to strengthen renewal rates, as clients prefer single-invoice service packages. This driver underpins baseline growth in the cooling tower rental market across mature economies.
Rapid Build-out of Data Centres Requiring Temporary Cooling Redundancy
Hyperscale projects often commission permanent chillers late in the construction process, leaving a 3- to 6-month gap in which rental towers maintain server-safe temperatures. The Asia-Pacific region added 1,622 MW of new IT load in 2024, creating an unprecedented surge in short-term rentals. Rental fleets integrate variable-speed fans and low-GWP refrigerants, enabling data center owners to meet sustainability targets during the ramp-up phase. Providers offering 24-hour remote monitoring reduce onsite staffing costs for clients operating around-the-clock facilities. These advantages position rental cooling as an essential bridge technology in the digital infrastructure buildout.(1)Cushman & Wakefield, “Global Data Center Market Comparison 2025,” cushmanwakefield.com
Stricter Environmental Regulations Favouring High-Efficiency Rental Towers
National emission and Legionella control rules increase compliance complexity for fixed towers, encouraging temporary solutions with built-in monitoring. The U.S. EPA standards on hazardous air pollutants encourage factories to adopt rental fleets equipped with high-efficiency drift eliminators. In New York, mandatory cooling-tower registries drive demand for rental units equipped with certified water-treatment protocols, thereby sparing property owners the costly expense of retrofits. Providers differentiate through IoT-enabled dosing systems that maintain water chemistry within mandated limits. These developments steadily raise the minimum performance bar in the cooling tower rental market(2)U.S. Environmental Protection Agency, “National Emission Standards for Hazardous Air Pollutants,” epa.gov
Modular Plug-and-Play Designs Reducing Installation Time and Cost
Containerised towers arrive pre-wired and pre-piped, shrinking onsite assembly from three days to less than eight hours. Quick-connect manifolds cut crane hours, a significant cost element on congested brownfield sites. Standardised skids also simplify cross-border redeployments, letting owners reposition assets to meet seasonal peaks. Faster mobilisation increases asset turnover, enhancing overall fleet utilisation and revenue yield. Vendors investing in modularity thus capture a lasting efficiency dividend.(3)SPX Technologies, “MD Everest Cooling Tower Brochure,” spx.com
Restraints Impact Analysis of Cooling Tower Rental Market*
| Restraint | (~)% Impact on CAGR Forecast | Geographic Relevance | Impact Timeline |
|---|---|---|---|
| High operating expense relative to permanent installations | -0.80% | Global, with higher sensitivity in cost-conscious emerging markets | Long term (≥ 4 years) |
| Logistics complexity for large-scale towers in remote sites | -0.50% | Global, with acute impact in remote oil & gas sites, mining locations | Medium term (2-4 years) |
| Skilled labour shortages for on-site setup and water treatment | -0.40% | North America & Europe, spill-over to developed APAC markets | Long term (≥ 4 years) |
| Growing preference for air-cooled chillers as substitute rentals | -0.30% | Global, with early adoption in water-scarce regions like Middle East | Medium term (2-4 years) |
| Source: Mordor Intelligence | |||
High Operating Expense Relative to Permanent Installations
Total rental outlays exceed ownership costs after two years in many emerging markets where low-cost labor reduces maintenance overhead for fixed towers. Capital-rich petrochemical operators in the Gulf Cooperation Council often favour ownership for projects with 10-year horizons. This cost gap challenges providers to develop energy-efficient motors and automated dosing systems that lower runtime expenses. Fleet digitalisation also cuts technician call-outs, narrowing the long-term cost delta. Price-sensitive regions will remain selective users, thereby curbing the cooling tower rental market's penetration in multi-year applications.
Logistics Complexity for Large-Scale Towers in Remote Sites
Above-20 MW towers require multi-axle trailers and heavy-lift cranes that are scarce in remote basins. Freight and rigging charges can triple the equipment fee, making rentals unattractive for some well pads and mines. Providers invest in knock-down modules that fit inside ISO containers to bypass oversize road permits. Coordinating cross-border shipments, however, still demands specialist experience and local brokerage networks. These hurdles slow adoption in frontier geographies despite latent demand.
*Our forecasts treat driver/restraint impacts as directional, not additive. The impact forecasts reflect baseline growth, mix effects, and variable interactions.
Cooling Tower Rental Market Segment Analysis
By Tower Type:
Evaporative Systems Retain Primacy Amid Hybrid UptakeEvaporative units accounted for 65.40% of the cooling tower rental market in 2025, reflecting decades-long industrial familiarity and superior heat-rejection efficiency. Hybrid wet-dry models are forecast to grow at an 8.35% CAGR through 2031 as governments tighten regulations on water draw and plume drift.
Rental providers bulk up hybrid fleets to address pharmaceutical plants and data halls located in drought-prone regions. The cooling tower rental market size for hybrid designs benefits from modular cells that operators can incrementally add during hot seasons and then downsize in cooler months. Dry towers remain vital in areas where water discharge is restricted, such as semiconductor fabs that must limit their effluent. Evaporative systems nevertheless maintain cost leadership on a per-megawatt basis, preserving their dominance in refinery turnarounds and petrochemical debottlenecking. Suppliers integrate variable-frequency drives and drift eliminator upgrades to meet emerging efficiency codes without sacrificing baseline performance.
Incremental design innovations support both water stewardship and rapid deployment. Telescoping fan stacks reduce freight height, cutting transport fees on interstate hauls. Composite fill media extends service intervals, lowering chemical consumption by 15%. Providers able to balance these operational advantages position themselves for sustained share retention across the cooling tower rental market.


By Capacity Range:
Mid-Range Comfort Zone Faces Hyperscale PullInstallations between 5-20 MW accounted for 42.60% of the cooling tower rental market size in 2025, as this band aligns with typical refinery units and colocation data halls. Contracts exceeding 20 MW are projected to rise at a 7.55% CAGR through 2031, driven by hyperscale cloud deployments and large LNG terminal upgrades.
Clients with multi-rack AI clusters need sustained high-density cooling loads that push rental tower banks to new capacities. Vendors respond by grouping modular cells into 30 MW clusters with common header piping, which cuts onsite labor by one-third. Below-5 MW rentals continue to serve food processing lines and commercial HVAC retrofits, but offer limited revenue upside per contract.
Hyperscale growth also drives ancillary services such as power distribution skids and real-time SCADA portals, deepening provider account penetration. This momentum reshapes fleet mix, shifting capital budgets toward heavier lift modules while still retaining mid-range units for bread-and-butter industrial maintenance cycles. High-capacity adoption thus rebalances utilization ratios while broadening revenue potential within the cooling tower rental market.
By Rental Duration:
Strategic Mid-Term Hires Gain MomentumContracts shorter than six months remained the largest slice, at 44.30%, in 2025, due to emergency outages and planned shutdowns. Mid-term rentals lasting six to 24 months will grow at a 7.12% CAGR, indicating that users now embed temporary cooling into broader capital planning.
Data center developers frequently book 12-month agreements to hedge commissioning delays. Specialty chemical producers schedule extended pilots that require flexible heat rejection without permanent capital allocation. The shift lengthens revenue recognition per asset and stabilises seasonal swings for providers. Long-term rentals exceeding two years are a niche market, servicing remote pipeline camps and contracted power barges where permanent towers are impractical.
Suppliers equip mid-term deals with IoT gateways that transmit vibration and conductivity data, enabling predictive maintenance that keeps uptime above 99.5%. This service overlay cements client loyalty and raises switching barriers. Accordingly, mid-term growth has a material influence on cash-flow durability within the cooling tower rental market.
By End-User Industry:
Oil & Gas Holds Sway as Data Center Surge AcceleratesOil & gas users held 27.40% of the cooling tower rental market in 2025, anchored by refinery shutdowns and gas-processing debottlenecks. Data centers are expected to post the fastest 9.28% CAGR to 2031, driven by surging AI and cloud workloads.
Chemical and petrochemical complexes secure steady demand due to multi-year maintenance cycles and strict process-temperature control. Power utilities rent towers to smooth out peaking output during heatwaves, particularly as grids incorporate more renewable variability. HVACR managers in high-rise commercial buildings adopt rental units during chiller replacements to avoid occupant downtime.
Data center operators prioritise energy efficiency and water stewardship, prompting vendors to supply hybrid towers coupled with adiabatic coolers that lower water use by 60%. Bundled telemetry enables colocation firms to demonstrate environmental metrics to hyperscale tenants, solidifying the rental model as part of sustainability reporting. This end-user realignment diversifies the cooling tower rental market revenue base beyond traditional hydrocarbons.
Geography Analysis
North America Cooling Tower Rental Market
North American revenue dominance stems from mature logistics corridors that enable same-day tower mobilisation across most industrial zones. The United States ranks first in fleet density, serving both Permian Basin gas plants and Virginia’s data-center alley. Canada’s oil-sand upgraders favour rentals during spring thaw maintenance, while Mexico’s automotive belt opts for mid-term hires that align with capacity ramp-ups. Continued refinery decarbonization retrofits support demand of 5-20 MW, preserving North America’s leadership position in the cooling tower rental market.
APAC Cooling Tower Rental Market
The Asia-Pacific’s double-digit CAGR stems from national broadband agendas and cloud-service localization policies that necessitate rapid data hall buildouts. China’s Eastern Data Western Compute strategy places hyperscale campuses in cooler northern provinces, yet construction phases still depend on rental towers to bridge commissioning delays. India’s renewable-powered IT parks adopt hybrid wet-dry units to limit water draw, while Japan’s seismic codes favour modular skids that cut onsite crane lifts. Regional governments also sponsor mega-events, further broadening short-term rental opportunities.
Europe Cooling Tower Rental Market
Europe advances at a steadier pace, led by Germany’s industrial retrofits and the United Kingdom’s edge-data roll-outs. Stricter Legionella rules push hospitals and commercial estates toward rental swaps during permanent tower refurbishments. Southern Europe’s heatwaves drive seasonal spikes in grid-support cooling, raising off-balance-sheet demand. Eastern Europe utilizes rentals to maintain legacy power plants online during turbine overhauls, thereby reinforcing cross-border fleet redeployment efficiencies across the cooling tower rental market.

Regulatory Landscape
Cooling tower rental deployments need to satisfy local air, water, and occupational safety requirements whether the cooling tower is owned or rented. In the United States, the EPA regulates industrial process cooling towers (IPCTs) at major sources under 40 CFR Part 63, Subpart Q, including restrictions such as prohibiting chromium-based water treatment chemicals to limit hazardous air pollutant risk. This raises the importance of compliant water-treatment programs and drift-control features included as part of rental packages.
In the European Union, the Industrial Emissions Directive framework has been updated via Directive (EU) 2024/1785 (IED 2.0), effective August 4, 2024. The update reinforces Best Available Techniques (BAT) expectations and adds binding quantitative requirements related to resource, water, and energy efficiency for covered installations. For rental providers serving industrial clients operating under environmental permits, the change increases demand for documented operating procedures (water chemistry control, monitoring, and maintenance records) and favors fleets configured to match site-specific BAT conclusions and emission limit values.
Competitive Landscape
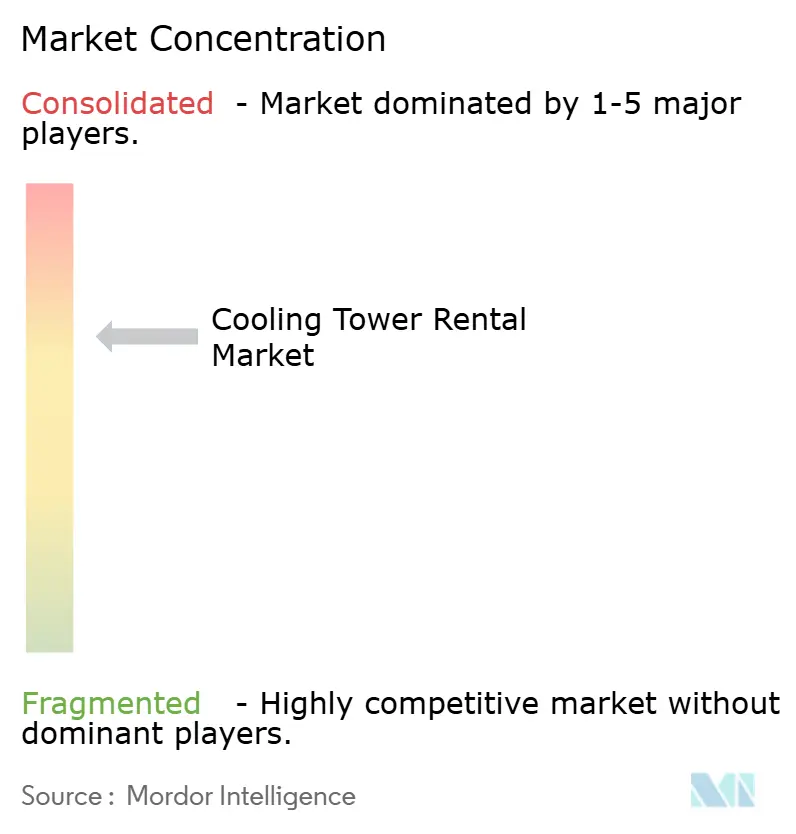
The market structure remains moderately fragmented, with the top five vendors collectively holding approximately 42% of the revenue, resulting in a medium concentration score. United Rentals’ USD 4.8 billion purchase of H&E Equipment Services in 2025 added nearly 64,000 assets and strengthened its specialty divisions, focusing on power and HVAC. Aggreko expands its petrochemical turnkey services by bundling fuel management with cooling, enabling the locking in of multi-site contracts. Sunbelt Rentals acquires regional firms to secure depots within 50 miles of major industrial clusters, thereby maintaining competitive response times.
Technology partnerships differentiate leaders. Johnson Controls created a Global Data Center Solutions unit that integrates YORK magnetic-bearing chillers with rental towers, offering energy savings of up to 40% for temporary deployments. SPX Technologies markets composite-fill retrofit kits that cut water consumption by 20%, appealing to sustainability-minded data tenants. Smaller regional players compete through deep local knowledge and flexible pricing, winning rapid-response projects such as stadium retrofits and remote mine shutdowns.
Digital capabilities shape the next battleground. Providers deploy edge-installed vibration sensors that feed cloud analytics, forecasting bearing wear ten days in advance, thereby minimizing unplanned downtime. Augmented-reality support accelerates field training, easing skilled-labour bottlenecks. Companies that merge equipment scale with data intelligence are set to outpace rivals as the cooling tower rental market shifts toward performance-based service agreements.
Cooling Tower Rental Industry Leaders
Aggreko plc
Caterpillar Inc.
United Rentals, Inc.
SPX Cooling Technologies, Inc.
Johnson Controls International plc
- *Disclaimer: Major Players sorted in no particular order
Cooling Tower Rental Market Companies Covered in this Report
- Aggreko plc
- Sunbelt Rentals Inc.
- United Rentals Inc.
- Caterpillar Inc. (Cat Rental)
- Johnson Controls International plc
- SPX Cooling Technologies Inc.
- Cooling Tower Depot Inc.
- Carrier Rental Systems Inc.
- Midwest Cooling Tower Services LLC
- Baltimore Aircoil Company Inc.
- KTK Kuhlturm Karlsruhe GmbH
- ICS Cool Energy
- Evapco Inc.
- Trane Technologies plc (Trane Rental Services)
- Resolute Industrial
- Rental Solutions & Services (RSS)
- Rapid Energy Temporary Cooling Ltd.
- Dry Coolers Inc.
- Cooltherm Group
- Mesa Equipment Rental

Market Opportunities and Future Outlook
Opportunities are most evident at regulated sites and at facilities with limited tolerance for downtime, where rental cooling functions as a continuity layer rather than an emergency-only measure. Carrier Rental Systems, for example, commissioned a 5,700 kW cooling tower solution in the UK Midlands in March 2026 to control process water temperatures above 35 degrees Celsius at a brake lining manufacturer, illustrating how rentals can prevent production losses during thermal excursions and maintenance windows.
Technology and compliance services also create whitespace for providers that pair modular hardware with documented operating controls. Aggreko securing a US patent (2024) for a containerized rental cooling tower system with variable-speed fan operation points to continued product differentiation around energy use and footprint, which aligns with procurement decisions where space constraints and operating cost scrutiny drive demand. At the same time, deployments add practical compliance layers such as temporary mobile equipment inspection regimes (for example, New Jersey MIBB&PVC procedures for temporary rental equipment), transport and safety rules for mobile systems (for example, 49 CFR 173.5b for certain shipments), and performance guidance used by data center operators (for example, ASHRAE 90.4). These requirements support higher-value rental packages that include monitoring, water treatment, commissioning documentation, and 24/7 support.
Recent Industry Developments in Cooling Tower Rental Market
- March 2026: Carrier Rental Systems deployed a 5,700 kW cooling tower solution in the UK Midlands for an industrial brake lining manufacturer after process water temperatures exceeded 35 degrees Celsius. The project underlined how rental towers can help avoid unplanned downtime during thermal upsets and bridge periods when permanent cooling capacity is constrained.
- November 2025: Caterpillar announced a strategic collaboration with Vertiv to integrate power and cooling architectures for AI-driven data centers. This strengthens packaged, pre-engineered approaches for high-density compute sites, reinforcing demand for coordinated temporary cooling and power solutions during build, commissioning, and resilience planning.
- August 2024: Aggreko announced a significant investment in its European cooling fleet to support petrochemical refineries amid summer heat, including adding water-cooled chiller capacity delivering 1.5 MW of cooling. Fleet investments like this improve response capability for turnarounds and heatwave-driven peaks, and they increase competitive pressure in large, time-critical industrial deployments.


Cooling Tower Rental Market Report Scope and Research Methodology
Market Definition and Coverage
We define the cooling tower rental market as revenue earned from renting temporary or supplemental cooling towers and related rental services that enable heat rejection for industrial and commercial sites during planned outages, emergency shutdowns, or peak load periods.
Scope exclusions: sales of new cooling towers, permanent EPC installation contracts, and long-term on-site operations outsourcing that is priced as a bundled plant utility service are excluded.
Segments Covered in This Report
- By Tower Type
- Evaporative
- Dry
- Hybrid (Wet-Dry)
- By Capacity Range
- Below 5 MW
- 5 to 20 MW
- Above 20 MW
- By Rental Duration
- Short-term (Less than 6 months)
- Mid-term (6-24 months)
- Long-term (Greater than 24 months)
- By End-user Industry
- Oil and Gas
- Chemical and Petrochemical
- Power Generation
- HVACR (Commercial Buildings)
- Data Centers
- Pulp and Paper
- Food and Beverage
- Others
- By Geography
- North America
- United States
- Canada
- Mexico
- Europe
- Germany
- United Kingdom
- France
- Italy
- Spain
- Russia
- Rest of Europe
- Asia Pacific
- China
- India
- Japan
- South Korea
- ASEAN Countries
- Rest of Asia Pacific
- South America
- Brazil
- Argentina
- Rest of South America
- Middle East and Africa
- Saudi Arabia
- United Arab Emirates
- Qatar
- South Africa
- Egypt
- Rest of Middle East and Africa
- North America
Data Sources, Market Sizing, and Validation
Desk Research
Desk work started by mapping where rental demand usually comes from, major maintenance activity, industrial output, and cooling load growth. Public sources were used to anchor the model with observable signals, such as US Energy Information Administration power statistics, Eurostat industrial production indices, USGS manufacturing and minerals indicators, and International Energy Agency releases on energy and industry trends.
To connect these demand signals to rental activity, we also referenced regulatory and operational context from sources such as ASHRAE publications, US EPA water and cooling guidance, and public tender portals where temporary cooling packages show up. Company filings, investor presentations, and trusted industry press were used to cross-check service mix, regional activity, and pricing direction. For company financials, news tracking, and patents tied to cooling and water treatment technologies, we used a paid subscription database where relevant. These desk research sources are illustrative only, and many other public and proprietary references were used to collect data, validate assumptions, and clarify open questions.
Primary Interviews and Surveys
Primary work focused on validating how often rentals are used, how long projects typically run, and what drives pricing in different seasons and regions. We spoke with a mix of rental operators, service contractors, facility managers, and procurement teams, and then cross-checked answers across North America, Europe, Asia-Pacific, and the Rest of the World to reduce single-market bias.
Distribution of primary research fieldwork respondents
| Company type | Respondent position | Region |
|---|---|---|
| Top tier: 37% | CXOs: 13% | APAC: 50% |
| Mid tier: 49% | Functional/Unit leaders: 32% | EMEA: 31% |
| Smaller Players: 14% | Managers: 55% | Americas: 19% |
Market-Sizing & Forecasting
Sizing was built using top-down logic where the demand pool is reconstructed from outage and maintenance intensity in power and process industries, combined with industrial activity indicators and cooling load growth in key end users. Once that demand pool was shaped, we applied adoption assumptions for rental cooling during planned shutdowns and unplanned events, and then converted it into value using typical rental duration and prevailing day-rate or month-rate pricing.
To keep totals realistic, results were corroborated with selective bottom-up checks, such as roll-ups of a sampled set of rental fleet capacity and utilization, channel checks on project duration, and a volume-by-average-price build for common tower capacity bands (in tonnage terms). Inputs used in the model include plant maintenance cycle timing, outage frequency signals, seasonal temperature patterns that change cooling demand, typical rental period ranges, fleet utilization, and regional price levels after normalizing currency timing.
For forecasting, we used scenario analysis supported by simple time-series smoothing on the demand indicators, then stress-tested the path using expert views on industrial capex, power capacity additions, and expected maintenance backlogs. Where bottom-up signals were incomplete (for example, private fleet sizes in smaller markets), gaps were handled using peer ratios and regional scaling factors, and then re-checked in follow-up calls.
Data Validation & Update Cycle
Model outputs are checked against independent signals, including industrial production direction, known maintenance cycles in major end users, and observed price movement from recent rental quotes shared in interviews. If a region shows a sharp jump that is not supported by these signals, the assumptions are reviewed, and respondents are re-contacted when a data point looks inconsistent.
Before publication, the work is reviewed in steps, starting with internal logic checks on volumes, prices, and year-to-year movement, followed by a second analyst review for scope and arithmetic consistency. Reports are refreshed annually, with interim updates when material events occur, such as major capacity additions, sharp energy market swings, or regulation changes that affect water and cooling operations. Right before delivery, we run a final pass to ensure the latest public updates and interview notes are reflected.
Mordor Intelligence's Cooling Tower Rental Market Size Compared With Other Published Estimates
Published market sizes for cooling tower rental do not always match because the service boundary, year labeling, and pricing basis can shift from one publisher to another. Differences also show up when one model leans heavily on equipment counts, while another relies more on broad industrial growth rates and then applies a generic rental penetration.
In our work, the key gap drivers usually come from whether related items are counted, such as bundled on-site utility service, permanent cooling solutions, or water treatment add-ons that are billed separately from tower rent. Another common source of spread is how project duration is treated, since a short emergency rental and a multi-month planned outage support different revenue math. The table points to this issue, where estimates that lean on higher utilization or longer assumed rental months tend to print larger totals, which is handled by using rental-only revenue and validating duration assumptions through interviews, followed by a currency timing check and annual refresh by Mordor Intelligence.
Benchmark comparison
| Source | Market Size | Gaps in Research Methodology |
|---|---|---|
| Mordor Intelligence | USD 1.39 B (2025) | |
| Industry Data Publisher A | USD 1.35 B (2025) | Uses a slightly tighter service definition and appears to smooth pricing, which can understate peak-season day rates and shorter emergency rentals that carry higher effective pricing. |
| Industry Report Publisher B | USD 1.29 B (2025) | Year labeling and scope look broader in narrative but narrower in value math, which suggests limited capture of ancillary rental services and a more conservative utilization assumption by region. |
Overall, the spread is mainly explained by what is counted as rental revenue, how rental duration is translated into billed months, and whether pricing is normalized to a consistent currency timing. By keeping the steps traceable to demand triggers (maintenance and outages) and checking utilization and price direction with field inputs, the estimate stays balanced and repeatable for planning decisions.


Key Questions Answered in the Report
What is the current cooling tower rental market size?
The cooling tower rental market size stands at USD 1.47 billion in 2026 and is projected to reach USD 1.97 billion by 2031 based on a 5.98% CAGR.
Which tower type leads the cooling tower rental market?
Evaporative systems lead with a 65.40% share, while hybrids are the fastest-growing on an 8.35% CAGR to 2031.
Why are data centers boosting demand for rental cooling?
Hyperscale builds use rental towers for 3-to-6-month commissioning gaps, driving a 9.28% CAGR for data-center demand through 2031.
Which region is the fastest-growing?
Asia-Pacific is forecast to post a 10.02% CAGR due to massive digital-infrastructure investments and supportive government policies.
How does rental duration influence provider revenue?
Mid-term rentals of six-to-24 months are growing at 7.12% CAGR, lengthening contract value and stabilising fleet utilisation for vendors.
Who are the major players in the cooling tower rental market?
United Rentals, Aggreko, Sunbelt Rentals, and Johnson Controls lead through acquisitions, specialty services, and technology-integrated offerings.
Page last updated on:


 Your data is secure and never sold or shared.


