
Cooling Tower Market Size and Share
Market Overview
| Study Period | 2021 - 2031 |
|---|---|
| Market Size (2026) | USD 4.59 Billion |
| Market Size (2031) | USD 5.89 Billion |
| Growth Rate (2026 - 2031) | 5.09 % |
| Fastest Growing Market | Asia-Pacific |
| Largest Market | Asia-Pacific |
| Market Concentration | Medium |
Major Players *Disclaimer: Major Players sorted in no particular order Image © Mordor Intelligence. Reuse requires attribution under CC BY 4.0. | |
Cooling Tower Market Analysis by Mordor Intelligence
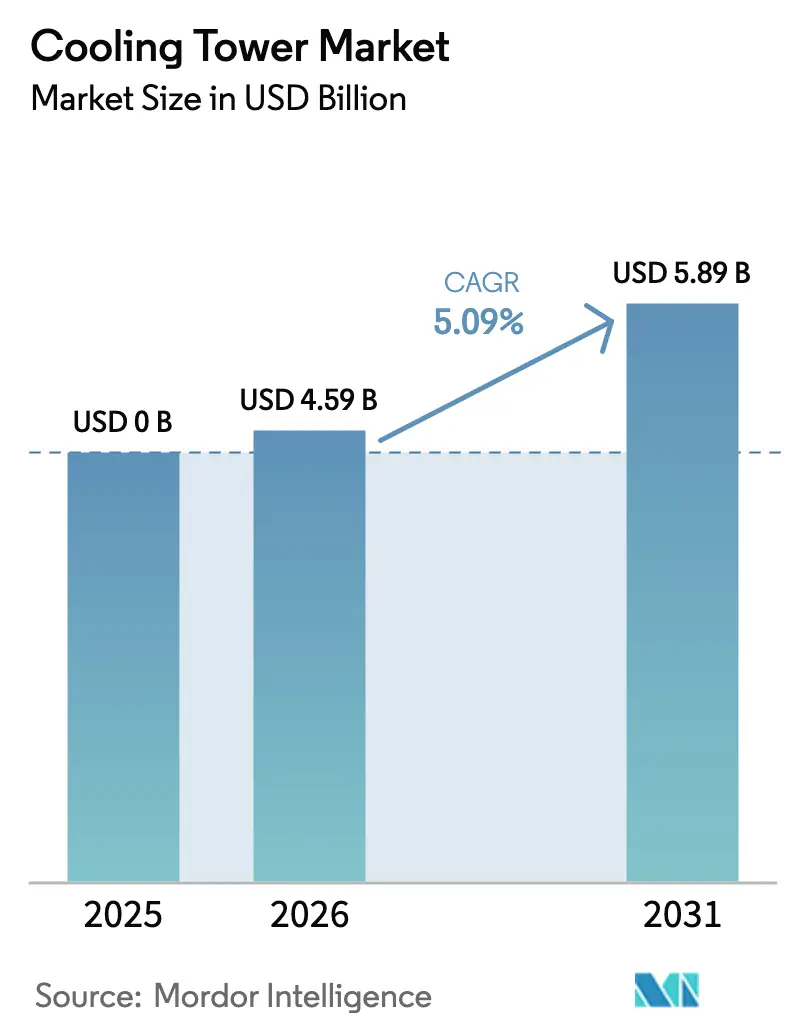
Cooling Tower Market size in 2026 is estimated at USD 4.59 billion, growing from 2025 value of USD 4.37 billion with 2031 projections showing USD 5.89 billion, growing at 5.09% CAGR over 2026-2031.
Continued capital formation in power generation and the build-out of hyperscale data-center campuses keep high-capacity evaporative systems in demand, while hybrid wet-dry designs scale faster as operators react to tightening water-use and energy-efficiency regulations. The accelerated adoption of counter-flow configurations, growth in installations exceeding 20 MW, and the shift to PFAS-free fill materials further reinforce the cooling tower market’s growth trajectory. Suppliers capable of integrating digital twin analytics, predictive maintenance, and alternative make-up-water schemes hold an execution edge as sustainability mandates intensify.
Key Report Takeaways
- By flow type, cross-flow cooling towers led the market with a 56.90% share in 2025, while counter-flow cooling towers are forecast to expand at a 7.69% CAGR through 2031.
- By tower type, evaporative systems accounted for 66.40% of the cooling tower market size in 2025, whereas hybrid wet-dry units are expected to log the fastest growth rate of 8.34% CAGR.
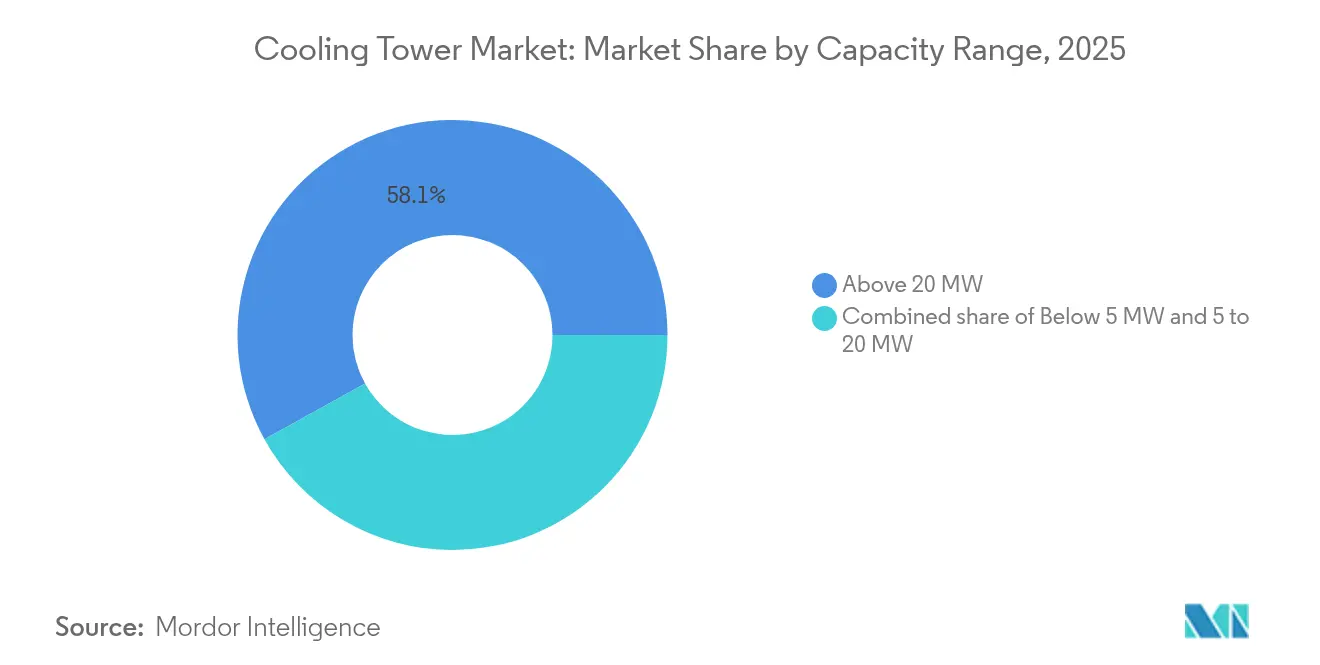
- By capacity, installations above 20 MW accounted for a 58.05% share of the cooling tower market size in 2025 and are projected to advance at a 6.08% CAGR.
- By application, power generation held 38.60% of the cooling tower market share in 2025, while data centers are projected to grow at a 9.05% CAGR through 2031.
- By geography, the Asia-Pacific region led with a 43.70% revenue share in 2025, growing at a 6.78% CAGR to 2031.
Note: Market size and forecast figures in this report are generated using Mordor Intelligence’s proprietary estimation framework, updated with the latest available data and insights as of 2026.
Global Cooling Tower Market Trends and Insights
Drivers Impact Analysis*
| Driver | (~) % Impact on CAGR Forecast | Geographic Relevance | Impact Timeline |
|---|---|---|---|
| Expanding HVACR installations in commercial real-estate | 1.80% | Global, with concentration in North America and Asia-Pacific | Medium term (2-4 years) |
| Power plant capacity additions in Asia and Middle East | 0.90% | Asia-Pacific core, spill-over to Middle East | Long term (≥ 4 years) |
| Stringent water-use and energy-efficiency mandates (CTI, ASHRAE) | 0.70% | North America and Europe, expanding to Asia-Pacific | Medium term (2-4 years) |
| Industrialization and refinery upgrades in emerging economies | 0.60% | Asia-Pacific, Middle East, and South America | Long term (≥ 4 years) |
| Rapid build-out of hyperscale data-center campuses | 0.50% | Global, with early gains in North America, Europe, Asia-Pacific | Short term (≤ 2 years) |
| Green hydrogen electrolyzer projects needing process cooling | 0.40% | Europe and North America, with pilot projects in Asia-Pacific | Long term (≥ 4 years) |
| Source: Mordor Intelligence | |||
Expanding HVACR Installations in Commercial Real-Estate
The rapid commercialization of mixed-use complexes and high-specification data centers is driving developers toward higher-capacity, digitally monitored evaporative and hybrid systems. Johnson Controls reported a USD 13.1 billion order backlog as smart-building owners specify cooling towers equipped with demand-responsive controls that synchronize with building automation servers.[1] Johnson Controls, “Q1 FY25 Earnings Presentation,” johnsoncontrols.com The integration of IoT sensors enables predictive maintenance routines that reduce downtime. Projects in water-stressed localities are increasingly selecting hybrid wet-dry units to meet compliance thresholds without compromising load-following capability. Suppliers that can validate real-world energy savings through CTI-certified performance testing gain a procurement advantage when property investors audit sustainability metrics.
Power Plant Capacity Additions in Asia and Middle East
Utilities in China, India, and the Gulf states are scaling nuclear, gas-fired, and renewable-hybrid plants that require high-capacity counter-flow towers to manage variable steam loads. China’s Heqi-1 industrial steam linkage delivers 4.8 million tonnes of process steam annually, underscoring the commercial benefits of integrating cooling towers into industrial heat-recovery loops. GCC utilities adopt seawater-cooled towers at coastal Combined Cycle Gas Turbine sites, reducing freshwater withdrawal and enabling capacity factors above 40% in extreme ambient temperatures. The Middle East’s move toward solar-thermal augmentation further positions hybrid systems as compliance-ready for future carbon pricing schemes.
Stringent Water-Use and Energy-Efficiency Mandates
CTI Standard 201 certification and ASHRAE Legionella guidelines tighten drift-rate limits and raise minimum cycles-of-concentration, compelling owners to modernize fill packs and automate biocide dosing. The CDC’s updated Legionella toolkit increases enforcement risk, encouraging facilities to adopt closed-loop or hybrid designs that reduce plume risk.[2]Centers for Disease Control and Prevention, “Legionella Control Toolkit,” cdc.gov Manufacturers that self-certify with CTI are investing in third-party test rigs to prove performance under part-load conditions, a differentiator in competitive bid rounds. Regulatory momentum has also stimulated R&D into PFAS-free fill media with comparable fouling resistance and thermal conductivity.
Rapid Build-Out of Hyperscale Data-Center Campuses
Hyperscale operators specify multi-cell modular towers that can be craned into position and tied to liquid-cooling loops within compressed construction windows. Baltimore Aircoil Company’s liquid-ready modules demonstrate drift losses below 0.0005% of water flow, meeting local discharge caps without auxiliary plume abatement systems. Operators demand redundancy levels of N+2, driving procurement of standardized tower skids that can be swapped with minimal site work. The shift to liquid racks increases outlet water temperature requirements, enabling towers to operate in economizer mode for extended periods and reducing annual water consumption.
Restraints Impact Analysis*
| Restraint | (~) % Impact on CAGR Forecast | Geographic Relevance | Impact Timeline |
|---|---|---|---|
| High operating cost and water-scarcity concerns | -0.80% | Global, with acute impact in Middle East and Australia | Medium term (2-4 years) |
| Plume-abatement and drift-elimination compliance costs | -0.60% | North America and Europe, expanding globally | Short term (≤ 2 years) |
| Shift toward adiabatic dry coolers in ≤1 MW range | -0.40% | Europe and North America, with adoption in water-scarce regions | Medium term (2-4 years) |
| PFAS-fill material phase-out increasing retrofit over new build | -0.30% | North America and Europe, with regulatory spill-over to Asia-Pacific | Short term (≤ 2 years) |
| Source: Mordor Intelligence | |||
High Operating Cost and Water-Scarcity Concerns
The total cost of ownership is rising because chemical conditioning and discharge fees now exceed electricity costs in many arid markets. Pacific Northwest National Laboratory case studies show that military installations are lowering makeup water demand by recovering HVAC condensate and rainwater; however, capital outlays for integrated storage push payback periods beyond five years.[3]Pacific Northwest National Laboratory, “Alternative Water Sources for Cooling Towers,” pnnl.gov Facilities in Australia and the Middle East, where water charges exceed USD 5 per 1,000 gallons, are increasingly justifying dry cooling or hybrid designs despite efficiency penalties. Suppliers that bundle performance guarantees with water-saving retrofits secure longer-term service contracts that smooth revenue volatility during new-build lulls.
PFAS-Fill Material Phase-Out Increasing Retrofit Demand
The EPA’s January 2025 TSCA amendment bans PFAS from new chemical exemptions, limiting legacy fill supply and prompting accelerated retrofit cycles.[4] U.S. Environmental Protection Agency, “TSCA Section 5 Amendments on PFAS,” epa.gov Ceramic and non-fluorinated polymer alternatives exhibit lower thermal conductivity, so owners compensate by using larger plan dimensions or multi-cell arrays. While this raises capital expense, it expands aftermarket service demand for specialist contractors who can execute turnkey media replacements within narrow outage windows. Vendors are also exploring additive-manufactured lattice fillers that promise higher surface-area-to-volume ratios; however, commercial availability is likely not until after 2027.
*Our forecasts treat driver/restraint impacts as directional, not additive. The impact forecasts reflect baseline growth, mix effects, and variable interactions.
Segment Analysis
By Flow Type: Counter-Flow Gains Efficiency Edge
Counter-flow installations captured 43.10% of the revenue in 2025 and are growing at a 7.69% CAGR, as data-center and pharmaceutical clients prioritize high L/G ratios and smaller footprints. Industrial heat-pump projects that couple counter-flow towers with process chillers deliver annual energy savings of over 15%, directly improving OPEX sensitivity in food & beverage plants. Cross-flow towers retain an installed-base advantage, particularly at coal and gas turbines, where low static-pressure drops ease auxiliary load. However, their share is expected to erode as water tariff escalators favor a more stringent approach to temperature control. Digital twin simulations confirm that counter-flow designs can cut operating cost by 5% when integrated with predictive reservoir management, further propelling share gains.
Legacy cross-flow units remain attractive for retrofit because fill packs are more accessible, and large surface areas accommodate fouling without immediate performance loss. Owners pursuing phased compliance strategies often refurbish cross-flow cells with low-drift eliminators to postpone capital replacement. Even so, new industrial complexes in Southeast Asia are standardizing counter-flow towers sized for a design wet-bulb depression of more than 10 °C, signaling a structural pivot that will reshape manufacturer product portfolios over the decade.


By Tower Type: Hybrid Systems Lead Innovation
Hybrid wet-dry models are advancing at an 8.34% CAGR, outpacing evaporative towers, which are expected to hold a 66.40% share in 2025. Utilities in water-stressed areas appreciate hybrid designs that switch to dry mode during drought restrictions, maintaining thermal compliance while cutting seasonal water draw by 50%. Field trials of perforated dew-point indirect evaporative modules confirm that supply-air ratios below 0.5 achieve optimal thermal efficiency gains, positioning hybrids as viable replacements for plume-abatement retrofits.
Evaporative towers dominate high-capacity applications because wet operation achieves approach temperatures within 3 °C of the wet-bulb temperature, which is crucial for steam-cycle efficiency. Suppliers hedge market risk by launching modular hybrid lines that retrofit onto evaporative basins, effectively transforming legacy assets. Material advances such as hydrophilic membrane fill promise to push hybrid outlet temperatures closer to wet operation benchmarks, intensifying competition for urban hospitals and semiconductor fabs where plume mitigation is non-negotiable.
By Capacity Range: Large-Scale Dominance Continues
The above 20 MW cohort holds a 58.05% share and is forecast to expand at a 6.08% annual rate as economies of scale justify investments in digital vibration monitoring, auto-chemical dosing, and variable-frequency fan drives. Babcock & Wilcox’s installed base of over 1,900 units illustrates owner preference for tier-one suppliers capable of delivering EPC-grade services and lifecycle support. Mid-sized (5–20 MW) units target district cooling networks in ASEAN smart-city projects, where modularity trumps megawatt density.
Sub-5 MW installations face competition from adiabatic coolers that boast near-zero plume and simplified permitting. Nevertheless, OEM roadmaps indicate compact induced-draft towers with integrated drift eliminators and composite casings, specifically targeting this segment, which reflects that certain pharmaceuticals and light industrial sites still prefer wet cooling for tighter approach temperatures. Capacity upgrades across aging North American refinery fleets will also sustain demand for segments exceeding 20 MW, especially where regulatory frameworks incentivize heat-rate improvements.
By Application: Data Centers Drive Growth
Data centers represent the fastest-growing end market, with a 9.05% CAGR. Liquid-cooled racks elevate heat rejection densities, prompting tower specifications that accommodate higher condensing water temperatures, thereby operating in water-saver modes for up to 80% of annual hours. The cooling tower market benefits as hyperscale developers standardize multi-cell skids shipped fully assembled to compress commissioning timelines.
Power generation retains the largest 38.60% revenue share due to its absolute heat-load intensity. Nuclear steam-supply integration projects, exemplified by China’s Heqi-1, highlight how utility-industrial partnerships extend tower usage beyond turbine condensers into process steam circuits. Oil & gas, as well as chemical facilities, contribute steady demand through rehabilitation cycles tied to throughput expansions. Meanwhile, commercial HVACR gains momentum from mixed-use skyscrapers that integrate central plant cooling with AI-driven building management systems.
Geography Analysis
The Asia-Pacific region commands 43.70% of the cooling tower market and is expected to grow at a 6.78% CAGR, driven by synchronized investments in power, petrochemical, and data center infrastructure across China and India. China’s nuclear-steam cogeneration model exemplifies the region’s integrated approach, combining industrial decarbonization targets with process heat optimization. India’s thermal power refurbishments increasingly specify hybrid towers to conform with draft national water norms that cap withdrawal intensity.
North America registers demand primarily from data-center expansions clustered in Virginia, Texas, and the Pacific Northwest, paired with refinery retrofits to remove PFAS-based fill. Stringent ASHRAE and EPA guidelines further shape procurement toward CTI-certified, low-drift cells. Europe sustains moderate growth as district energy schemes in Germany and Scandinavia adopt hybrid wet-dry towers to balance water stewardship and seasonal load variation. The Middle East and Africa are witnessing a rising uptake of seawater and dry towers attached to solar-thermal and desalination complexes, where freshwater scarcity commands a premium on zero-discharge cycles. South American momentum concentrates in Brazil’s mining corridors and Argentina’s soy-crushing hubs, both leaning on >20 MW counter-flow towers to handle high dust and variable loading. Collectively, these regional dynamics validate the cooling tower market’s resilience across climatic and regulatory mosaics.


Regulatory Landscape
Cooling tower procurement is shaped by air-quality, energy, and public-health requirements that vary by end-use and jurisdiction. In the United States, the Environmental Protection Agency regulates industrial process cooling towers through National Emission Standards for Hazardous Air Pollutants under 40 CFR Part 63 Subpart Q, which affects monitoring and operating practices at covered facilities. On the building side, ASHRAE 188 is increasingly used as a baseline for Legionella risk management, driving demand for documented water management plans, routine monitoring, and tighter controls that feed into tower selection and service contracting.
Energy performance codes also shape equipment design and bid specifications. California Title 24, Part 6 includes proposals for updated prescriptive minimum efficiency requirements for axial fan cooling towers, with climate-zone-specific values that support demand for higher-efficiency fan systems and verified performance. At the same time, the EPA's January 2025 TSCA amendments restricting PFAS from new chemical exemptions are accelerating the move away from legacy PFAS-containing fill materials and increasing retrofit activity, while also raising scrutiny of water-treatment chemistries used to maintain cycles of concentration and control biofouling.
Competitive Landscape
The cooling tower market is moderately fragmented, with top suppliers leveraging technology differentiation and service depth to maintain their market share. SPX Technologies grew its HVAC segment revenue 32.5% year-over-year to USD 356.5 million, driven by organic gains and acquisitions that filled portfolio gaps in hybrid and adiabatic lines. Vendors invest in digital twin platforms that simulate droplet drift, fouling trajectories, and fan energy under site-specific meteorology, enabling outcome-based contracts that resonate with CFOs scrutinizing lifecycle economics.
Johnson Controls’ USD 13.1 billion backlog signals customer confidence in suppliers that can integrate cooling towers into unified building-automation ecosystems. Partnerships with hyperscalers to pre-engineer module footprints shorten procurement cycles, creating a virtuous linkage between customization and standardization. M&A activity targets niche material science firms developing PFAS-free fills and ribbed composite casings, securing intellectual property against incoming regulation.
New entrants chase white-space in water-scarce geographies by promoting adiabatic and closed-loop systems that operate on greywater. Yet hurdles include limited CTI certification history and scaling challenges for large-capacity units. Established brands blunt disruption by offering extended warranties bundled with remote monitoring services, thereby elevating switching costs for facility owners. Over the forecast horizon, competitive intensity will center on sustainability credentials and the ability to guarantee measurable reductions in water and energy use.
Cooling Tower Industry Leaders
SPX Technologies, Inc.
Baltimore Aircoil Company, Inc.
EVAPCO, Inc.
Johnson Controls International plc
Hamon & CIE (John Cockerill SA)
- *Disclaimer: Major Players sorted in no particular order


Market Opportunities and Future Outlook
Tighter efficiency and water-management requirements are creating headroom for suppliers that can bundle compliant heat rejection with verifiable water and energy performance, particularly in regulated commercial building applications. California Title 24, Part 6 updates related to axial fan cooling tower efficiency, alongside wider adoption of ASHRAE 188-based Legionella programs, increases the value of CTI-verified selections, low-drift designs, and digitally monitored water-management solutions that reduce compliance effort for owners. The EPA's 2025 TSCA action on PFAS is also pulling forward replacement cycles for fill media, which supports opportunities for PFAS-free materials, turnkey retrofit execution, and lifecycle services that help minimize outage windows.
Supplier capacity moves also point to active investment in modularization, regional manufacturing, and faster delivery. In May 2026, Baltimore Aircoil Company opened a manufacturing and distribution facility in Ciénega de Flores, Nuevo León, Mexico to support Latin American operations, improving lead times and aftersales coverage for HVACR and industrial users. In July 2026, EVAPCO entered a 15-year industrial district agreement for a new facility in the Navasota Industrial District, Texas, reflecting continued focus on domestic capacity and service responsiveness for data-center and industrial demand centers. SPX Technologies' February 2026 acquisition of Crawford United expands capabilities in air-moving and industrial ventilation components that interface with heat-rejection systems, strengthening offerings for customers managing total cooling-plant performance under water and energy constraints.
Recent Industry Developments
- June 2026: EVAPCO announced a 3% average price increase on all cooling towers, options, and accessories, effective June 5, 2026 (orders entered after July 7, 2026). The pricing adjustment reflects ongoing input-cost pressures and aligns with a broader shift toward value-based pricing across modular and integrated cooling solutions.
- May 2026: Baltimore Aircoil Company opened a manufacturing and distribution facility in Ciénega de Flores, Nuevo León, Mexico to support Latin American operations. The facility expands regional manufacturing capacity and improves lead times for HVACR and industrial cooling projects across Latin America.
- February 2026: SPX Technologies (SPX Cooling Technologies) became the first manufacturer to achieve CTI Sound Certification for multiple product lines (Aquatower, AV, MD, NC, OlympusV). This certification milestone supports the credibility of SPX's products in design-bid processes and differentiates its offerings in noise-sensitive applications such as data centers.


Research Methodology Framework and Report Scope
Market Definition and Coverage
For this report, the cooling tower market is defined as revenue generated from cooling tower systems and major assemblies used to reject heat in industrial and building cooling loops, across new installations and replacement demand.
Scope exclusions: We exclude routine service labor, water treatment chemicals, and standalone sensors or controls that are not sold as part of a cooling tower system.
Segmentation Overview
- By Flow Type
- Cross-Flow
- Counter-Flow
- By Tower Type
- Evaporative
- Dry
- Hybrid (Wet-Dry)
- By Capacity Range
- Below 5 MW
- 5 to 20 MW
- Above 20 MW
- By Application
- Oil and Gas
- Chemical and Petrochemical
- Power Generation
- HVACR (Commercial Buildings)
- Data Centers
- Pulp and Paper
- Food and Beverage
- Others
- By Geography
- North America
- United States
- Canada
- Mexico
- Europe
- Germany
- United Kingdom
- France
- Italy
- Spain
- Russia
- Rest of Europe
- Asia Pacific
- China
- India
- Japan
- South Korea
- ASEAN Countries
- Rest of Asia Pacific
- South America
- Brazil
- Argentina
- Rest of South America
- Middle East and Africa
- Saudi Arabia
- United Arab Emirates
- Qatar
- South Africa
- Egypt
- Rest of Middle East and Africa
- North America
Data Sources, Market Sizing, and Validation
Desk Research
Desk research is used to set the base demand pool and to keep our assumptions anchored to published, checkable data. We mainly rely on public energy, industry, and construction indicators that explain where heat rejection equipment is being installed and upgraded. Sources used include, for example, US EIA power generation statistics, IEA energy balance releases, USGS materials data (for steel and composites context), EPA water and industrial compliance references, and OECD or World Bank macro and industrial output series.
We also review company annual reports, investor presentations, product catalogs, and reputable trade press to understand typical system configurations, replacement cycles, and order patterns by end use (such as power, HVACR, and process industries). Where needed, paid subscriptions for company financials and intelligence, shipment level import and export records, and patent databases are used to cross-check supplier exposure and technology direction. The sources listed here are illustrative, and many additional public and paid references were used for collection, validation, and clarification.
Primary Interviews and Surveys
Primary work is used to stress-test the desk assumptions, particularly pricing, replacement timing, and what buyers treat as a like-for-like cooling tower purchase. We speak with a mix of manufacturers, EPC and system integrators, distributors, and facility operators, then reconcile differences by region so the final model reflects how decisions are made in real projects.
Distribution of primary research fieldwork respondents
| Company type | Respondent position | Region |
|---|---|---|
| Top tier: 29% | CXOs: 19% | APAC: 42% |
| Mid tier: 52% | Functional/Unit leaders: 28% | EMEA: 37% |
| Smaller Players: 19% | Managers: 53% | Americas: 21% |
Market-Sizing & Forecasting
Sizing starts from a top-down build where power generation additions, industrial output signals, and commercial cooling build activity are used to reconstruct the addressable need for heat rejection equipment in each region, then filtered through cooling tower penetration and typical replacement cadence. To keep totals realistic, the results are corroborated with selective bottom-up checks, such as sampled project values, channel feedback on unit volumes, and an ASP by capacity band that is adjusted for material and freight movements.
Key model inputs include installed base expansion in power and heavy industry, new build and retrofit activity in large HVACR systems, data center cooling buildouts, water use and discharge constraints that shift choices between evaporative, dry, and hybrid designs, and material mix trends (such as FRP versus steel) that influence pricing. Forecasts are produced using scenario analysis, with a main case combining expert consensus on construction cycles and energy investment timing, and sensitivity ranges on pricing and replacement rates. Where bottom-up visibility is limited in smaller countries, the gap is handled through proxy indicators like industrial value add, electricity generation mix, and construction spending shares, and then normalized to regional benchmarks.
Data Validation & Update Cycle
Outputs are validated through a series of cross-checks that look for mismatches versus independent signals, such as power plant commissioning timelines, large building HVAC project pipelines, and observed pricing changes by capacity band. Outliers are reviewed country by country, and if a variance cannot be explained by a clear driver, assumptions are revisited and the relevant contacts are re-checked before sign-off.
Reports are refreshed annually, and interim updates are made when material events occur, such as major regulation shifts on water use, sharp raw material swings, or step changes in large project activity. Before delivery, an analyst completes a final review pass to confirm that inputs and currency assumptions reflect the most recent available information.
Mordor Intelligence's Cooling Tower Market Size Measured Against Other Published Estimates
Published market values for cooling towers can look far apart because firms draw boundaries differently and then apply different price and volume assumptions. The main split usually comes from whether the estimate counts only cooling tower systems and major assemblies, or whether adjacent spending like water treatment programs and service labor is blended into the same total.
By tracking capacity range level ASP movements and refresh timing, Mordor Intelligence keeps the total tied to equipment revenue and then validates it with region level installation signals. This approach reduces inflation from loosely defined add-ons and mixed year currency treatment.
Benchmark comparison
| Source | Market Size | Gaps in Research Methodology |
|---|---|---|
| Mordor Intelligence | USD 4.59 B (2026) | |
| Trade Journal A | USD 3.00 B (2024) | Uses an earlier base year and appears to focus on cooling tower shipments for selected end uses, which can miss replacement demand in mature HVAC and industrial sites, and can understate ASPs in large capacity projects. |
| Industry Report B | USD 4.63 B (2024) | Likely includes a broader set of cooling infrastructure items beyond towers in some applications, and applies different currency conversion timing, which can lift the stated value versus an equipment-only boundary. |
The table shows that year selection and what gets counted around the tower itself explain much of the spread. When the scope is kept to tower systems and major assemblies, and when pricing is checked against capacity bands and project reality, the estimate becomes easier to trace back to clear drivers and repeat in future updates.


Key Questions Answered in the Report
What is the current size of the global cooling tower market?
The cooling tower market size reached USD 4.59 billion in 2026 and is projected to hit USD 5.89 billion by 2031.
Which application segment is expanding the fastest?
Data centers are the fastest-growing application segment at a 9.05% CAGR through 2031, driven by hyperscale facility expansion.
Why are hybrid wet-dry cooling towers gaining popularity?
Hybrid towers allow operators to switch between wet and dry modes, cutting annual water use by up to 50% while meeting stringent plume-abatement rules, making them attractive in water-scarce regions.
How will the PFAS phase-out impact the market?
The EPA’s PFAS restrictions effective 2025 limit traditional fill materials, accelerating retrofit demand and creating opportunities for suppliers of alternative media.
Which region holds the largest share of the cooling tower market?
Asia-Pacific leads the market with 43.70% revenue share in 2025 and is also the fastest-growing region, posting a 6.78% CAGR through 2031.
What technological features are most sought after in new cooling tower procurements?
Buyers increasingly require CTI-certified performance, IoT-enabled predictive maintenance, variable-frequency fan drives, and the ability to integrate with building-automation systems for optimized energy and water management.
Page last updated on:


 Your data is secure and never sold or shared.


