
Conveyor Monitoring Market Size and Share
Market Overview
| Study Period | 2020 - 2031 |
|---|---|
| Market Size (2026) | USD 271.99 Million |
| Market Size (2031) | USD 322.35 Million |
| Growth Rate (2026 - 2031) | 3.46 % |
| Fastest Growing Market | Asia Pacific |
| Largest Market | North America |
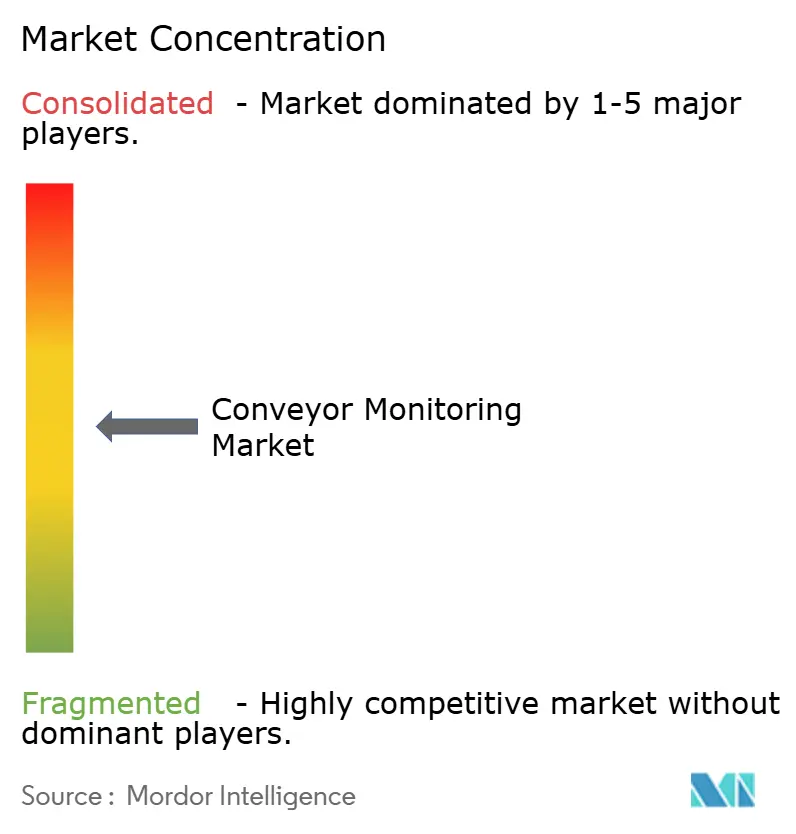
| Market Concentration | Medium |
Major Players *Disclaimer: Major Players sorted in no particular order Image © Mordor Intelligence. Reuse requires attribution under CC BY 4.0. | |
Conveyor Monitoring Market Analysis by Mordor Intelligence
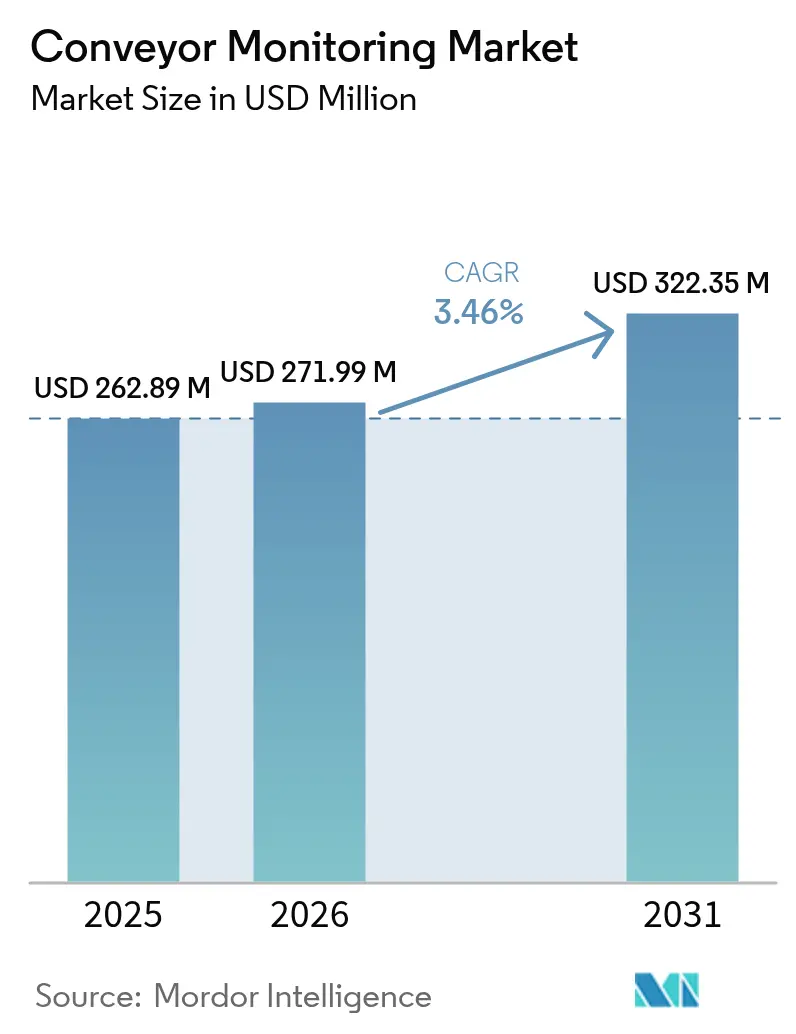
The conveyor monitoring market size was valued at USD 262.89 million in 2025 and estimated to grow from USD 271.99 million in 2026 to reach USD 322.35 million by 2031, at a CAGR of 3.46% during the forecast period (2026-2031). Demand is growing because operators are shifting from reactive inspections to predictive diagnostics that pair vibration and thermal sensors with edge analytics, a change that reduces unscheduled stoppages and extends component life. Mining, logistics, and e-commerce facilities continue to drive sensor deployments, while moderate-cost wireless IIoT upgrades are unlocking retrofit opportunities for aging conveyors. Hardware still dominates current spending, yet cloud software subscriptions are expanding faster as users seek prescriptive alerts that integrate directly with maintenance work-order systems. Cyber-security hardening and regulatory safety mandates add further momentum, although uncertain payback periods for smaller plants temper the conveyor monitoring market expansion in price-sensitive regions.
Key Report Takeaways
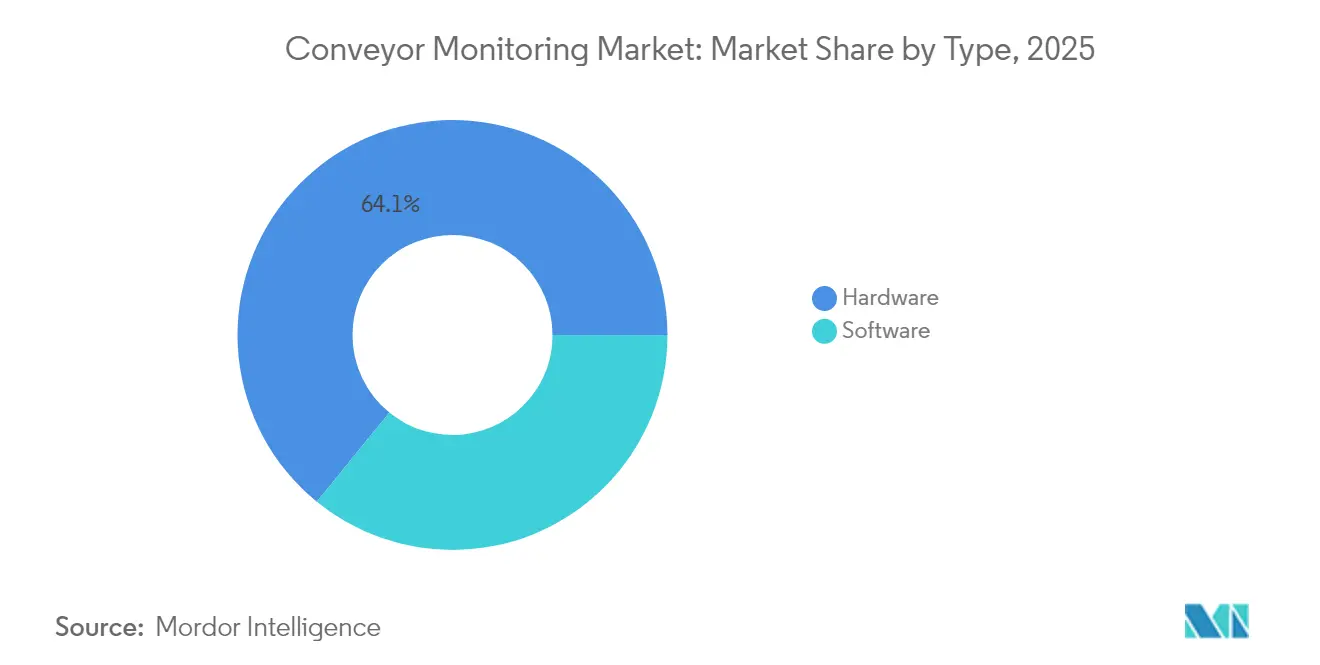
- By component, hardware captured 64.13% revenue share in 2025, while software is projected to expand at a 4.43% CAGR through 2031.
- By monitoring focus, belt monitoring accounted for 71.05% of 2025 installations, whereas motor monitoring is forecast to grow at a 4.62% CAGR to 2031.
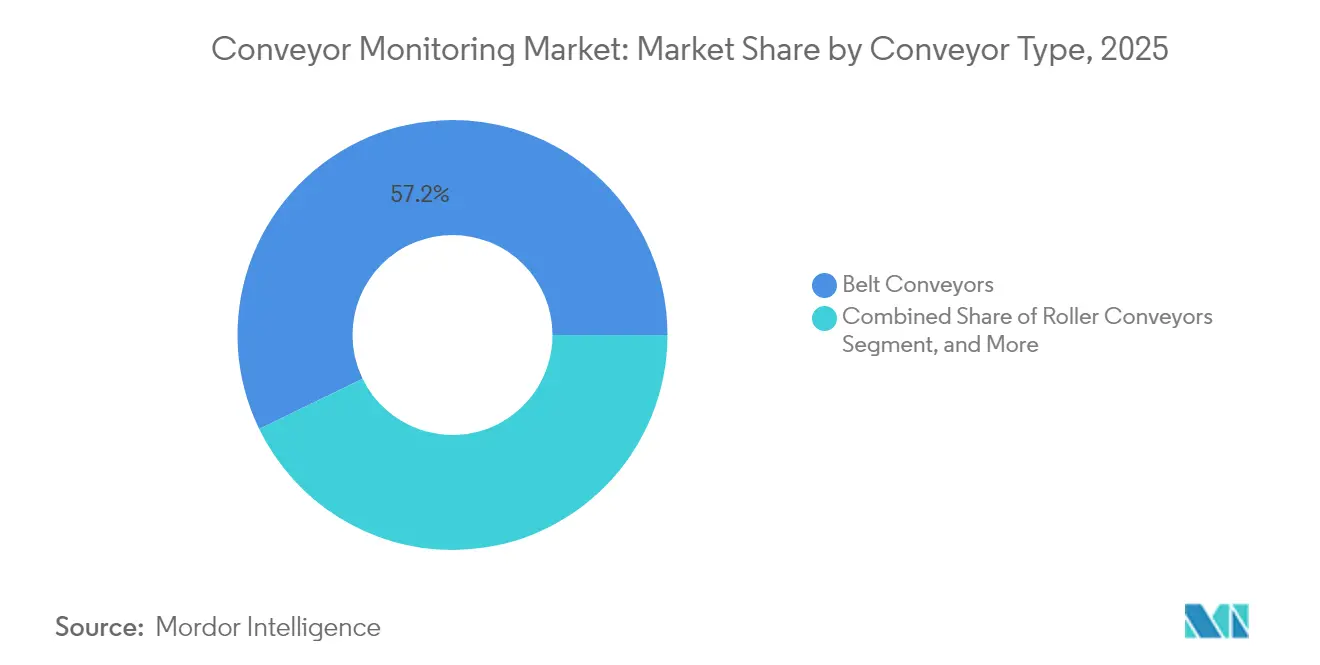
- By conveyor type, belt conveyors held 57.21% of 2025 deployments; overhead conveyors represent the fastest-growing form at a 4.29% CAGR.
- By end-user, mining led with 30.12% of 2025 revenue, yet logistics and warehousing is on track for a 4.08% CAGR to 2031.
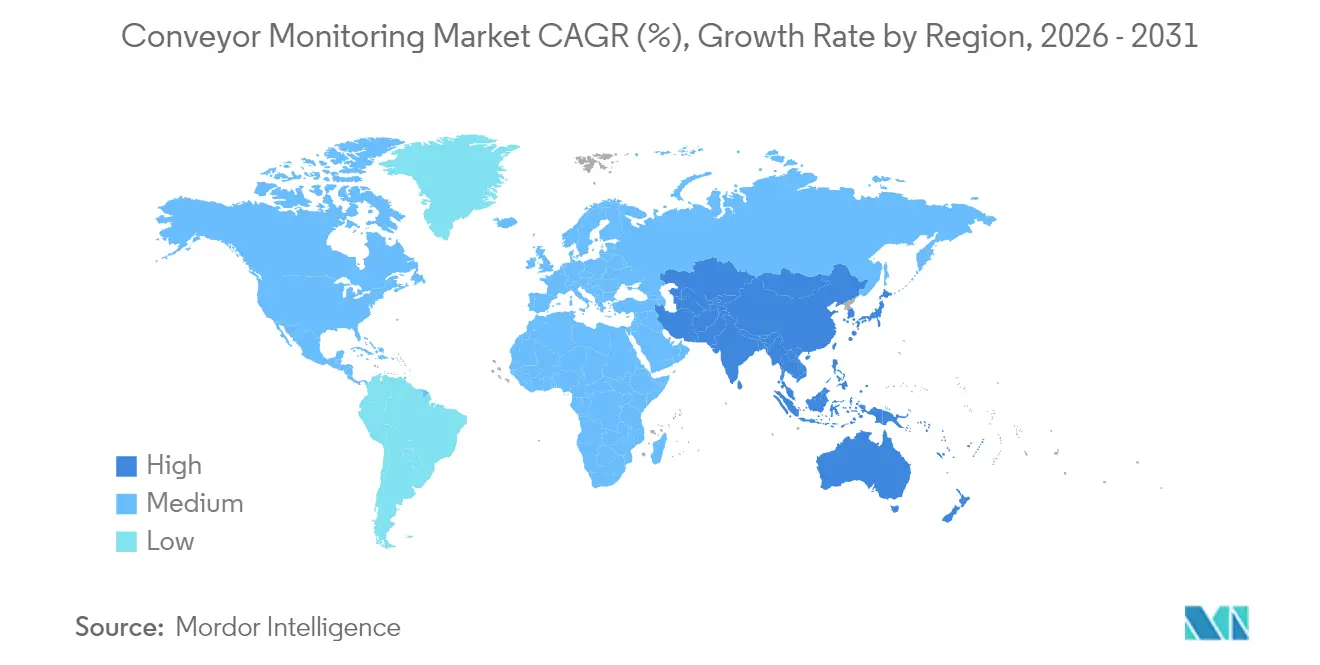
- By geography, North America commanded 35.21% of 2025 sales, while Asia-Pacific shows the highest regional growth at a 4.19% CAGR.
Note: Market size and forecast figures in this report are generated using Mordor Intelligence’s proprietary estimation framework, updated with the latest available data and insights as of 2026.
Market Trends and Insights
Drivers Impact Analysis of Conveyor Monitoring Market*
| Driver | (~) % Impact on CAGR Forecast | Geographic Relevance | Impact Timeline |
|---|---|---|---|
| Rising Adoption of Predictive Maintenance Tools and Techniques | +0.9% | Global, with early concentration in North America and Europe | Medium term (2-4 years) |
| Stringent Workplace Safety Regulations Driving Automation of Conveyor Health Monitoring | +0.7% | North America (MSHA), Europe (Machinery Directive), South Africa, Australia | Short term (≤ 2 years) |
| Rapid Expansion in E-commerce Fulfilment Centres Demanding Continuous Conveyor Uptime | +0.6% | North America, Europe, Asia-Pacific (China, India) | Short term (≤ 2 years) |
| Increasing Throughput Requirements in Mining and Bulk Material Handling | +0.5% | Australia, South America (Chile, Brazil), Africa (South Africa), North America | Medium term (2-4 years) |
| Integration of Low-Cost Wireless IIoT Sensors Enabling Retrofit Monitoring in Legacy Conveyors | +0.4% | Asia-Pacific, South America, Middle East | Medium term (2-4 years) |
| Emergence of Conveyor Digital Twins Combined with Edge Analytics for Real-Time Optimisation | +0.3% | North America, Europe, advanced manufacturing hubs in Asia | Long term (≥ 4 years) |
| Source: Mordor Intelligence | |||
Rising Adoption of Predictive Maintenance Tools and Techniques
Predictive maintenance cuts repair costs by up to 30% and extends asset life by 40% as operators replace time-based checks with sensor-driven, condition-based tasks.[1] Mining companies now stream accelerometer, ultrasonic, and infrared data through edge gateways that forecast bearing failures weeks ahead, keeping conveyors online during 24/7 operations. Low-cost MEMS sensors priced under USD 50, paired with wireless Bluetooth or LoRaWAN modules, make continuous monitoring affordable at scale. Rio Tinto links conveyor health data to autonomous haulage analytics, boosting ore throughput per conveyor kilometer by 15%. Vendors such as ABB clamp retrofit sensors onto existing motors, converting legacy drives into connected assets that transmit vibration, temperature, and magnetic-flux data to mobile dashboards.[2]
Stringent Workplace Safety Regulations Driving Automation of Conveyor Health Monitoring
The U.S. MSHA 30 CFR Part 56 rule requires the detection of belt misalignment and slippage, prompting rapid sensor retrofits in both surface and underground mines.[3] South Africa’s Mine Health and Safety Act carries similar obligations; regulators attribute 12% of 2024 mining fatalities to conveyor incidents, a statistic that accelerated the adoption of continuous belt-rip detection. The EU Machinery Directive requires documented hazard assessments, and the forthcoming EU AI Act will compel audit trails for predictive models, favoring vendors that deliver pre-certified systems. New Zealand tightened conveyor guarding and emergency-stop standards in 2024, prompting upgrades with the addition of proximity sensors and pull-cord switches.
Rapid Expansion in E-Commerce Fulfillment Centers Demanding Continuous Conveyor Uptime
Amazon operates kilometer-scale conveyor networks that sort more than 1,000 parcels per hour and loses up to USD 20,000 for every downtime hour. Predictive monitoring provides 15–30 minutes of warning before critical failures, allowing traffic rerouting around stressed segments. Walmart’s USD 1.1 billion supply-chain automation drive included AI-driven conveyor analytics across 350 regional centers, resulting in a 40% reduction in downtime. DHL achieved a 25% labor-cost reduction after rolling out predictive platforms in 200 warehouses. Always-on operating models and the rise of same-day delivery preserve demand for conveyor monitoring market solutions that function without planned maintenance windows.
Increasing Throughput Requirements in Mining and Bulk Material Handling
High-capacity conveyors now carry up to 15,000 metric tons per hour, which accelerates wear on belts, idlers, and drives. BHP’s 12 km Escondida conveyor added fiber-optic belt monitoring in 2024 and can detect longitudinal rips within 2 seconds, preventing multi-day outages. Anglo American fitted acoustic sensors that identify noisy bearings before failure, allowing swaps during scheduled maintenance. Port grain and coal terminals follow similar tactics to avoid environmental spills and maritime loading delays.
Restraints Impact Analysis of Conveyor Monitoring Market*
| Restraint | (~) % Impact on CAGR Forecast | Geographic Relevance | Impact Timeline |
|---|---|---|---|
| Limited In-House Skillset to Manage Monitoring Solutions and Analyse Data | -0.5% | Global, acute in emerging markets (Southeast Asia, South America, Africa) | Short term (≤ 2 years) |
| High Costs of Installation and Maintenance | -0.4% | Small and mid-sized facilities globally | Short term (≤ 2 years) |
| Uncertain Return on Investment for Small and Mid-Sized Facilities | -0.3% | North America, Europe, Asia-Pacific | Medium term (2-4 years) |
| Cyber-Security Vulnerabilities in Connected Conveyor Systems | -0.2% | Global, critical in regulated industries (mining, food processing) | Medium term (2-4 years) |
| Source: Mordor Intelligence | |||
Limited In-House Skillset to Manage Monitoring Solutions and Analyse Data
The conveyor monitoring market still confronts a shortage of engineers trained in signal processing and predictive analytics. Terabytes of vibration, temperature, and acoustic data often overwhelm existing maintenance teams, especially in Southeast Asia and South America, where technical talent migrates toward higher-wage economies. Vendors answer this skills gap with managed services. Honeywell Forge offers a concierge tier where specialists interpret data weekly and issue prioritized repair lists.
High Costs of Installation and Maintenance
Comprehensive retrofits range from USD 50,000 to USD 150,000 per line, well above annual maintenance budgets for many small factories. Ongoing software licenses and calibration add USD 5,000–15,000 per year. While wireless networks avoid conduit costs, battery replacements and radio interference introduce new upkeep demands. Subscription or leasing models from SKF now spread payments over multi-year periods, bringing barrier-to-entry relief for lower-volume users.
*Our forecasts treat driver/restraint impacts as directional, not additive. The impact forecasts reflect baseline growth, mix effects, and variable interactions.
Conveyor Monitoring Market Segment Analysis
By Type:
Software Platforms Gain Share Despite Hardware DominanceHardware commanded 64.13% of 2025 revenue due to the up-front purchase of sensors, gateways, and control modules, yet software subscriptions are on track for a 4.43% CAGR through 2031, outpacing physical asset growth. This swing highlights how operators strive for further performance gains from existing sensors. Rockwell FactoryTalk Analytics unifies vibration, temperature, and energy data into a single risk score, while Emerson Plantweb Insight enables corporate reliability teams to benchmark across sites.
Growing preference for outcome-based contracts accelerates this shift. Pay-as-you-go models allow plants to test applications before full scale-up, a key incentive in the conveyor monitoring market where budget constraints can delay capital approvals.

By Monitoring Focus:
Motor Monitoring Closes Gap on Belt-Centric SystemsBelt integrity still tops user priority lists, explaining 71.05% of 2025 installations. Fiber-optic cables inside belt carcasses and laser scanners that detect splice misalignment trigger immediate stops, preventing catastrophic downtime. Fenner Dunlop’s Intelliguard solution cuts detection time to under 2 seconds.
Motor monitoring, however, posts a faster 4.62% CAGR, reflecting the reality that electric drives cause 30-40% of unexpected conveyor halts. SKF’s wireless vibration kits and Nidec’s embedded-sensor motors report temperature, current, and imbalance anomalies to cloud dashboards, letting planners replace bearings during scheduled shutdowns. As variable-frequency drives proliferate, users need analytics tuned for harmonic distortion and insulation stress, expanding addressable revenue for the conveyor monitoring market.
By Conveyor Type:
Overhead Systems Rise in Automotive and AerospaceBelt conveyors held 57.21% of 2025 projects because they carry bulk material over long distances at mines, cement plants, and ports. Standardized sensor interfaces make belt systems easy candidates for predictive upgrades.
Overhead conveyors, expanding at a 4.29% CAGR, move vehicle bodies and aerospace parts in three-dimensional space, demanding position tracking and collision avoidance. Ford’s Michigan Assembly Plant uses RFID and optical sensors on overhead lines to reduce work-in-process inventory by 20%. Hybrid lines that mix robots and humans require real-time health scores to synchronize speed and safety, adding edge analytics nodes at every motor group.
By End-User Industry:
Logistics Overtakes Mining in Growth TrajectoryMining accounted for 30.12% of the 2025 spend, as kilometer-long belts are critical path assets where every unscheduled stop can cost USD 50,000–200,000 per hour. Condition monitoring thus rapidly penetrated large copper, iron ore, and coal operations.
Logistics and warehousing now show a 4.08% CAGR as e-commerce giants aim for 99.5% uptime. The conveyor monitoring market size for parcel hubs grows in tandem with same-day delivery commitments; Amazon handled 5.9 billion packages in 2024 and embeds predictive alerts within its warehouse management stack. Food, consumer goods, and automotive producers apply similar logic, tailoring sensor housings for wash-down or paint-shop environments.
Geography Analysis
North America Conveyor Monitoring Market
North America led 2025 revenue with 35.21% of the conveyor monitoring market. Strict MSHA rules mandate continuous belt inspection, and skilled-labor costs above USD 35 per hour strengthen the ROI for predictive systems. Canadian miners in remote regions value monitoring because replacement parts often require helicopter delivery, which can stretch outages if failures go undetected.
APAC Conveyor Monitoring Market
Asia-Pacific records the fastest 4.19% CAGR as China, India, and ASEAN states retrofit legacy lines to hit productivity goals without costly greenfield plants. China’s Ministry of Industry and Information Technology allocated RMB 50 billion to smart manufacturing upgrades in 2024. India’s production-linked incentives reimburse automation spending that improves throughput, spurring software demand across 2,500 new factories built last year. Japan’s aging workforce drives automation to cover shrinking technical head counts.
EMEA and South America Conveyor Monitoring Market
Europe, South America, and the Middle East and Africa supply the balance of global revenue. Germany’s automotive lines integrate conveyor KPIs with Industry 4.0 platforms to maintain flexible mixed-model assembly. Brazil’s Vale installs rip-detection sensors across Minas Gerais after heightened post-Brumadinho oversight. Saudi Arabia’s Vision 2030 allocates USD 500 billion for diversified industrial clusters that emphasize modern materials-handling infrastructure
Regulatory Landscape
Safety and machinery-compliance rules continue to be key adoption levers for conveyor health monitoring, especially in mining and other heavy industrial material handling. In the United States, OSHA rules for conveyors (29 CFR 1926.555) and the mine safety expectations referenced in the report context reinforce belt-alignment, slippage, and emergency-stop-related sensing, while ASME B20.1-2024 acts as an industry safety anchor that shapes guarding, controls, and inspection practices used by OEMs and integrators.
In Europe, the EU Machinery Regulation (EU) 2023/1230, published in 2023, raises compliance stakes for networked machinery by tightening risk assessment and documentation expectations, including digital documentation requirements, with full application referenced for January 2027. In parallel, belt and materials standards are being refreshed, including ISO 14890:2026 for textile-construction conveyor belts, pushing suppliers and end users to align belt specifications and monitoring acceptance criteria for international projects and cross-border equipment sourcing.
Value Chain Analysis
The conveyor monitoring value chain begins with component suppliers providing sensors and measurement hardware (vibration, temperature, ultrasound, current, speed, and machine-vision such as 3D laser profilers and industrial cameras), connectivity modules, and industrial edge gateways. Automation and software vendors then deliver analytics layers that run at the edge and in the cloud, typically integrating with plant control and IT stacks through OPC-UA, Modbus/TCP, and MQTT, and feeding alerts into SCADA, PLC/DCS environments, and enterprise maintenance systems (e.g., CMMS/EAM).
System integrators and specialist condition-monitoring providers combine these elements into ruggedized solutions for mining, ports, manufacturing lines, and logistics hubs, covering installation, calibration, cybersecurity hardening, and ongoing support. Two constraints show up repeatedly in deployments, brownfield integration where proprietary controls restrict data extraction, and data-management requirements where high-bandwidth video or 3D profiling increases compute and storage, making event pre-processing at the edge an important design choice before exceptions reach cloud dashboards.
Competitive Landscape
The top five suppliers, ABB, Siemens, Honeywell, Rockwell Automation, and Emerson, hold an estimated 35-45% conveyor monitoring market share. They bundle sensors, analytics, and integration services, leveraging installed PLC and DCS footprints to cross-sell monitoring add-ons. Specialty firms such as 4B Braime, Fenner Dunlop, and ContiTech dominate belt-rip and splice-integrity niches, differentiating through domain expertise and rugged sensor designs.
Consolidation is ongoing. Rockwell bought Plex Systems for USD 2.2 billion to weave manufacturing execution data into FactoryTalk health dashboards. Emerson merged with AspenTech to fuse process simulation and predictive analytics, forming a USD 16 billion hybrid software-hardware player.
White-space competition centers on low-cost wireless kits priced below USD 25,000 per line. Start-ups ship battery sensors that link straight to cloud APIs, bypassing plant control networks, ideal for remote mines and distributed parcel hubs. Vendors also compete on cybersecurity, making IEC 62443 certification a bidding prerequisite in food, pharma, and critical infrastructure tenders.
Conveyor Monitoring Industry Leaders
-
Eaton Corporation plc
-
Parker Hannifin Corporation
-
ABB Ltd.
-
Emerson Electric Co.
-
ContiTech AG
- *Disclaimer: Major Players sorted in no particular order
Conveyor Monitoring Market Companies Covered in this Report
- ABB Ltd.
- Bando Chemical Industries, Ltd.
- Beltscan Systems Pty Ltd.
- BEUMER Group GmbH and Co. KG
- CBG Conveyor Belt Gateway
- ContiTech AG
- Eaton Corporation plc
- Emerson Electric Co.
- Fenner Dunlop Inc.
- Honeywell International Inc.
- Nidec Motor Corporation
- Parker Hannifin Corporation
- PHOENIX CBS GmbH
- Rockwell Automation, Inc.
- Siemens AG
- SICK AG
- SKF Group
- Strata Worldwide, LLC
- TE Connectivity Ltd.
- Voith GmbH and Co. KGaA
- voestalpine AG
- Yokogawa Electric Corporation
- 4B Braime Group
- Yellow Technical Services (Pty) Ltd.
Market Opportunities and Future Outlook
Retrofit-friendly monitoring that reduces instrumentation overhead remains a clear whitespace, particularly for brownfield conveyors where wiring and installation can drive a large share of project cost. Software-led approaches that infer asset condition from electrical and control signals, rather than adding new sensors, are also gaining traction as vendors expand predictive maintenance coverage beyond belt integrity into motor and drive trains. This direction matches end-user pain points from the report context, including the operational cost of downtime in high-throughput logistics networks and the need for earlier warning in continuous operations.
Mining and bulk material handling continue to serve as proving grounds for higher-fidelity belt diagnostics and closed-loop maintenance workflows. The 2026 industry activity highlighted in the report, including AI-enabled belt inspection and thickness measurement initiatives connected to Escondida-focused upgrades (as reported for Boton), and the shift toward AI-driven rip prevention capabilities via acquisitions (Flexco acquiring SHG Conveyor Control GmbH), supports ongoing solution demand for vendors that can tie together belt health, motor electrical data, and prescriptive actions that connect directly into maintenance work-order systems.
Recent Industry Developments in Conveyor Monitoring Market
- July 2026: Continental announced the sale of its ContiTech group sector to an affiliate of Lone Star Funds for EUR 4.0 billion. The divestment changes ownership and investment priorities for a major conveyor belt and industrial drive systems supplier, which can influence product roadmaps and partner choices for conveyor monitoring deployments.
- April 2026: Eaton launched a new motor analytics software solution for its Brightlayer on-premise software aimed at predicting motor and pump failures in industrial assets, including conveyors, without adding sensors. The release expands the software pathway for condition monitoring by widening coverage through analytics on existing electrical and operational signals, improving retrofit economics for established conveyor fleets.
- November 2025: ABB introduced embedded Electrical Signature Analysis (ESA) technology in drives to enable predictive maintenance for powertrain assets, including conveyors. By embedding diagnostics at the drive level, the company targets earlier detection of motor and drivetrain anomalies and complements sensor-based belt monitoring for sites focused on edge-ready, cyber-hardened modernization.
Conveyor Monitoring Market Report Scope and Research Methodology
Market Definition and Coverage
This market covers the revenue earned from equipment and software used to monitor conveyor operating health and safety, and to flag issues like belt damage, misalignment, overheating, and abnormal vibration across industrial sites.
Scope exclusions: We exclude the conveyor system purchase itself, along with general plant SCADA and non-conveyor condition monitoring that is not dedicated to conveyor assets.
Segments Covered in This Report
- By Type
- Hardware
- Software
- By Type of Monitoring
- Conveyor Belt Monitoring
- Conveyor Motor Monitoring
- By Conveyor Type
- Belt Conveyors
- Roller Conveyors
- Overhead Conveyors
- Pallet Conveyors
- Screw and Other Specialty Conveyors
- By End-user Industry
- Automotive
- Consumer Goods Packaging
- Mining
- Food and Beverage
- Logistics and Warehousing
- Other End-user Industries
- By Geography
- North America
- United States
- Canada
- South America
- Brazil
- Mexico
- Argentina
- Rest of South America
- Europe
- Germany
- United Kingdom
- France
- Italy
- Rest of Europe
- Asia-Pacific
- China
- Japan
- India
- South Korea
- Rest of Asia-Pacific
- Middle East and Africa
- Middle East
- United Arab Emirates
- Saudi Arabia
- Rest of Middle East
- Africa
- South Africa
- Nigeria
- Rest of Africa
- Middle East
- North America
Data Sources, Market Sizing, and Validation
Desk Research
Desk work was used to pin down the demand environment where conveyor monitoring is usually installed, then translate it into realistic adoption ranges. We leaned on public sources such as US MSHA safety data, US OSHA injury logs guidance, USGS mineral commodity statistics, the World Steel Association releases, and World Bank industrial output indicators to understand activity cycles that influence conveyor uptime spending.
Beyond this, we reviewed annual reports, investor decks, product catalogs, and trusted press coverage to map common monitoring functions and typical deployment contexts (mines, bulk terminals, ports, cement plants, and large factories). We also used paid subscriptions for company financials and intelligence, patent databases, and import-export shipment-level signals where they helped confirm technology direction and the flow of sensing components. These sources are not exhaustive, and we also used additional public documents to collect data points, validate assumptions, and clarify unclear terms.
Primary Interviews and Surveys
Primary calls and structured surveys were used to validate what is actually bought, how often systems are upgraded, and which plants prioritize belt versus motor monitoring. We spoke with stakeholders across solution providers, system integrators, maintenance teams, and safety and reliability roles, then compared responses across major regions so the adoption assumptions do not reflect just one operating style.
Distribution of primary research fieldwork respondents
| Company type | Respondent position | Region |
|---|---|---|
| Top tier: 28% | CXOs: 21% | APAC: 46% |
| Mid tier: 50% | Functional/Unit leaders: 23% | EMEA: 31% |
| Smaller Players: 22% | Managers: 56% | Americas: 23% |
Market-Sizing & Forecasting
Sizing starts with a top-down build where industrial activity and safety intensity are translated into an addressable installed base for monitored conveyors, then filtered through adoption rates and typical annual spending. To keep it practical, we track inputs such as mining output and metals production, bulk material handling expansions, plant maintenance intensity, safety and compliance pressure, and the mix shift toward predictive maintenance (illustrative variables that are refreshed during updates).
Those totals are then checked with selective bottom-up approximations, such as sampled price bands for sensors and software, typical monitoring points per conveyor line, and channel feedback on retrofit versus new-install shares. When data is missing in certain countries or for specific end users, we start with proxy indicators and then correct through expert re-contacts so the final number stays realistic.
For forecasting, we relied mainly on scenario analysis supported by simple trend fitting on the key drivers. The scenarios were adjusted after primary feedback on budgets, downtime costs, and likely retrofit timing. Where needed, currency assumptions are normalized to the pricing year used in the model so growth is not overstated by exchange swings.
Data Validation & Update Cycle
Outputs are cross-checked against independent signals, including capex cycles in bulk handling industries, safety incident trends, and the pace of automation upgrades discussed by practitioners. If a regional result looks too high or too low, the drivers are replayed, assumptions are stress-tested, and the team re-contacts sources when the variance cannot be explained.
Before sign-off, the model goes through multiple analyst reviews, where line items and growth rates are reconciled with the narrative and with any new public datapoints that emerged during drafting. Reports are refreshed annually, and interim updates are triggered when major regulations, commodity swings, or supply constraints are large enough to shift short-term demand. Right before delivery, a fresh pass is done so the client receives the latest updated view.
Mordor Intelligence's Conveyor Monitoring Market Size Compared Against Other Published Estimates
Published market sizes for conveyor monitoring can look far apart because each publisher draws the boundary differently and also uses different demand signals to anchor adoption. Even small choices, like whether to count general automation monitoring as part of conveyor monitoring, can move the final value by a noticeable amount.
MSHA and OSHA safety signals, along with industrial output and mining activity indicators, are used as evidence checks that keep Mordor Intelligence's estimate tied to spending specific to conveyor belt and motor monitoring rather than broader plant monitoring. Differences also come from how software is treated, since some estimates include wider IIoT platforms, and from how currency timing and price progression are handled when inflation and exchange rates move quickly.
Benchmark comparison
| Source | Market Size | Gaps in Research Methodology |
|---|---|---|
| Mordor Intelligence | USD 262.89 M (2025) | |
| Industry Publisher A | USD 254.00 M (2025) | Uses a narrower value capture that can undercount retrofit monitoring packages and related software, and the pricing year assumptions are not clearly stated for inflation normalization. |
| Trade Data Publisher B | USD 185.60 M (2024) | Leans heavily on a simplified type split and reported sales signals, which can miss services and software revenue, and the shorter forecast framing suggests lighter validation of end-user adoption rates. |
The spread in the table is mainly explained by scope boundaries and how demand is anchored to real conveyor monitoring installs, not by a single math step. When the market is kept limited to conveyor-specific monitoring hardware, software, and related services, and then checked against practical adoption drivers, the final output stays easier to trace and repeat year to year.
Key Questions Answered in the Report
How fast is the conveyor monitoring market expected to grow to 2031?
Global revenue is forecast to expand from USD 271.99 million in 2026 to USD 322.35 million by 2031, posting a 3.46% CAGR.
Which segment adds the most revenue today?
Hardware components, sensors, controllers, and communication modules, represent 64.13% of 2025 revenue.
What drives adoption in e-commerce facilities?
Fulfillment centers lose up to USD 20,000 per hour during unplanned conveyor outages, so predictive monitoring offers quick ROI by cutting downtime up to 40%.
Why is motor monitoring gaining momentum?
Electric drives cause 30–40% of conveyor stoppages, and vibration analysis catches bearing or alignment faults weeks early, fueling a 4.62% CAGR for motor monitoring solutions.
Which region is growing the fastest?
Asia-Pacific shows the highest regional CAGR at 4.19% because China, India, and ASEAN nations subsidize Industry 4.0 retrofits in manufacturing.