
Controlled Release Drug Delivery Market Size and Share
Market Overview
| Study Period | 2020 - 2031 |
|---|---|
| Market Size (2026) | USD 73.28 Billion |
| Market Size (2031) | USD 115.34 Billion |
| Growth Rate (2026 - 2031) | 9.49 % |
| Fastest Growing Market | Asia-Pacific |
| Largest Market | North America |
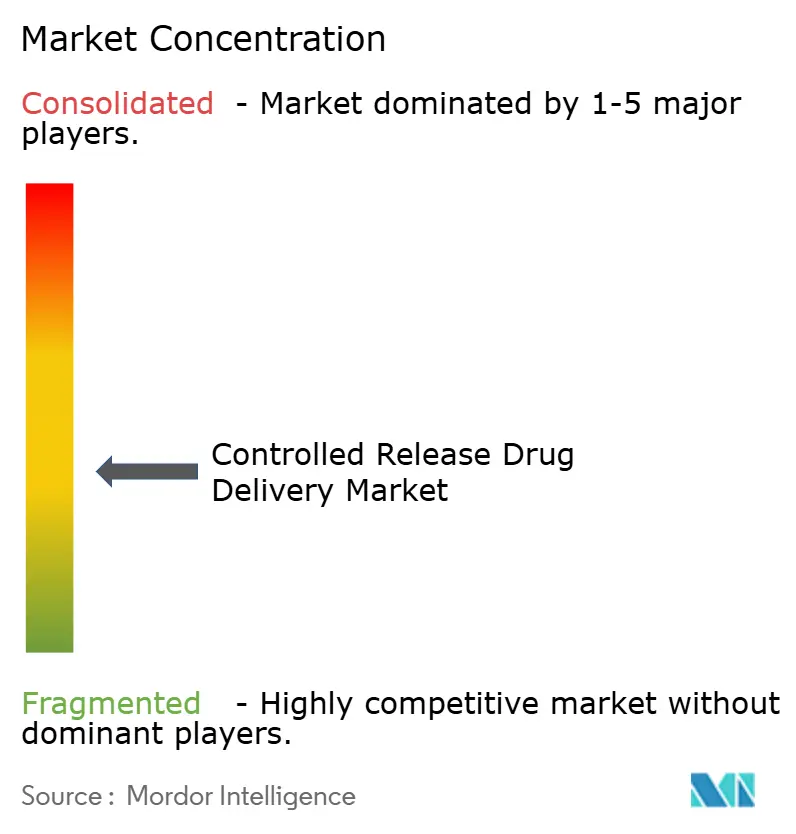
| Market Concentration | Medium |
Major Players *Disclaimer: Major Players sorted in no particular order Image © Mordor Intelligence. Reuse requires attribution under CC BY 4.0. | |
Controlled Release Drug Delivery Market Analysis by Mordor Intelligence
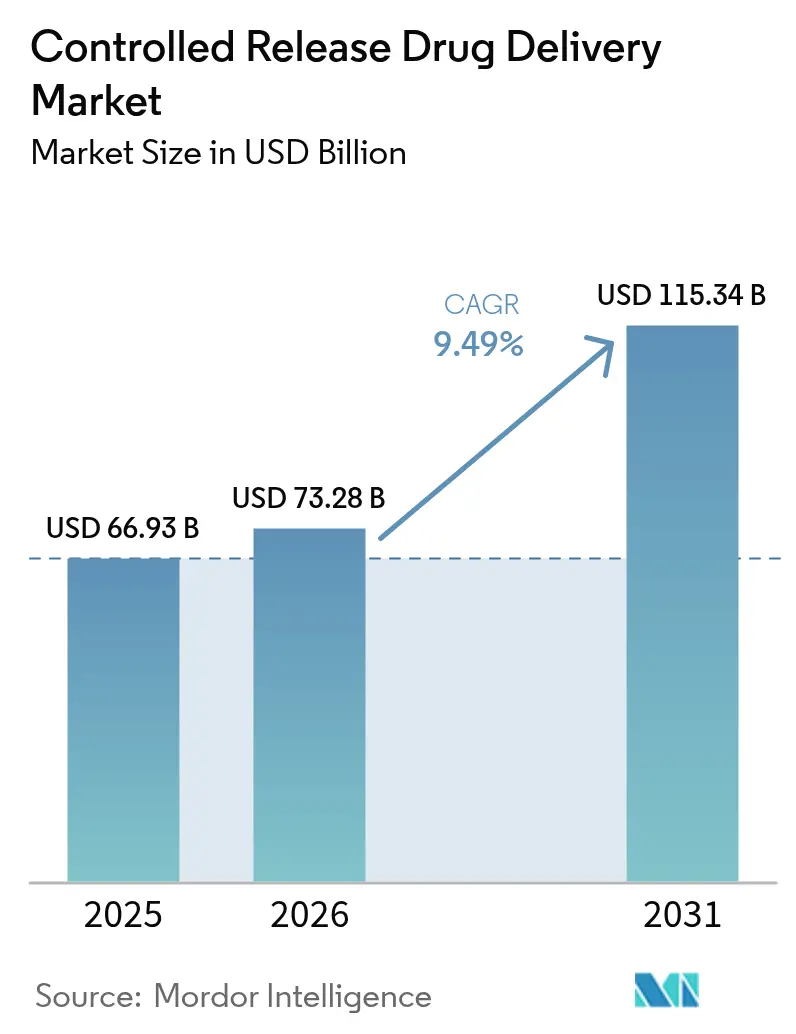
The controlled release drug delivery market size was valued at USD 66.93 billion in 2025 and estimated to grow from USD 73.28 billion in 2026 to reach USD 115.34 billion by 2031, at a CAGR of 9.49% during the forecast period (2026-2031). Expanding chronic-disease prevalence, wider use of biologics, and fresh advances in polymer science together steer this growth momentum. Investors are focusing on long-acting formulations that improve drug exposure profiles, reduce systemic side effects, and lengthen product lifecycles. Active capital flows into large-molecule manufacturing, increased adoption of patient-centric dosing, and meaningful repurposing of lipid nanoparticle infrastructure further widen the therapeutic and commercial runway for the controlled release drug delivery market. Strategic advantages accrue to firms that couple in-house formulation know-how with broad commercialization networks, while nimble CDMOs carve out complex formulation niches for fast-moving specialty players.
Key Report Takeaways
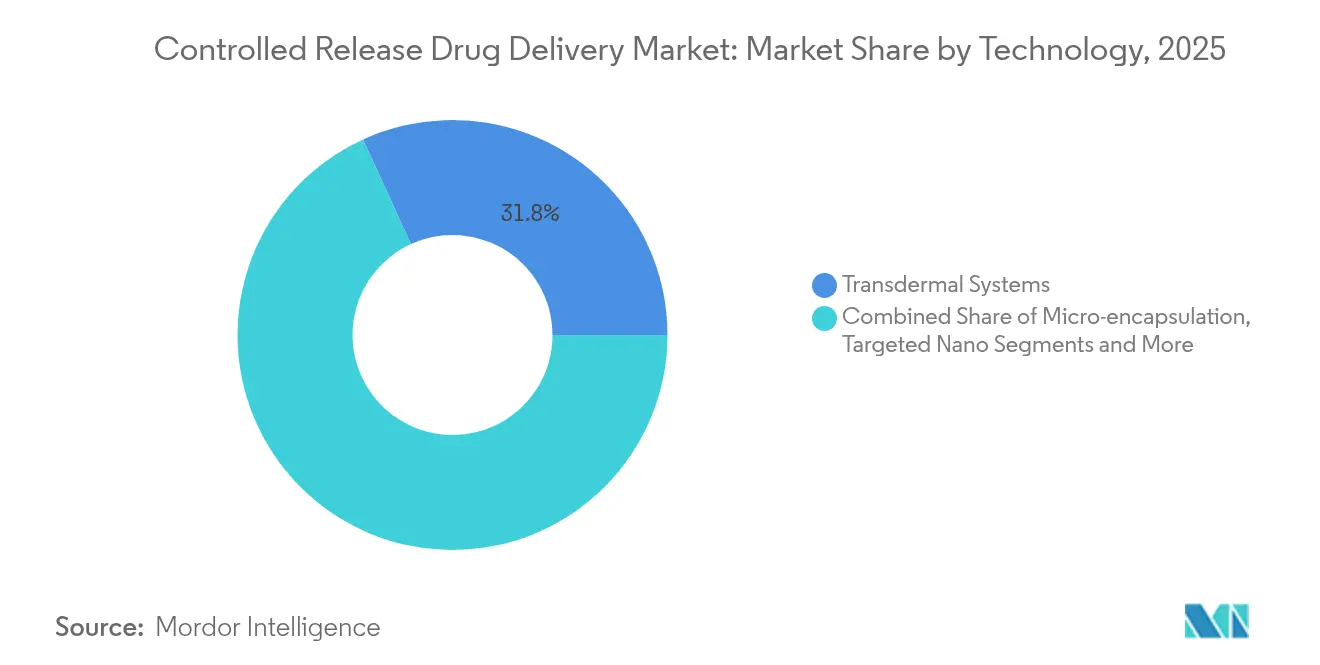
- By technology, transdermal systems held 31.83% of controlled release drug delivery market share in 2025; targeted nano/lipid carriers are projected to expand at a 12.05% CAGR through 2031.
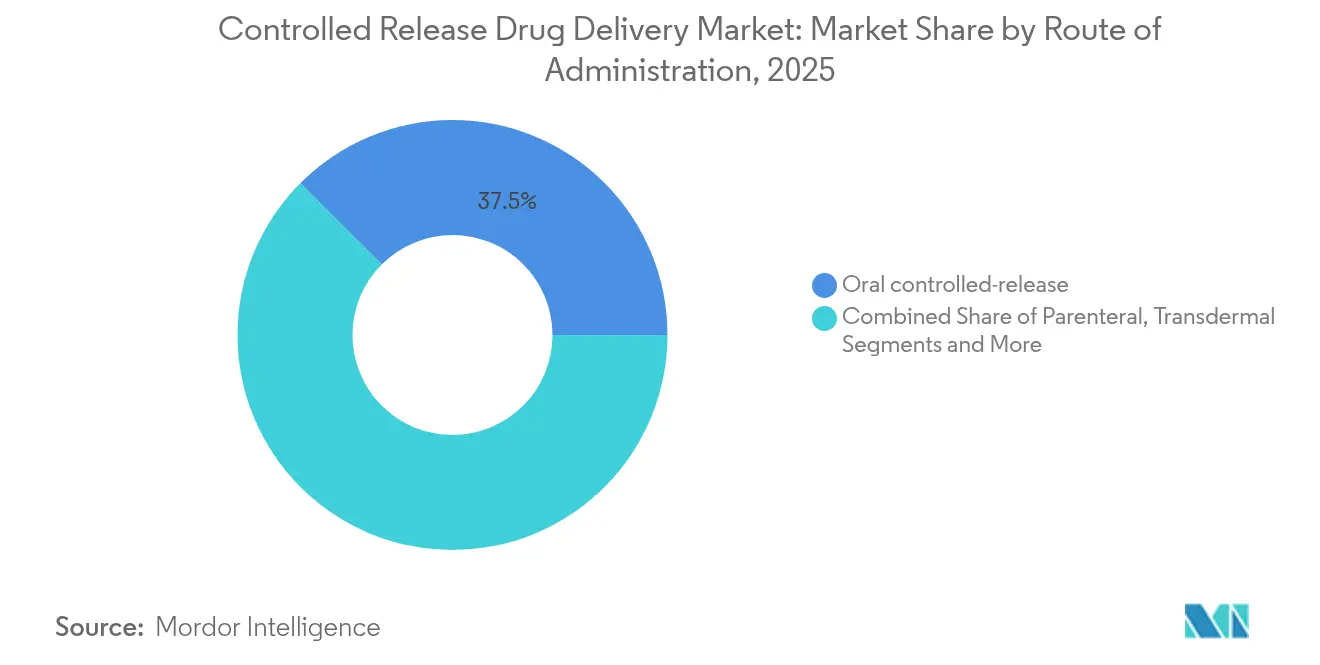
- By route, oral formulations accounted for 37.52% share of the controlled release drug delivery market size in 2025, while parenteral injectables are advancing at an 11.23% CAGR through 2031.
- By polymer, PLGA/PLA systems captured 25.94% share of the controlled release drug delivery market size in 2025; lipid nanoparticles lead growth at a 12.28% CAGR, powered by mRNA process know-how.
- By geography, North America dominated with 36.02% share in 2025, but Asia Pacific is forecast to clock an 11.52% CAGR to 2031.
Note: Market size and forecast figures in this report are generated using Mordor Intelligence’s proprietary estimation framework, updated with the latest available data and insights as of 2026.
Global Controlled Release Drug Delivery Market Trends and Insights
Drivers Impact Analysis*
| Driver | (~) % Impact on CAGR Forecast | Geographic Relevance | Impact Timeline |
|---|---|---|---|
| Escalating chronic-disease burden | +2.1% | Global, strong in North America & Europe | Long term (≥ 4 years) |
| Rapid growth in geriatric & pediatric cohorts | +1.8% | Global, especially APAC and North America | Medium term (2-4 years) |
| Breakthroughs in micro-/nano-encapsulation polymers | +1.5% | North America & EU, spreading to APAC | Medium term (2-4 years) |
| Shift toward once-weekly/monthly dosing | +1.2% | Global, led by developed markets | Short term (≤ 2 years) |
| mRNA-lipid infrastructure repurposed | +0.9% | North America & EU, selective APAC markets | Medium term (2-4 years) |
| AI-driven formulation optimization platforms | +0.7% | Global, focused in innovation hubs | Long term (≥ 4 years) |
| Source: Mordor Intelligence | |||
Escalating chronic-disease burden
Diabetes, cardiovascular disease, and cancer together affect more than 1.5 billion people and require therapies that promote adherence over many years. Controlled release tablets such as extended-release ketamine achieved a 6.1-point decline in MADRS scores versus placebo while limiting adverse reactions, demonstrating the clinical pay-off from stable plasma profiles.[1]Healthcare buyers under value-based payment rules favor regimens that lower readmissions, which supports ongoing expansion of the controlled release drug delivery market. Firms also rely on long-acting platforms to refresh generic molecules and defend exclusivity as biologics meet biosimilar pressure.
Rapid growth in geriatric & pediatric cohorts
Older adults often juggle five or more prescriptions each day; children need palatable options at lower strengths. Innovations such as Lonza’s Enprotect size 9 capsule allow acid-sensitive actives to release in the intestine without extra coatings, cutting formulation steps. Weekly oral risperidone maintained steady plasma levels in schizophrenia patients and raised satisfaction scores in phase 3 trials, showing that the controlled release drug delivery market can address adherence for vulnerable populations.
Breakthroughs in micro-/nano-encapsulation polymers
PLGA implants now pair with 3D printing for patient-matched shapes that release drug in tune with individual metabolism.[2] Wearable osmotic microneedle patches held steady drug delivery for 24 hours and caused minimal discomfort, underscoring how polymer science revitalizes mature molecules.[3] Such progress widens therapeutic windows and strengthens the competitive profile of the controlled release drug delivery market.
Shift toward once-weekly/monthly dosing
Long-acting lenacapavir cut HIV infections to zero over 5,300 subjects, illustrating demand for therapy that moves from daily pills to twice-yearly injections. Copolymer technology in Teva’s once-monthly olanzapine produced 92% patient satisfaction and shows how reduced visit load can reshape psychiatric care ir.tevapharm.com. These design shifts raise the growth ceiling for the controlled release drug delivery market by meeting payer and patient preferences.
Restraints Impact Analysis*
| Restraint | (~) % Impact on CAGR Forecast | Geographic Relevance | Impact Timeline |
|---|---|---|---|
| High CMC & scale-up costs vs. conventional forms | −1.4% | Global, heavier in emerging markets | Medium term (2-4 years) |
| Complex multi-jurisdictional regulatory pathway | −1.1% | Global, varied by region | Long term (≥ 4 years) |
| API stability challenges inside long-acting matrices | −0.8% | Global, notable in biologics | Medium term (2-4 years) |
| Tight global supply of specialized GRAS excipients | −0.6% | Global, supply anchored in Asia | Short term (≤ 2 years) |
| Source: Mordor Intelligence | |||
High CMC & scale-up costs vs. conventional forms
Sophisticated release coatings and multi-layer tablets demand analytical protocols that stretch development by up to two years relative to immediate-release pills, boosting cost and complexity. Smaller firms often outsource to CDMOs, paying a premium that narrows price competitiveness in cost-sensitive markets, tempering uptake within the controlled release drug delivery market.
Complex multi-jurisdictional regulatory pathway
Distinct bioequivalence and dissolution criteria among the FDA, EMA, and emerging-market agencies compel duplicate studies and site audits. Pending European restrictions on titanium dioxide illustrate how sudden excipient policy shifts can trigger full reformulations, delaying launches and dampening revenue visibility. Such uncertainty slows cross-border roll-outs in the controlled release drug delivery market.
*Our forecasts treat driver/restraint impacts as directional, not additive. The impact forecasts reflect baseline growth, mix effects, and variable interactions.
Segment Analysis
By Technology: Nano-carriers Drive Innovation Despite Transdermal Dominance
Transdermal platforms led the controlled release drug delivery market with a 31.83% revenue share in 2025, owing to ease of self-administration and proven manufacturing lines. Nano- and lipid-based systems, however, are set to post a 12.05% CAGR through 2031 as precision medicine rises. Osmotic pump tablets sustain zero-order kinetics unaffected by food intake, while implantable pumps meet oncology needs for local micro-dosing. LNPs leverage pandemic-era capacity to speed oncology and protein replacement programs, cementing their place in the controlled release drug delivery market.
Competitive focus now centers on carrier architecture. Branched-tail LNPs direct mRNA payloads to lung dendritic cells, widening respiratory applications. Push-pull osmotic tablets remove variability from gastric pH, aiding chronic disease control. Together these advances give manufacturers flexibility to match molecule, route, and patient need, helping the controlled release drug delivery market sustain robust innovation cycles.

By Route of Administration: Parenteral Growth Challenges Oral Supremacy
Oral units remained the largest route with 37.52% share of the controlled release drug delivery market size in 2025, supported by cost-efficient lines and high patient familiarity. Parenteral injectables will post an 11.23% CAGR to 2031 as biologics advance and device makers refine safety syringes. Transdermal products cater to opioid-sparing pain management and hormone care, while inhaled formats speed systemic entry for acute crises.
Direct bioavailability remains a core advantage. Teva’s generic Sandostatin LAR showed that mastering depot injections can unlock large revenue pools even when patents expire. Programmable injectors plus longer intervals ease clinic traffic, making injectables a top target for new entrants seeking differentiation within the controlled release drug delivery market.
By Polymer/Carrier Type: Lipid Systems Accelerate Past Traditional Polymers
PLGA / PLA matrices still anchor 25.94% of the controlled release drug delivery market share in 2025 for their predictable erosion and regulatory familiarity. Yet lipid nanoparticles are climbing at a 12.28% CAGR on the back of mRNA success. Ionizable lipids, phospholipids, cholesterol, and PEG lipids form a modular kit that scientists tune for organ specificity and immune avoidance, giving LNPs cross-therapy appeal.
Alternative polymers also gain ground. PEG blends raise solubility for hydrophobic APIs, while cellulose ethers lower cost for immediate global scaling. Evonik’s broad CDMO menu covers lipid nanoparticles, polymeric microparticles, and drug-loaded implants, allowing customers to transition smoothly between carriers as program needs evolve. This growing material toolkit broadens addressable indications and cements a high-growth outlook for the controlled release drug delivery market.
Geography Analysis
North America maintained leadership with 36.02% revenue in 2025, enabled by strong R&D outlays, rapid FDA breakthrough designations, and a deep skilled labor pool. Lilly’s USD 9 billion Indiana build-out for tirzepatide illustrates continuing commitment to complex production on-shore. Novo Nordisk’s USD 4.1 billion expansion in North Carolina doubles peptide capacity, securing supply for long-acting injectables. These investments strengthen local sourcing for the controlled release drug delivery market.
Asia Pacific is projected to be the fastest region with an 11.52% CAGR, powered by regulatory harmonization through the Pharmaceutical Inspection Co-operation Scheme and large-scale capital projects. China approved 40 innovative drugs in 2023 under accelerated reviews and logged 18,503 registration filings, underscoring pipeline depth. Lonza’s capsule lines in India and China and WuXi STA’s 169-acre Taixing API hub reveal supply-side commitment to support local and global demand.
Europe shows steady uptake. The region’s tight quality codes create a reputation edge that appeals to multinational sponsors. CordenPharma’s €900 million peptide platform expansion across Colorado and European sites bridges transatlantic supply for GLP-1 compounds in obesity and diabetes care. Lonza’s Innovaform Accelerator in France accelerates formulation co-development, giving EU clients fast access to controlled release expertise. Pan-regional alignment under the European Medicines Agency also helps smaller firms navigate the controlled release drug delivery market with fewer duplicative filings.

Regulatory Landscape
Regulation for controlled release drug delivery spans drug, device, and combination-product requirements, with major benchmarks set by the US FDA and the European Medicines Agency (EMA). In June 2024, the FDA issued final guidance on Essential Drug Delivery Outputs for devices intended to deliver drugs and biological products, sharpening design-output expectations for drug-device combinations where delivery performance is integral to dose and safety. For modified release oral products, EMA scientific guidelines continue to emphasize a defined pharmaceutical development approach that links pharmacokinetics to in vitro dissolution behavior and requires verification at commercial scale to support consistent performance.
Regulatory scrutiny also extends across lifecycle management and development modernization. The FDA change-control framework for modified release products requires documentation commensurate with the level of post-approval change (for example, components, sites, or processes), increasing the operational burden for formulation and manufacturing updates. In March 2026, the FDA published draft guidance on General Considerations for the Use of New Approach Methodologies (NAMs) in drug development, reinforcing momentum toward alternative and more human-relevant evidence generation that can influence how controlled release formulations and drug-device combinations are justified in submissions.
Value Chain Analysis
The value chain starts with inputs (GMP-grade polymers such as PLGA/PLA, lipid excipients, permeation enhancers, adhesives, and device components) and moves through formulation development, analytical method development, scale-up, and GMP manufacture of drug product, followed by fill-finish, packaging, distribution, and post-market surveillance. Documentation and quality packages (for example, DMFs, COAs, and validation files) are central handoffs across the chain, particularly where drug-constituent part interfaces must be characterized and controlled for drug-device combinations.
Supply continuity and manufacturing models are active pressure points. Dependence on imported high-purity biodegradable polymers is a notable sensitivity for some supply chains, with long lead times adding risk during scale-up and commercialization. In June 2026, the FDA highlighted participation by companies including Eli Lilly, Regeneron, Amneal, Cellares, Fujifilm Biotechnologies, and Kriya in initiatives to support and strengthen domestic drug manufacturing, aligning with broader industry efforts to harden supply and shorten response times for complex products such as long-acting injectables and advanced controlled release systems. In July 2026, the FDA proposed amendments to drug establishment registration requirements to create a single registration pathway for distributed manufacturing establishments operating at multiple physical locations, signaling regulatory adaptation to newer multi-site production networks that can affect how controlled release products are scaled and supplied.
Competitive Landscape
The controlled release drug delivery market shows moderate consolidation. Top pharmaceutical firms lean on vertical integration to pair discovery with proprietary delivery, defending margins as small-molecule price pressure rises. Johnson & Johnson’s TAR-200 system earned FDA breakthrough status and posted an 82.4% complete response in high-risk NMIBC, demonstrating how device-drug combos can command premium pricing. Patent filings for branched lipids, silyl lipids, and nucleic acid carriers reinforce a steady innovation cadence across leading firms.
CDMOs gain share by offering turnkey capabilities for sponsors lacking capital or expertise. Lonza reorganized around core CDMO franchises and projects CORE EBITDA margins near 30% by 2025, revealing scale benefits in complex formulation services. Evonik positions as a preferred partner for polymeric systems, while Hovione’s joint venture with Zerion Pharma leverages Dispersome to fix drug solubility gaps. Strategic deals such as Merck’s USD 493 million license with Cyprumed for oral peptides show big-pharma appetite to buy proven platforms rather than build in-house.
Device companies broaden access with injection pens, smart pumps, and microneedle wearables. BD’s glass prefillable syringe integrated into YpsoMate delivers high-viscosity biologics, removing a barrier for subcutaneous GLP-1 drugs. Medtronic’s adaptive deep brain stimulation system ferries insights from real-time signals, hinting at future closed-loop delivery possibilities. Such devices expand the controlled release drug delivery market by linking formulation science with digital health.
Controlled Release Drug Delivery Industry Leaders
-
Johnson and Johnson
-
GlaxoSmithKline
-
Pfizer
-
Merck & Co.
-
Novartis
- *Disclaimer: Major Players sorted in no particular order
Market Opportunities and Future Outlook
A near-term opportunity exists in long-acting injectable depots and localized drug releasing systems that reduce dosing frequency and shift care from frequent administration toward monthly or longer intervals. Teva's February 2026 NDA acceptance for TEV-749, an olanzapine extended-release injectable suspension that uses Medincell's SteadyTeq copolymer technology, demonstrates sponsor appetite to differentiate established molecules through controlled release and extend product lifecycles.
Manufacturing and development toolchains also present whitespace as programs move from batch, multi-step coating and emulsification toward more controllable, scalable approaches. Evidence emerging in 2026 research points to programmable platforms (such as 3D-printed, modular pulsatile delivery devices) and faster particle synthesis routes (for example, continuous reactor cascades for PLGA nanospheres) that can compress development cycles and improve reproducibility, which is particularly relevant as regulators emphasize method robustness and lifecycle controls (including alignment with evolving expectations referenced alongside ICH Q14).
Recent Industry Developments
- June 2026: Johnson & Johnson presents positive Phase 1 results for its intravesical drug-releasing system Erda-iDRS (formerly TAR-210) in intermediate-risk non-muscle-invasive bladder cancer at the EAU 2026 Annual Meeting. The update underscores continued investment in localized, device-enabled controlled release to deliver drug at the site of disease while limiting systemic exposure.
- November 2025: Lupin launches risperidone extended-release injectable suspension in the United States, the first product from its proprietary PrecisionSphere long-acting injectable platform, alongside 180-day CGT exclusivity. The launch strengthens Lupin's positioning in complex injectable depots, where platform control over release kinetics can support lifecycle expansion across additional molecules.
- September 2024: Johnson & Johnson received US FDA approval for INLEXZO (gemcitabine intravesical system), an intravesical drug-releasing system (iDRS) for BCG-unresponsive non-muscle-invasive bladder cancer. The approval reinforced regulatory and clinical traction for drug-device combination approaches in controlled release that target high-unmet-need oncology settings.
Research Methodology Framework and Report Scope
Market Definition and Coverage
This market covers global revenues generated from prescription-grade dosage forms and delivery systems designed to release an active pharmaceutical ingredient at a planned rate for six hours or longer. The intended outcome is to keep therapeutic levels within a longer dosing interval, which typically reduces dose frequency.
Scope exclusions: We exclude immediate-release products, bulk API sales, and over-the-counter nutraceutical slow-release products.
Segmentation Overview
- By Technology
- Micro-encapsulation
- Transdermal Systems
- Long-acting Injectable Depots
- Targeted Nano / Lipid Carriers
- Implantable Pumps & Stents
- Osmotic Pump Tablets
- By Route of Administration
- Oral Controlled-Release
- Parenteral (Injectable)
- Transdermal
- Inhalation
- Ocular
- By Polymer / Carrier Type
- PLGA / PLA
- PEG & PEG-blends
- Cellulose Derivatives
- Lipid Nanoparticles / SLNs
- Polyanhydrides
- By Geography
- North America
- United States
- Canada
- Mexico
- Europe
- Germany
- United Kingdom
- France
- Italy
- Spain
- Rest of Europe
- Asia-Pacific
- China
- Japan
- India
- Australia
- South Korea
- Rest of Asia-Pacific
- Middle East and Africa
- GCC
- South Africa
- Rest of Middle East and Africa
- South America
- Brazil
- Argentina
- Rest of South America
- North America
Data Sources, Market Sizing, and Validation
Desk Research
Desk research was used to build the base structure of the model and to keep assumptions tied to public, repeatable data. We reviewed regulatory and clinical context from sources such as the US FDA (including labeling and drug approval databases) and the National Institutes of Health clinical trials registry to identify which controlled-release formats are actively used and developed. For demand signals, we also referenced sources such as the OECD health statistics, World Bank health indicators, and WHO publications that track chronic disease burden and treatment access.
To ground adoption timing and revenue patterns, we checked industry signals through company annual reports, investor presentations, and reputable press coverage on launches and technology adoption. In a few cases, we used paid subscriptions for company financials and intelligence, patent databases, and news and financials to fill gaps in historical revenue mapping and to cross-check product transition timing. The sources listed above are illustrative only, and we also used other public documents and datasets for data collection, validation, and clarification.
Primary Interviews and Surveys
Primary work focused on validating what counts as controlled-release revenue in real buying situations, and then stress-testing pricing and mix assumptions that desk research often leaves unclear. We spoke with a spread of formulation and manufacturing experts, commercial leaders, and healthcare-facing stakeholders across major regions, so regional adoption patterns and route preferences could be compared using the same controlled-release definitions. Where answers differed, we re-checked assumptions with follow-up questions until a stable range for volumes, price bands, and therapy-area exposure was reached.
Distribution of primary research fieldwork respondents
| Company type | Respondent position | Region |
|---|---|---|
| Top tier: 34% | CXOs: 15% | APAC: 53% |
| Mid tier: 46% | Functional/Unit leaders: 41% | EMEA: 29% |
| Smaller Players: 20% | Managers: 44% | Americas: 18% |
Market-Sizing & Forecasting
We sized the market using a top-down build that reconstructs the controlled-release demand pool by linking treated patient volumes and prescription patterns to the share of therapies using extended or controlled-release formats. We then converted that demand into value using price bands by route and dosage form. The totals were checked with selective bottom-up approximations, where supplier revenue roll-ups, sampled ASP times volume, and channel checks were used to confirm order of magnitude and adjust outliers.
Key inputs included the chronic disease treated population, therapy adherence pressure (which influences extended-release switching), the route of administration mix (oral, transdermal, injectable, inhalation, ocular, and implant), the launch cadence of long-acting and extended-release products, and observed price dispersion between legacy and advanced delivery formats. For forecasting, scenario analysis was used, since regulatory timing, payer behavior, and technology adoption can shift growth rates quickly. The final path was aligned to what primary experts described as practical for the next five to seven years. When bottom-up detail was missing for niche routes, we applied conservative penetration ranges, then rebalanced the mix so the final market continued to match the top-down demand signals.
Data Validation & Update Cycle
Outputs were checked using multiple consistency tests so the final values do not rely on a single dataset or assumption. We compared model totals against independent signals such as route-level adoption trends, product approval timing, and observed pricing ranges. When large variance appeared, we re-checked inputs and completed a second analyst review before sign-off.
Reports are refreshed annually, with interim updates when material events occur, such as major approvals, safety actions, or reimbursement changes that can shift demand. Before delivery, an analyst runs a fresh pass on key assumptions and the latest public signals, which helps ensure clients receive an updated view rather than a stale snapshot.
Mordor Intelligence's Controlled Release Drug Delivery Market Size Versus Other Published Estimates
Published market numbers for controlled-release drug delivery often vary because the same terminology can refer to different scope definitions, and because pricing and product-mix assumptions are not always presented in a way that can be reproduced. Differences also show up when one estimate is built from therapy demand signals, while another emphasizes technology narratives or broad drug delivery totals.
The main gap drivers here are scope and counting rules, along with how revenue is assigned across delivery routes and whether adjacent categories are mixed in. Some sources appear to include device and stent-related revenue or broader drug delivery technologies, while others apply narrower definitions that can undercount long-acting formats in higher-value therapies. They may then extend those totals using a single CAGR. Those choices change the starting value, which then compounds into a wider spread across forecast years.
Benchmark comparison
| Source | Market Size | Gaps in Research Methodology |
|---|---|---|
| Mordor Intelligence | USD 66.93 B (2025) | |
| Financial News Outlet A | USD 37.50 B (2025) | Uses a narrower market base that blends mechanism-level definitions and may treat several controlled-release applications as optional add-ons, which can reduce counted revenue for mainstream oral and long-acting formats. |
| Industry Materials Supplier B | USD 56.00 B (2024) | Provides a directional 2024 value and a broad outlook, but it does not clearly separate prescription controlled-release revenues from adjacent drug delivery technologies, which can shift totals depending on inclusion choices and year conversion. |
The table shows that the biggest swings are explained by what gets counted as controlled-release revenue and how route and application boundaries are handled, not by a simple math difference. By keeping the release duration rule, route coverage, and inclusion exclusions consistent across years, the estimate is anchored to repeatable demand and pricing checks. This is a modeling choice applied by Mordor Intelligence.
Key Questions Answered in the Report
What is the current value of the controlled release drug delivery market?
The market is worth USD 73.28 billion in 2026 and is on track to reach USD 115.34 billion by 2031.
Which technology segment is growing fastest?
Targeted nano- and lipid-based carriers are expanding at a 12.05% CAGR, making them the technology growth leader.
Why is Asia Pacific growing quickly in this space?
Accelerated regulatory harmonization, large patient pools, and new manufacturing plants are pushing Asia Pacific to an 11.52% CAGR.
What are the main hurdles for companies entering this market?
High Chemistry, Manufacturing, and Controls (CMC) costs and multi-region regulatory complexity raise both capital and time requirements.
How does controlled release benefit patients with chronic diseases?
Longer-acting formulations cut dosing frequency, improve adherence, and often reduce side effects by smoothing plasma concentration profiles.
Which polymers dominate current controlled release products?
PLGA / PLA systems remain the most used polymers today, though lipid nanoparticles are moving up fastest thanks to mRNA vaccine infrastructure.