
Market Overview
| Study Period | 2020 - 2031 |
|---|---|
| Market Size (2026) | USD 29.04 Billion |
| Market Size (2031) | USD 40.53 Billion |
| Growth Rate (2026 - 2031) | 6.89 % |
| Fastest Growing Market | Middle East and Africa |
| Largest Market | Asia Pacific |
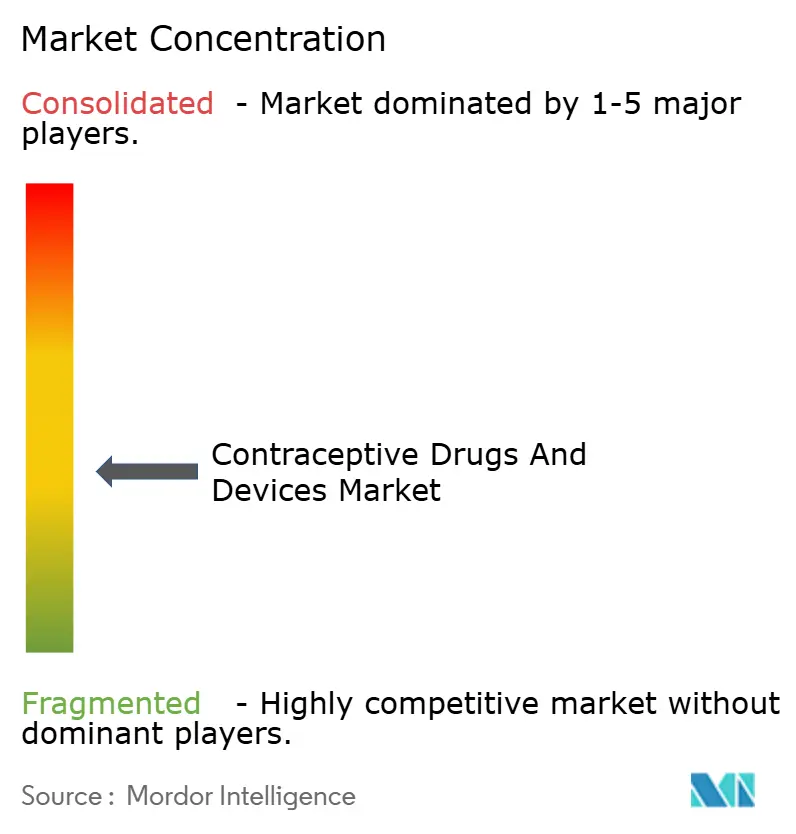
| Market Concentration | Medium |
Major Players *Disclaimer: Major Players sorted in no particular order Image © Mordor Intelligence. Reuse requires attribution under CC BY 4.0. | |
Contraceptive Drugs and Devices Market Analysis by Mordor Intelligence
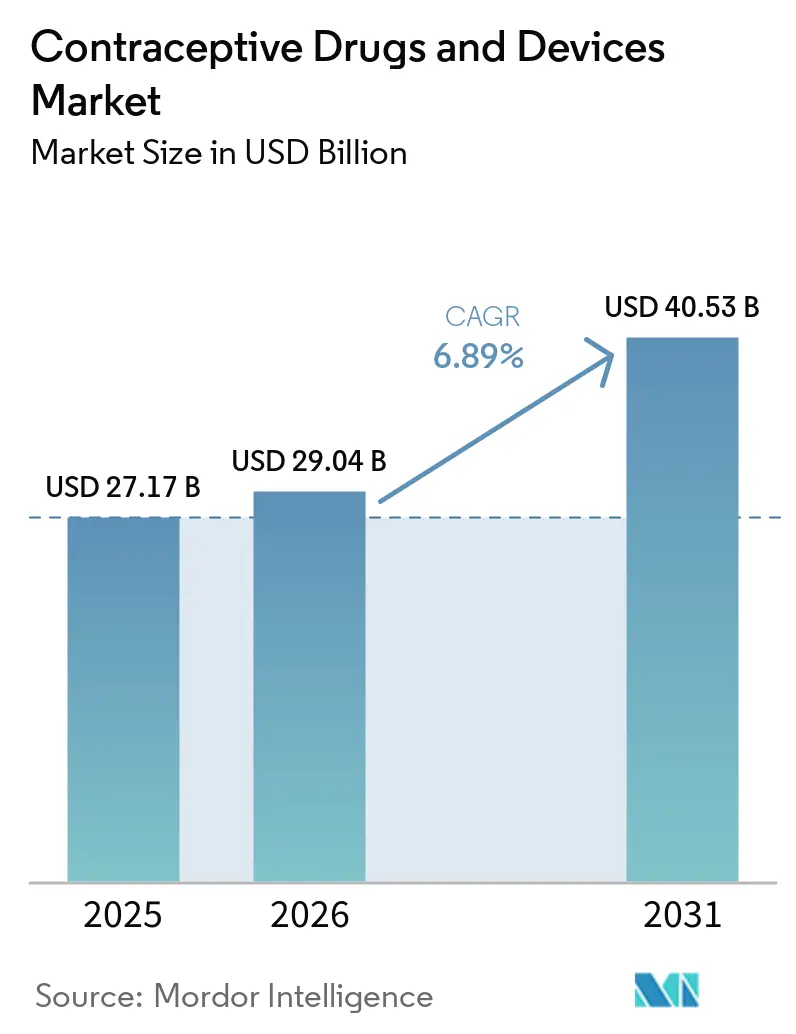
The contraceptive drugs and devices market size is expected to grow from USD 27.17 billion in 2025 to USD 29.04 billion in 2026 and is forecast to reach USD 40.53 billion by 2031 at 6.89% CAGR over 2026-2031. Growth is underpinned by sustained investment in long-acting reversible contraceptives (LARCs), rising demand for non-hormonal methods, and a steady shift toward digital purchasing channels that reduce access barriers. Asia-Pacific accounted for 33.33% of 2024 revenue, buoyed by government family-planning programs, while the Middle East & Africa is on track for the fastest expansion at 8.67% CAGR on the back of new reimbursement schemes that temper cultural resistance.[1] Devices captured 65.34% of 2024 sales and are tracking an 8.2% yearly gain as implants and hormonal intrauterine devices deliver >99% effectiveness with limited user input. Online distribution, expanding 9.78% per year, is reshaping procurement by pairing telehealth consultations with direct-to-consumer logistics.
Key Report Takeaways
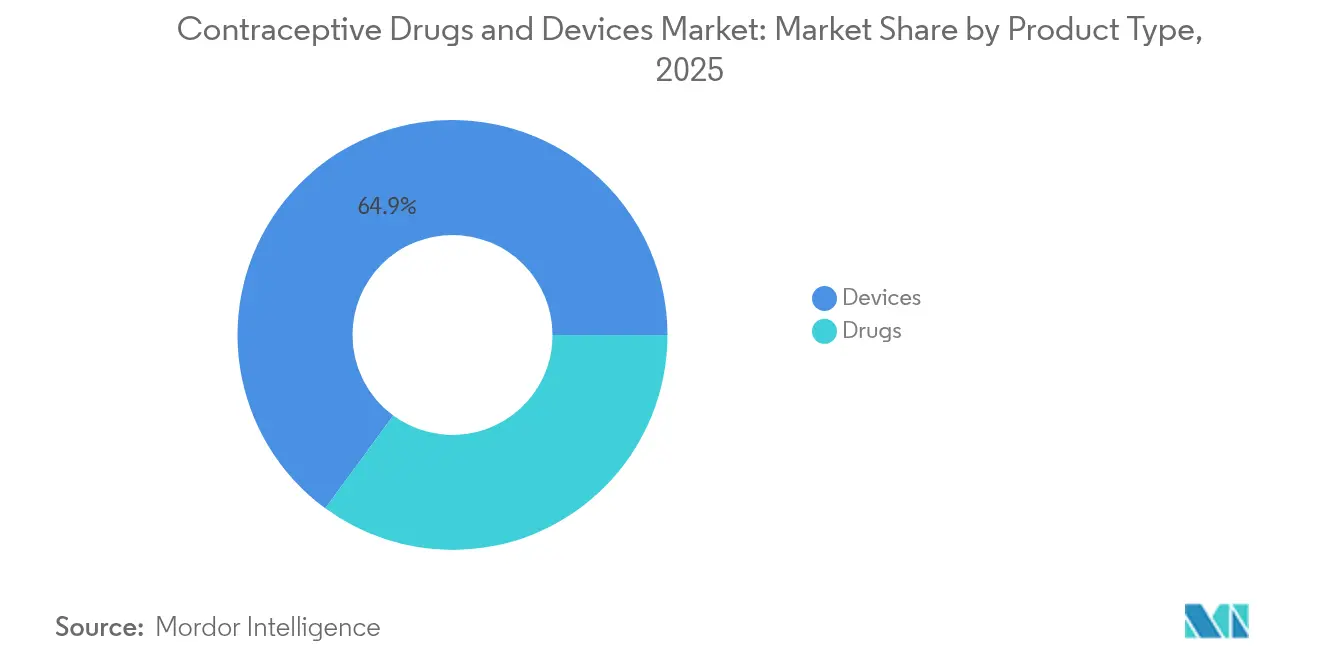
- By product type, devices led with 64.92% revenue share in 2025, while the drugs is advancing at an 7.03% CAGR through 2031.
- By hormonal class, hormonal methods held 60.75% of the contraceptive drugs and devices market share in 2025; non-hormonal options are projected to expand at an 8.61% CAGR to 2031.
- By gender, female-focused products dominated with 79.86% share in 2025, whereas male solutions posted the highest projected CAGR at 7.98% through 2031.
- By age group, 25-34 year-olds accounted for 35.92% of the market in 2025; the 15-24 cohort is on course for a 7.67% CAGR to 2031.
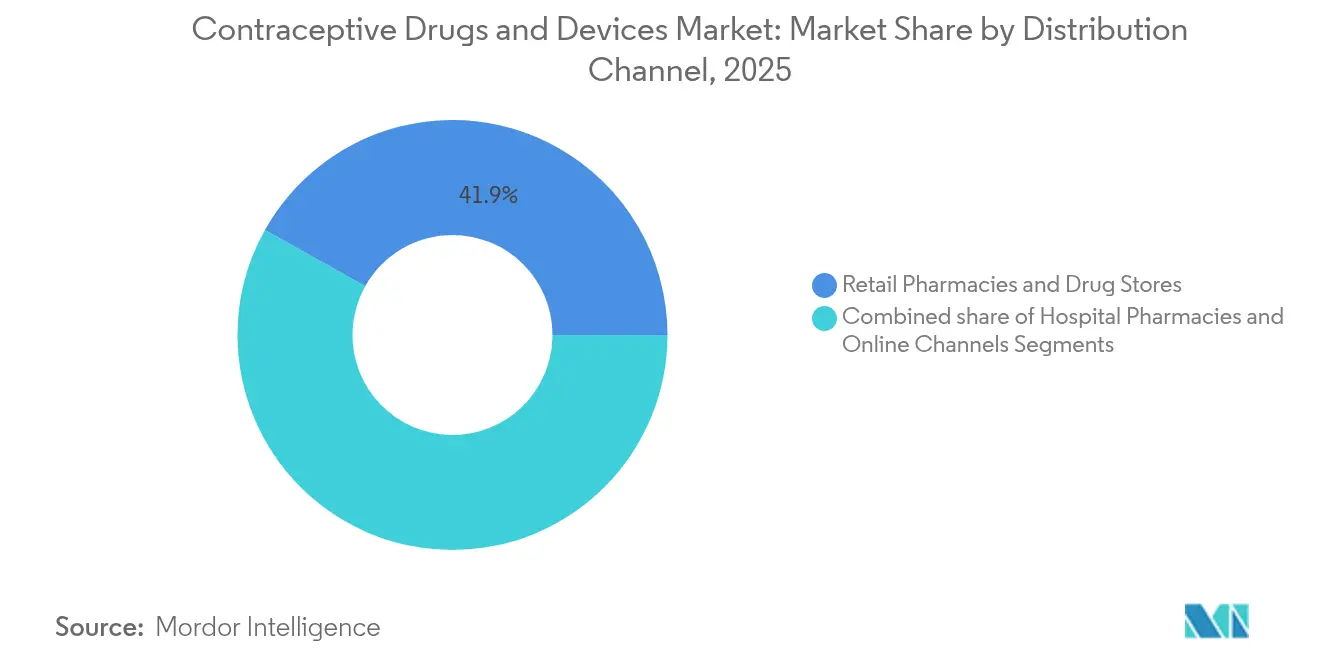
- By distribution channel, retail pharmacies controlled 41.88% of 2025 revenue, but online platforms are climbing at a 9.56% CAGR to 2031.
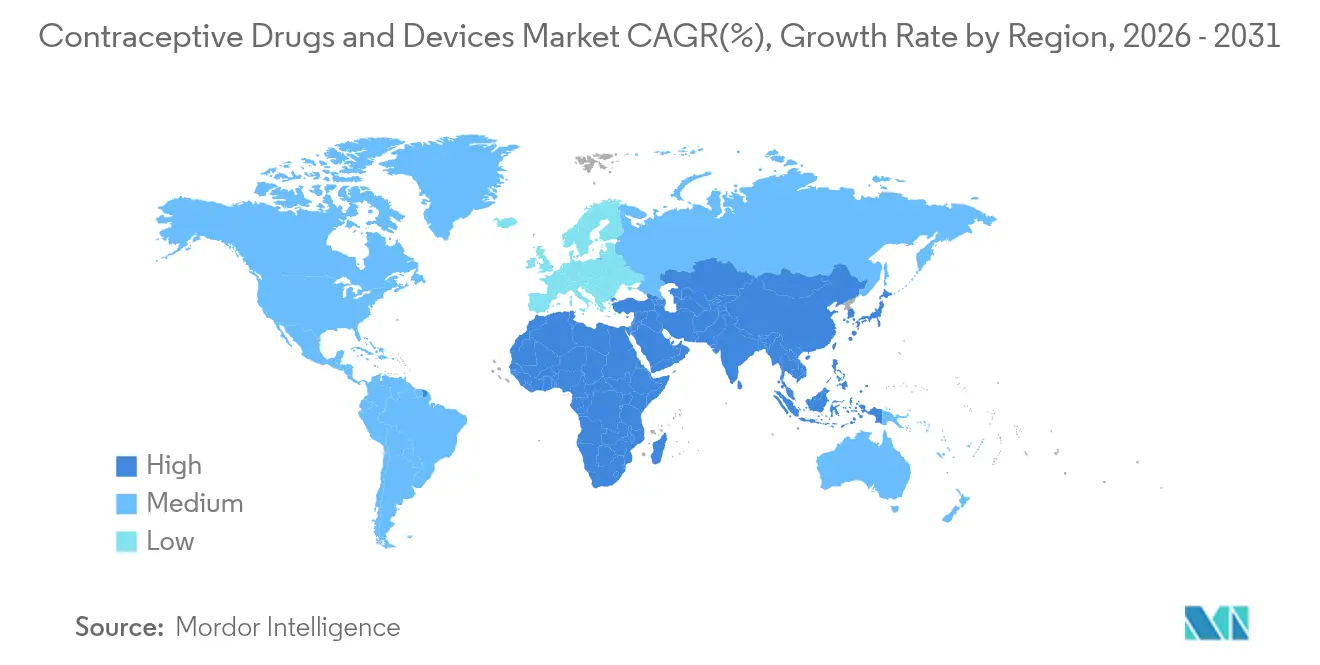
- By geography, Asia-Pacific held the largest 33.05% share in 2025, while the Middle East and Africa is projected to grow fastest at 8.54% CAGR between 2026-2031.
Note: Market size and forecast figures in this report are generated using Mordor Intelligence’s proprietary estimation framework, updated with the latest available data and insights as of 2026.
Market Trends and Insights
Drivers Impact Analysis of Contraceptive Drugs and Devices Market*
| Driver | (~) % Impact on CAGR Forecast | Geographic Relevance | Impact Timeline |
|---|---|---|---|
| Rising uptake of LARCs | +2.1% | North America, Europe, Global | Medium term (2-4 years) |
| Expansion of reimbursement & awareness | +1.7% | Asia-Pacific, Middle East & Africa, Global | Medium term (2-4 years) |
| Technological advancement & innovation pipeline | +1.5% | North America, Europe, Global | Long term (≥ 4 years) |
| Shift to e-commerce for OTC barrier products | +0.9% | Developed regions, Global | Short term (≤ 2 years) |
| Rising awareness of family planning | +0.6% | Developing regions, Global | Medium term (2-4 years) |
| Rising global population & unintended pregnancy | +0.8% | Asia-Pacific, Africa, Global | Long term (≥ 4 years) |
| Source: Mordor Intelligence | |||
Rising Uptake of Long Acting Reversible Contraceptives
LARCs offer over 99% effectiveness and significantly reduce user error, making them the first-line recommendation among clinicians. Policy shifts such as separate Medicaid reimbursement for immediate postpartum placement lifted utilization by 0.74 percentage points.[2] Innovation surrounding biodegradable implants in Phase 1 trials aims to eliminate the need for removal procedures. Cost savings accrue to payers as even modest migration from short-acting contraceptive pills to LARCs lowers unintended pregnancy rates, strengthening payer support. Together, these dynamics keep the contraceptive drugs and devices market on a structurally higher growth path.
Expansion of Reimbursement Initiatives Coupled with Access and Awareness Programs
A USD 390 million U.S. Title X budget for 2025—up 36%—broadens subsidized access for low-income users. Fourteen other governments maintained or grew allocations, totaling USD 35.3 million.[1] British Columbia’s province-wide free-contraception policy demonstrates the volume lift that occurs when cost barriers are removed, although legacy providers must recalibrate their revenue models. Digital partnerships—such as Bayer’s collaborations with Your Life and UNFPA India—blend education and fulfillment, deepening penetration in low- and middle-income countries. These initiatives collectively raise modern‐method prevalence and sustain the contraceptive drugs and devices market expansion.
Technological Advancement and Innovation Pipeline
The NIH committed USD 420 million to contraceptive R&D for 2024-2025, earmarking nearly one-third of the funds for male solutions. WHO estimates that broadening the method mix could raise global contraceptive prevalence by eight percentage points by 2030.[3] Next-generation formats range from microneedle patches and six-month injectables to dual-prevention pills that combine pregnancy and HIV protection. Casea S, a biodegradable implant, and Ovaprene, a hormone-free intravaginal ring in Phase 3 trials, illustrate how non-hormonal design addresses the side-effect gap. These pipelines diversify choice and reinforce long-term momentum in the contraceptive drugs and devices market.
Shift to E-commerce for OTC Barrier Products
Barrier products are increasingly purchased online, driving segment growth at a 10.20% CAGR. Telecontraception merges web-based consultations with doorstep delivery, expanding access, particularly in rural areas. Yet counterfeit risk is material; FDA seizures of fake contraceptives rose 43% in 2024. Platforms are responding with authentication technology and pharmacist chat features to safeguard users. Overall, digital channels complement brick-and-mortar outlets, widening the footprint of the contraceptive drugs and devices market.
Restraints Impact Analysis of Contraceptive Drugs and Devices Market*
| Restraint | (~) % Impact on CAGR Forecast | Geographic Relevance | Impact Timeline |
|---|---|---|---|
| Cultural-religious barrier in contraceptive adoption | –0.8% | Middle East & Africa, parts of Asia-Pacific & Latin America | Long term (≥ 4 years) |
| Side effects and perceived risk factors | –0.5% | Global | Medium term (2-4 years) |
| Regulatory issues & counterfeit proliferation | –0.3% | Developing regions, Global | Medium term (2-4 years) |
| High upfront device cost & limited rural access | –0.4% | Developing regions, rural areas | Medium term (2-4 years) |
| Source: Mordor Intelligence | |||
Cultural-Religious Barrier in Adoption of Contraceptives
Religious objections account for 37% of non-use in Saudi Arabia, 42% in Nigeria, and 28% in Pakistan. Countries with strong faith influence post contraceptive prevalence rates 18 points lower than peers of similar income. Policy examples, such as Indiana’s Medicaid restrictions on IUDs, illustrate the institutionalization of such barriers. Province-level disparities in Mozambique underline localized nuance contraceptionmedicine.biomedcentral.com. Manufacturers increasingly engage religious leaders and deploy community outreach to soften resistance and protect the contraceptive drugs and devices market trajectory.
Regulatory Issues and Proliferation of Counterfeit Products
Thirty-nine percent of seized counterfeit medicines in 2024 were contraceptives, underscoring quality risks in informal channels. Regulatory divergence creates complexity: while 29 U.S. jurisdictions now allow pharmacist prescribing, other regions still mandate physician visits, slowing adoption. Harmonizing standards and boosting post-market surveillance remain industry priorities.
*Our forecasts treat driver/restraint impacts as directional, not additive. The impact forecasts reflect baseline growth, mix effects, and variable interactions.
Contraceptive Drugs and Devices Market Segment Analysis
By Product Type:
Devices Dominate Through Efficacy AdvantageDevices held 64.92% of 2025 revenue, giving them the largest contraceptive drugs and devices market share, thanks to the more than 99% effectiveness of IUDs and implants. The category is growing at a rate of 6.15% annually, as biodegradable implants and extended-duration hormonal IUDs boost uptake. Hormonal IUDs also treat heavy bleeding, adding clinical appeal. Emerging non-hormonal devices like Ovaprene aim to address the side-effect-conscious segment.
Drug-based products represented the remaining 35.08% in 2025, but are expected to experience faster growth. The contraceptive drugs and devices market size for emergency pills is nevertheless expanding in markets where awareness of the 72-hour window rises. FDA clearance of Opill for OTC sale in March 2024 removes prescription friction and could revive pill volumes.

By Hormonal Class:
Non-Hormonal Methods Gain MomentumHormonal methods controlled 60.75% revenue, yet non-hormonal alternatives are expanding 8.61% yearly, far above the total contraceptive drugs and devices market CAGR. Copper IUD demand is also rising as users seek hormone-free choices. Ovaprene’s 86-91% efficacy in early studies suggests a strong commercial outlook.
Lower-dose hormonal innovations seek to mitigate systemic effects while maintaining efficacy. Meanwhile, the Gates Foundation’s USD 280 million annual pledge to non-hormonal R&D underscores investor conviction. This funding influx is expected to expand the contraceptive drugs and devices market size for hormone-free solutions.
By Gender:
Male Contraception Emerges as Growth FrontierFemale-focused products accounted for 79.86% of 2025 sales, underpinned by an extensive product mix that included pills, rings, implants, and IUDs. The CE-marked FemBloc system introduces the first non-surgical, permanent option, reinforcing the breadth of innovation.
Male methods, currently at 20.14%, are expanding at an annual rate of 7.98% as societal attitudes shift. Plan A, a reversible hydrogel in Australian trials, and the Galactic Cap are illustrative of the R&D pipeline. A 2025 JAMA survey found 78% of men aged 18-45 were willing to adopt novel contraception, signaling meaningful latent demand.
By Age Group:
Youth Segment Drives Future GrowthConsumers aged 25-34 accounted for 35.92% of 2025 spending, aligning with their higher fertility management needs. They are 31% more likely than 15-24 year-olds to adopt modern methods.
The 15-24 cohort, however, is the fastest-growing, with a 7.67% CAGR to 2031. Dissatisfaction with hormonal side effects, cited by 42% in a U.S. study, propels interest in user-friendly non-hormonal options. Telehealth channels resonate strongly with this digital-native segment, expanding awareness and access.
By Distribution Channel:
Online Platforms Revolutionize AccessRetail pharmacies maintained a 41.88% share in 2025, spotlighted by pharmacist-prescribed programs in 29 states and D.C. OTC Opill at USD 19.99 per month further strengthens this channel.
Online portals are scaling at 9.56% CAGR, integrating virtual consultations and discreet home delivery. Telehealth contraceptive prescriptions almost doubled between 2023 and 2025, with rural usage surging. Authenticity challenges persist; FDA seizures of counterfeit goods increased by 43% year-over-year, prompting platforms to tighten supply-chain verification.
Geography Analysis
North America Contraceptive Drugs and Devices Market
North America benefits from substantial reimbursement, with USD 390 million Title X funding in 2025 and OTC Opill availability that removes prescription hurdles. Nonetheless, initiatives such as Project 2025 threaten to curtail free emergency contraception for 48 million women, creating policy uncertainty.
APAC Contraceptive Drugs and Devices Market
The Asia-Pacific region holds the most prominent regional position, with a 33.05% share, yet intra-regional disparities persist, only 20.2% of Bangladeshi women wishing to avoid pregnancy use LARCs, highlighting a sizeable runway. Digital distribution and expanded reimbursement are expected to narrow this gap.
MEA Contraceptive Drugs and Devices Market
The Middle East & Africa’s 8.54% CAGR through 2031 stems from enhanced funding and outreach, such as Zambia’s plan to lift prevalence to 40% by 2026. Youth surveys in Uganda reveal 72.4% intend to use contraception once barriers ease.
Europe Contraceptive Drugs and Devices Market
Europe’s mature market posts steady growth amid varied method mixes; hormonal usage ranges from 28% in southern to 54% in northern states. EMA approvals of three formulations in 2024 sustain product refresh cycles.
South America Contraceptive Drugs and Devices Market
South America registers solid demand where no-cost LARCs drive adherence; Brazil reports 82.1% continuation for LNG IUDs at 24 months, validating public-sector procurement strategies.
Regulatory Landscape
Regulation spans drug, device, and combination-product pathways, with lifecycle safety management taking on greater weight for hormonal contraceptives and long-acting reversible contraceptives (LARCs). In the United States, the FDA has expanded access while tightening use controls for certain LARCs. This includes the January 2026 supplemental NDA approval extending Organon’s NEXPLANON implant use duration to up to five years, along with REMS-driven provider requirements for appropriate insertion and use.
In Europe, the EMA’s pharmacovigilance activity continues to shape labeling and risk communication for widely used progestogen-based products. This includes July 2026 PRAC recommendations to update product information for desogestrel- and etonogestrel-containing contraceptives to include meningioma as a potential side effect. For public-sector procurement and access programs, WHO/UNFPA quality frameworks and WHO prequalification remain key anchors for product quality assurance and for supporting tender participation for devices such as male and female condoms and copper-bearing IUDs.
Value Chain Analysis
The value chain starts with raw materials and specialized components, APIs for oral and injectable products, and medical-grade polymers and metals for condoms, implants, and IUDs. These are followed by formulation or device manufacturing under regulated quality systems. Market supply reflects a mix of multinational manufacturers and regionally focused players, while demand is channeled through commercial wholesalers and pharmacies, and through institutional procurement that relies on donor-funded and public-sector buyers, notably UNFPA and USAID-aligned programs, to supply national health systems and NGO networks.
Downstream performance depends on last-mile distribution capability, insertion-provider availability for LARCs, and traceability that reduces counterfeit and diversion risks, particularly as online channels scale. Partnership structures show how firms manage commercialization in controlled channels: Medicines360 and DKT WomanCare partnered to expand access to the Avibela hormonal IUD with coordinated supply and regulatory-quality responsibilities (January 2024). Afaxys and Exeltis also renewed their arrangement to sustain access to Twirla in the US public health market (June 2025). Supply planning remains sensitive to funding shifts, with reported disruptions creating mismatches between stocked inventory and on-the-ground availability in some low-income settings.
Competitive Landscape
Bayer AG leverages the Mirena franchise and pledges contraception access for 100 million women by 2030. Organon & Co. derives 27% of 2022 revenue from Nexplanon and NuvaRing, underscoring its stake in the contraceptive drugs and devices market.
Innovation-centric players gain visibility: Daré Bioscience advances Ovaprene and Casea S, partnering with Theramex to commercialize biodegradable implants. NEXT Life Sciences raised USD 20 million for Plan A, highlighting investor appetite for male solutions. Competitive intensity is rising as incumbents and start-ups jostle to fill unmet needs with differentiated delivery systems, dosage profiles, and gender-balanced portfolios.
Contraceptive Drugs and Devices Industry Leaders
-
Bayer AG
-
Teva Pharmaceutical Industries Ltd
-
Johnson and Johnson
-
Organon
-
CooperSurgical Inc.
- *Disclaimer: Major Players sorted in no particular order
Contraceptive Drugs and Devices Market Companies Covered in this Report
- Bayer
- Organon
- Pfizer
- Teva Pharmaceutical Industries
- The Cooper Companies
- Reckitt Benckiser Group
- Church & Dwight
- Abbvie
- Agile Therapeutics Inc.
- Viatris
- Gedeon Richter Plc
- Glenmark Pharmaceuticals
- Cipla
- Pregna International Ltd
- Mayer Laboratories
- HLL Lifecare
- Karex Berhad
- Okamoto Industries Inc.
- Femcap Inc.
- Amneal Pharmaceuticals
Market Opportunities and Future Outlook
White space is visible where users and payers broaden method mix beyond daily pills toward differentiated delivery formats that reduce adherence burden or address hormone-related concerns. A near-term opportunity is in hormone-free and patient-controlled options supported by active late-stage development and licensing. In May 2026, Daré Bioscience disclosed positive interim Phase 3 results for Ovaprene, a monthly, hormone-free intravaginal contraceptive. In June 2026, Organon completed a global license agreement for Sebela’s FDA-approved MIUDELLA hormone-free copper IUD, aligning with demand for non-hormonal LARCs and adding a new branded entrant to the copper IUD segment.
Commercial whitespace is also emerging where reimbursement and channel reforms reduce friction, especially when paired with regulatory actions that expand labeled duration or simplify access. In Canada, Duchesnay’s April 2026 launch of PrRingza, a reusable, patient-controlled vaginal system designed for up to one year of use, reflects ongoing product refresh and choice expansion in clinician-dispensed contraceptives. On the supply side, portfolio-focused capital allocation is creating room for scale and geographic expansion in LARCs, supported by Bayer’s July 2026 transaction with Apollo-managed funds for a non-controlling minority stake in a newly established entity housing Bayer’s LARC business (Mirena, Jaydess, Kyleena, Jadelle). This structure supports continued investment in a core, high-volume device franchise.
Recent Industry Developments in Contraceptive Drugs and Devices Market
- July 2026: Bayer secured 3.0 billion euros in equity capital from Apollo-managed funds in exchange for a non-controlling minority stake in a newly established entity housing Bayer’s LARC portfolio (including Mirena, Jaydess, Kyleena, and Jadelle). The structure improves financial flexibility while keeping operational control with Bayer, supporting sustained resourcing for a core revenue franchise that influences global LARC availability.
- June 2026: Organon completed a global license agreement with Sebela Pharmaceuticals for MIUDELLA, a hormone-free copper IUD approved by the US FDA in 2025, with commercialization positioned for late 2026. The deal adds a new non-hormonal device to Organon’s women’s health portfolio and reinforces the industry shift toward hormone-free options under controlled distribution models such as REMS-based training and use requirements.
- March 2025: Femasys secured a CE mark for FemBloc, positioned as a non-surgical, permanent birth-control device. The milestone advances a novel permanent contraception approach in Europe and broadens competitive set beyond traditional permanent methods by enabling an alternative device-led pathway.
Contraceptive Drugs and Devices Market Report Scope and Research Methodology
Market Definition and Coverage
This market covers revenues generated from contraceptive drugs and contraceptive devices used to prevent pregnancy, counted at the point of sale across major healthcare and retail channels. We size the market in value terms in USD across the major global regions.
Scope exclusions: We exclude fertility-tracking apps, non-contraceptive hormonal therapies, and surgical abortion equipment.
Segments Covered in This Report
- By Product Type
- Drugs
- Oral Pills
- Transdermal Patch
- Injectable Contraceptives
- Emergency Pills
- Devices
- Barrier Devices
- Male Condom
- Female Condom
- Diaphragm
- Cervical Cap
- Contraceptive Sponge
- Long-Acting Reversible
- Hormonal IUD
- Copper IUD
- Sub-dermal Implant
- Vaginal Ring
- Permanent
- Tubal Occlusion Device
- Barrier Devices
- Drugs
- By Hormonal Class
- Hormonal Methods
- Non-Hormonal Methods
- By Gender
- Male
- Female
- By Age Group
- 15-24 Years
- 25-34 Years
- 35-44 Years
- 45+ Years
- By Distribution Channel
- Hospital Pharmacies
- Retail Pharmacies & Drug Stores
- Online Channels
- Geography
- North America
- United States
- Canada
- Mexico
- Europe
- Germany
- United Kingdom
- France
- Italy
- Spain
- Rest of Europe
- Asia-Pacific
- China
- Japan
- India
- Australia
- South Korea
- Rest of Asia-Pacific
- Middle East and Africa
- GCC
- South Africa
- Rest of Middle East and Africa
- South America
- Brazil
- Argentina
- Rest of South America
- North America
Data Sources, Market Sizing, and Validation
Desk Research
Desk work starts with setting the demand context, which is then tied to supply signals so the size model does not drift. We typically review public health and population indicators from sources such as the World Health Organization, UN Population Division, the World Bank, and national health agencies, since these shape the underlying user base and method mix.
To translate that context into market value, product availability and flows are checked using sources such as UN Comtrade, national customs statistics, and public regulatory portals that describe approvals and labeling. This helps keep drugs and devices separated and reduces double counting when categories overlap. We also use company filings, investor presentations, association websites, and reputable press to understand portfolio mix and channel exposure, and we selectively reference paid subscriptions for company financials and intelligence, patent databases, and shipment-level trade data to cross-check revenues and technology cycles. The sources listed here are illustrative only, and many other references are also used for data collection, validation, and research clarification.
Primary Interviews and Surveys
Primary work is used to pressure-test desk assumptions, especially around pricing, channel margins, and how method switching shows up in sales. We gathered interview and survey inputs from manufacturers, distributors, clinicians, and procurement or pharmacy-side stakeholders across APAC, EMEA, and the Americas. These inputs helped tighten assumptions on adoption patterns, replacement cycles, and OTC versus prescription splits before we finalized totals.
Distribution of primary research fieldwork respondents
| Company type | Respondent position | Region |
|---|---|---|
| Top tier: 38% | CXOs: 16% | APAC: 41% |
| Mid tier: 46% | Functional/Unit leaders: 35% | EMEA: 35% |
| Smaller Players: 16% | Managers: 49% | Americas: 24% |
Market-Sizing & Forecasting
Sizing is built using a top-down approach where reproductive-age cohorts and contraceptive prevalence are converted into a method-level demand pool, and then valued using typical annualized cost per user by method. Once the initial totals are formed, they are corroborated with selective bottom-up approximations such as sampled ASP times volume for key methods, channel checks for retail and online share, and partial supplier roll-ups where public revenue splits are available.
A few practical inputs that matter in this market include the share of long-acting reversible contraception versus short-acting methods, prescription versus OTC availability, average replacement cycles for devices like IUDs and implants, and public-sector purchasing intensity that can move volumes quickly. Pricing is normalized to USD using consistent currency timing, and where local price points are sparse, gaps are handled using country peer sets and then re-tested through expert feedback until ranges feel realistic.
For forecasting, scenario analysis is used so adoption changes (including self-care trends and channel shifts) can be expressed as clear upside and downside cases, and then consolidated into a base case. The year-by-year path is also checked against the expected pace of regulatory changes and product refresh cycles, since those events can create step changes rather than smooth growth.
Data Validation & Update Cycle
Validation is done by triangulating the modeled totals against independent signals such as trade flows for relevant device categories, public procurement activity where visible, and implied per-user spending compared with known method costs. When large variances show up, assumptions are revisited, outliers are documented, and follow-up outreach is triggered so results are not driven by a single input.
Before sign-off, the model and write-up go through multi-step analyst review, including checks on year-to-year jumps, currency conversion consistency, and whether scope exclusions were applied the same way across regions. Reports are refreshed annually, with interim updates when material events occur, followed by a final pre-delivery scan so clients receive the latest updated view.
Mordor Intelligence's Contraceptives Drugs Devices Market Estimate Compared With Other Published Estimates
Published market sizes for contraceptive drugs and devices often do not match because the included products, sales channels, and the timing of currency conversion can differ from one study to another. Differences also come from how each model treats public-sector purchasing, method replacement cycles, and whether demand is reconstructed from prevalence and method mix or inferred mainly from company-side revenue splits.
The most common gap drivers in this market are scope choices (for example, whether fertility-awareness apps are counted), plus how pricing is set when tender pricing and retail pricing both exist and vary widely by country. Some estimates also headline a more aggressive growth case without re-checking near-term method switching and replacement assumptions with fresh expert input, which can lift the reported base year. Keeping app-based tools outside scope and anchoring totals to prevalence, method mix, and replacement cycles explains a big part of the spread for Mordor Intelligence.
Benchmark comparison
| Source | Market Size | Gaps in Research Methodology |
|---|---|---|
| Mordor Intelligence | USD 29.04 B (2026) | |
| Global Consultancy A | USD 31.18 B (2024) | Uses an earlier base year and can land higher if average selling prices are extended without rebalancing tender-to-retail pricing differences and method mix shifts. |
| Data Publisher B | USD 21.80 B (2024) | Applies a broader category map, and folding fertility-awareness apps and related self-care diagnostics into the total can change what is counted as the market. |
Overall, the spread is mainly explained by base-year selection, channel and price normalization choices, and whether adjacent digital categories are included. With clearly defined inclusions and repeatable checks against demand signals and trade or channel indicators, the market total becomes easier to reconcile as new data points emerge.
Key Questions Answered in the Report
What is the current size of the contraceptive drugs and devices market?
The market is valued at USD 29.04 billion in 2026 and is projected to reach USD 40.53 billion by 2031.
Which product category leads the market?
Devices dominate with 64.92% revenue share in 2025, driven by the effectiveness and convenience of IUDs and implants.
Why are non-hormonal methods growing faster than hormonal options?
Rising consumer concern over hormonal side effects and expanding R&D investment in hormone-free technologies are propelling a 8.61% CAGR for non-hormonal products.
How is e-commerce changing contraceptive access?
Online channels, growing at 9.56% per year, integrate telehealth consultations with doorstep delivery, expanding reach to rural and privacy-conscious users.
Which region is expanding fastest?
The Middle East & Africa is forecast to grow at 8.54% CAGR between 2026-2031, driven by new reimbursement programs and awareness campaigns.
What innovations are emerging in male contraception?
Pipeline products such as Plan A hydrogel and the Galactic Cap aim to offer reversible, hormone-free male options, with early clinical trials underway.