
Content Recommendation Engine Market Size and Share
Market Overview
| Study Period | 2020 - 2031 |
|---|---|
| Market Size (2026) | USD 8.13 Billion |
| Market Size (2031) | USD 32.79 Billion |
| Growth Rate (2026 - 2031) | 32.20 % |
| Fastest Growing Market | Asia Pacific |
| Largest Market | North America |
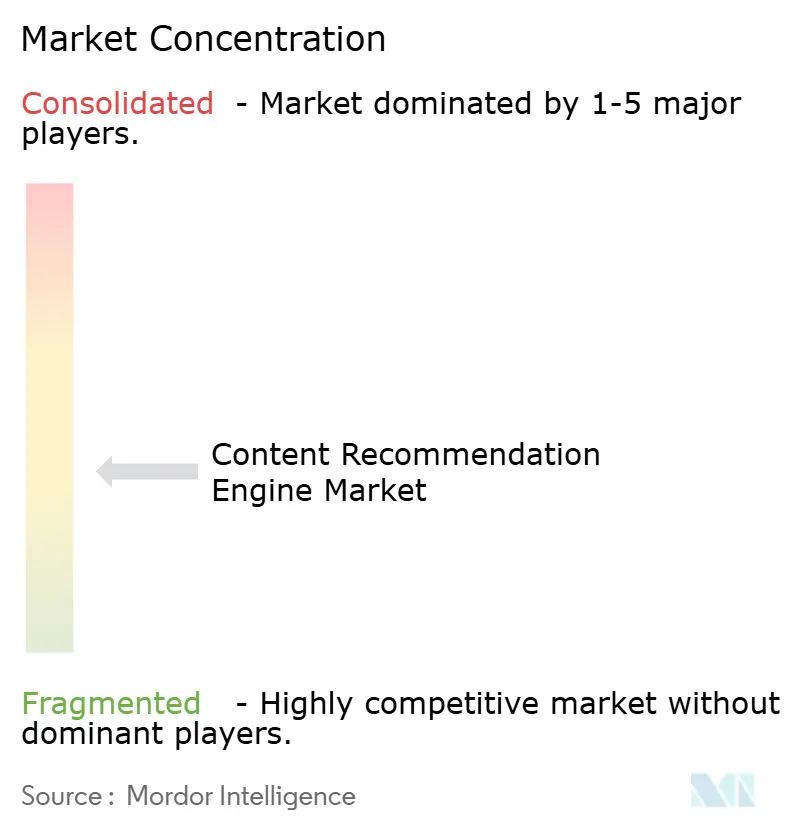
| Market Concentration | Medium |
Major Players *Disclaimer: Major Players sorted in no particular order Image © Mordor Intelligence. Reuse requires attribution under CC BY 4.0. | |
Content Recommendation Engine Market Analysis by Mordor Intelligence
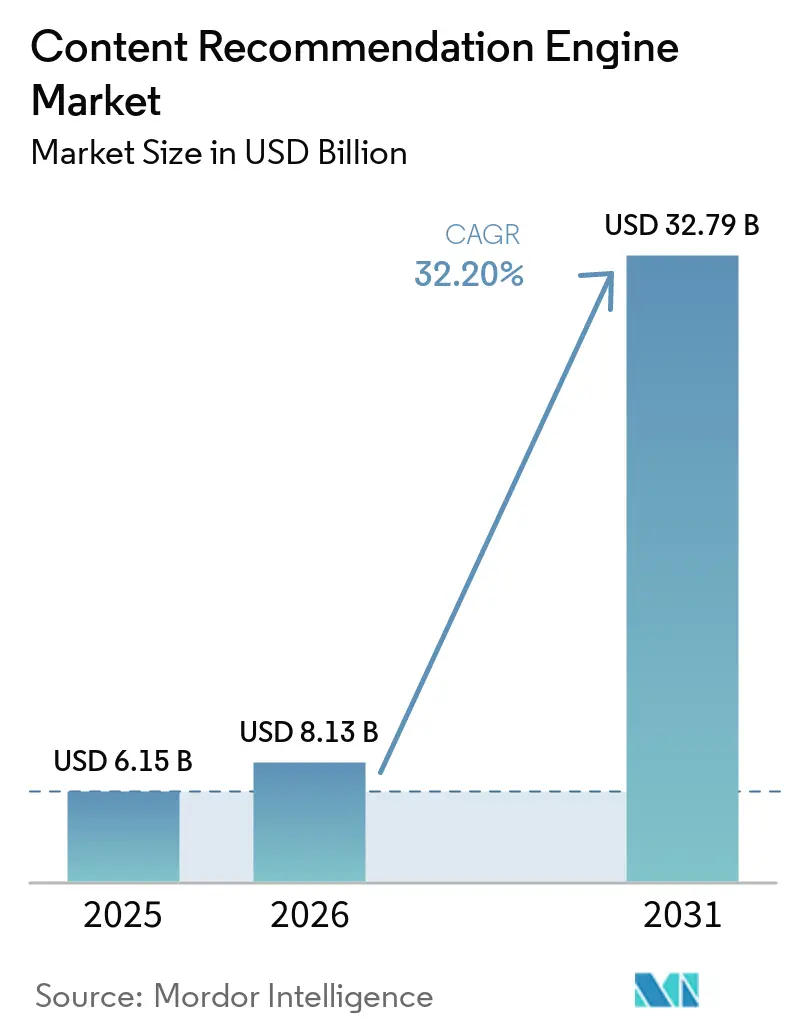
The Content Recommendation Engine Market size is expected to grow from USD 6.15 billion in 2025 to USD 8.13 billion in 2026 and is forecast to reach USD 32.79 billion by 2031 at 32.20% CAGR over 2026-2031. This rapid scale-up reflects the move from passive search toward always-on personalization that shapes what users watch, read, and buy. Surging streaming libraries, wider edge-AI deployment, and stricter privacy rules together create a new baseline for real-time relevance across devices. Major digital platforms now treat recommendation quality as a core revenue lever, and enterprises in retail, media, and finance are racing to match that standard. At the same time, rising compute efficiency, availability of pre-trained models, and lower entry costs allow small businesses to deploy the same caliber of personalization as global leaders.
Key Report Takeaways
- By component, solutions led with 70.10% of content recommendation engine market share in 2025; services are projected to expand at a 34.39% CAGR through 2031.
- By deployment mode, cloud infrastructure accounted for 80.65 % of the content recommendation engine market size in 2025, while edge-integrated deployments post a 33.98 % CAGR to 2031.
- By enterprise size, large enterprises held 63.50 % share of the content recommendation engine market in 2025; small and medium enterprises recorded the highest 34.59 % CAGR through 2031.
- By personalisation approach, content-based filtering captured 53.90 % of the content recommendation engine market in 2025; hybrid filtering advances at a 34.94 % CAGR through 2031.
- By end-user industry, e-commerce and retail commanded 35.20 % of the content recommendation engine market size in 2025; BFSI is the fastest-growing segment at a 34.01 % CAGR to 2031.
- By geography, North America led with 38.20 % revenue share in 2025, whereas Asia-Pacific delivered the strongest 35.41 % CAGR through 2031.
Note: Market size and forecast figures in this report are generated using Mordor Intelligence’s proprietary estimation framework, updated with the latest available data and insights as of 2026.
Market Trends and Insights
Drivers Impact Analysis of Content Recommendation Engine Market*
| Driver | (~) % Impact on CAGR Forecast | Geographic Relevance | Impact Timeline |
|---|---|---|---|
| Rising streaming-content volumes | +8.2% | Global, with concentration in North America and APAC | Medium term (2-4 years) |
| Growing demand for hyper-personalised UX | +7.5% | Global, led by North America and Europe | Short term (≤ 2 years) |
| Cookieless first-party data strategies | +6.8% | Global, regulatory-driven in EU and California | Short term (≤ 2 years) |
| Edge-AI inference for real-time recommendations | +5.9% | APAC core, spill-over to North America | Medium term (2-4 years) |
| Integration with headless CMS and commerce stacks | +4.1% | North America and EU, expanding to APAC | Long term (≥ 4 years) |
| Multilingual content expansion in emerging markets | +3.7% | APAC, Latin America, MEA | Long term (≥ 4 years) |
| Source: Mordor Intelligence | |||
Rising Streaming-Content Volumes Drive Infrastructure Scaling
Record levels of video, audio, and article uploads have created petabyte-scale interaction logs that traditional collaborative filtering alone cannot handle. Netflix’s shift to foundation models illustrates how growing libraries require architectures that fuse multimodal item metadata with real-time engagement signals. [1] Cloud and edge operators are responding with heavy capital spending; Amazon announced more than USD 100 billion in 2025 data-center investments to meet AI workload demand. Vendors able to process thumbnail images, audio waveforms, and transcripts in one model are gaining enterprise interest, particularly from streaming newcomers that cannot afford multi-system complexity.
Growing Demand for Hyper-Personalised UX Transforms User Expectations
Modern consumers expect the next item to feel curated just for them within milliseconds. Hospitality studies show that 61% of hotel guests are willing to pay extra for custom experiences, with AI recommendations delivering nearly USD 40 million in incremental revenue for early adopters. [2] Startups such as Shaped have raised fresh funds to offer self-service recommendation platforms that let smaller firms launch without large engineering teams. Across sectors, real-time micro-segmentation, dynamic pricing, and adaptive interfaces are converging, making hyper-personalisation a board-level priority.
Cookieless First-Party Data Strategies Reshape Tracking Methodologies
The phase-out of third-party cookies and the enforcement of GDPR and CPRA have compelled brands to build first-party data lakes and server-side event pipelines. Companies now deploy consent managers and privacy-enhancing computation while using attribution models that rely on anonymous IDs rather than cross-site tags. Recommendation algorithms that apply federated learning techniques have gained traction because they update models in the browser or on the device, thus avoiding sensitive data transfer. Firms mastering cookieless personalisation report higher opt-in rates and stronger trust scores with regulators.
Edge-AI Inference for Real-Time Recommendations Enables Low-Latency Processing
Delivering suggestions at the network edge cuts round-trip latency and bandwidth. Mobile inference benchmarks show up to 4.3× speed gains versus cloud-only routes. Telecommunications operators have begun collocating recommendation micro-services at 5G base stations so that videos, news cards, or product tiles are ranked locally. The same approach improves battery life on wearables and connected cars, where bandwidth is limited and privacy concerns are high. Vendors integrating on-device vector databases with central model training report higher click-through rates in pilot programs.
Restraints Impact Analysis of Content Recommendation Engine Market*
| Restraint | (~) % Impact on CAGR Forecast | Geographic Relevance | Impact Timeline |
|---|---|---|---|
| Data-privacy regulations (GDPR, CPRA etc.) | -4.8% | Global, strictest in EU and California | Short term (≤ 2 years) |
| Cold-start and sparse-data limitations | -3.2% | Global, acute in emerging markets | Medium term (2-4 years) |
| Algorithmic bias and echo-chamber concerns | -2.7% | Global, regulatory focus in EU and US | Long term (≥ 4 years) |
| Escalating compute-energy costs for deep models | -2.1% | Global, critical in energy-constrained regions | Medium term (2-4 years) |
| Source: Mordor Intelligence | |||
Data-Privacy Regulations Create Compliance Complexity
GDPR and CPRA require explicit consent, transparent logic, and deletion rights, exposing firms to multimillion-euro fines for failures. [3] Eight additional U.S. state laws take effect in 2025, each with separate notice and opt-out clauses. Providers must now bake privacy into model design, employ differential privacy, and retain audit records. Compliance tools add cost, and stricter permissions can limit data variety, reducing algorithm accuracy when poorly managed.
Cold-Start and Sparse-Data Limitations Constrain Personalisation Effectiveness
When a new user, region, or product launches, interaction history is minimal, making predictions harder. Hybrid methods that blend content features with collaborative indicators help, but require steady feature engineering and hardware overhead. Research into large language models for recommendation hints at solving part of the cold-start by tapping pretrained knowledge. Yet smaller enterprises may lack the resources to fine-tune such models, slowing time-to-value in new markets.
*Our forecasts treat driver/restraint impacts as directional, not additive. The impact forecasts reflect baseline growth, mix effects, and variable interactions.
Content Recommendation Engine Market Segment Analysis
By Component:
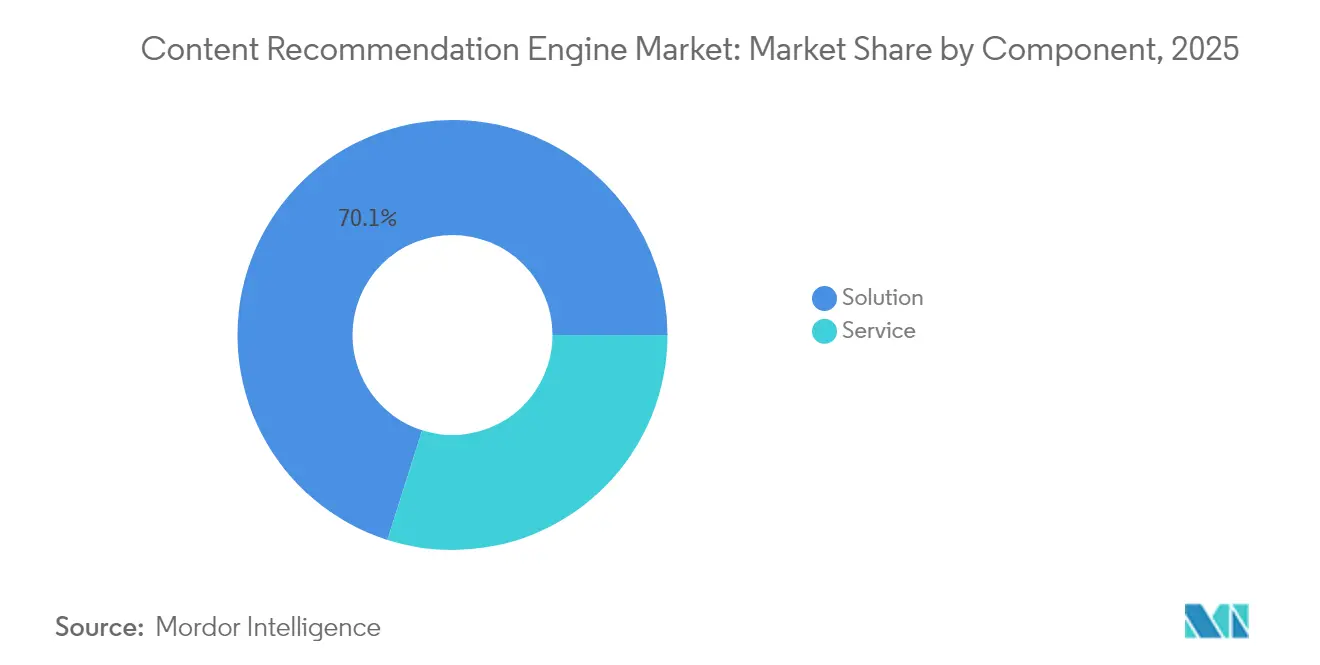
Services Expansion Outpaces Solution DominanceSolutions retained 70.10 % of revenue in 2025 as firms purchased turnkey engines to power search, video rows, and product carousels. The content recommendation engine market size attached to services, however, is projected to multiply at a 34.39 % CAGR to 2031 as organizations seek data-engineering help, model tuning, and integration safeguards. Demand for model tuning and integration services also supports the wider recommendation engine market. Vendors now bundle advisory, A/B testing, and ongoing performance reviews, converting one-time software deals into recurring engagements.
Service demand also stems from architectural shifts toward headless commerce and composable tech stacks that require custom connectors. Implementation partners connect recommendation APIs to CMS, inventory systems, and analytics tools, ensuring unified profiles and real-time feedback loops. A rise in self-serve platforms has not replaced professional services; instead, it expands the pie by reducing entry barriers and then upselling optimization packages once volume scales.

By Deployment Mode:
Cloud Dominance and Edge ConvergenceCloud-hosted engines delivered 80.65 % of the content recommendation engine market share in 2025, benefiting from elastic scaling and access to specialized GPUs. The content recommendation engine market size connected to edge-assisted architectures is now growing 33.98 % annually, signalling convergence rather than replacement. Enterprises train large models centrally but push compressed inference graphs to mobile apps, set-top boxes, and in-store kiosks for instantaneous advice.
Public-cloud providers embed recommendation APIs alongside storage, streaming, and security services to lock in customers. At the same time, hybrid deployments meeting data-sovereignty rules keep sensitive behavior logs within national borders while still syncing anonymous embeddings to the cloud for periodic retraining. The twin-track model is becoming standard in sectors such as media and automotive, where latency and privacy both carry revenue impact.
By Enterprise Size:
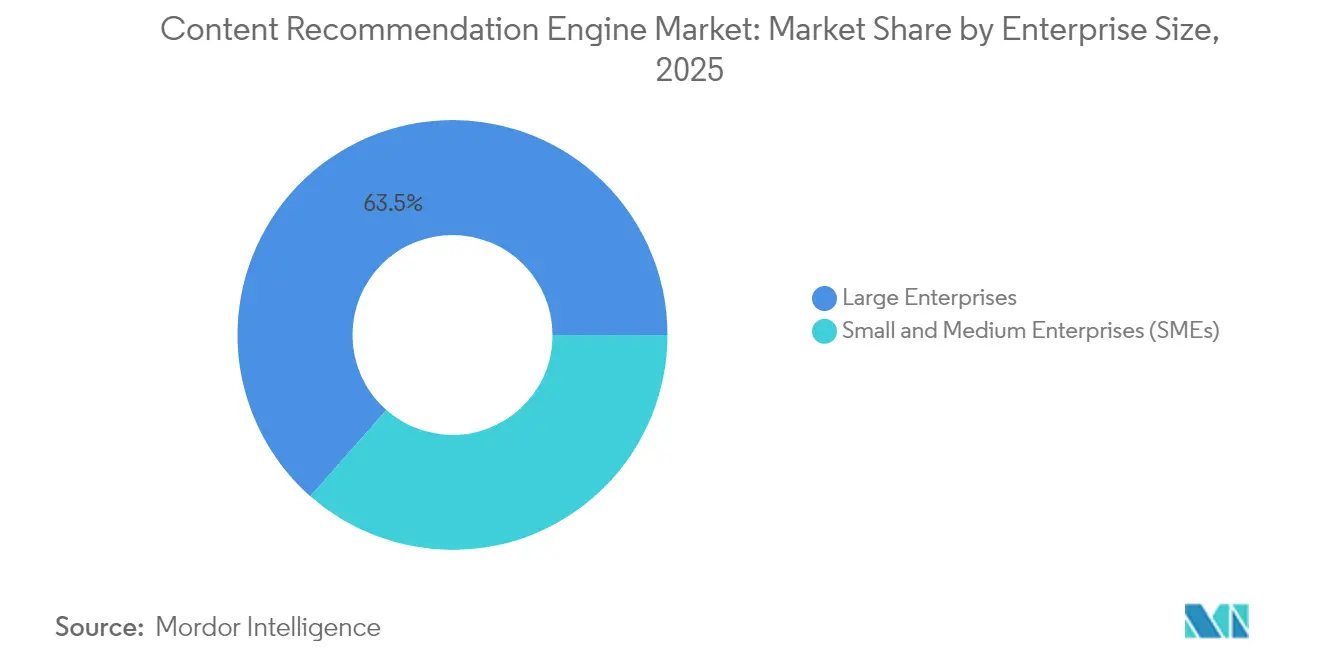
SME Adoption AcceleratesLarge enterprises held 63.50 % of revenue in 2025, yet the small-and-medium segment is expanding at a brisk 34.59 % CAGR. Lower total cost of ownership, pay-as-you-go licensing, and ready-made connectors for commerce platforms let SMEs replicate advanced personalisation once exclusive to global brands. Template workflows for product grids, news feeds, and in-app banners reduce data-science overhead.
Cloud marketplaces further ease access, allowing SMEs to procure a recommendation module alongside hosting and security in one subscription. Many smaller firms now run A/B tests with automated significance testing that surfaces winning models without manual SQL queries. As data maturity improves, SMEs upgrade to multi-model routing and experiment orchestration, reinforcing vendor stickiness and expanding lifetime value for providers.
By Personalisation Approach:
Hybrid Filtering Gains MomentumContent-based techniques, which rely on product attributes and metadata, generated 53.90 % of segment revenue in 2025. Hybrid filtering—combining collaborative behavior with rich content vectors—now records a 34.94 % CAGR, eroding single-method dominance. Hybrid setups mitigate cold-start risk while preserving discovery serendipity, and they align well with privacy demands because initial predictions can be made on client-side content data alone.
Advances in multimodal embeddings allow text, image, and audio cues to sit within shared latent spaces, improving cross-domain suggestions such as recommending a podcast based on a film taste. Large-language-model encoders add semantic nuance beyond keyword overlap, pushing click-through gains even with smaller interaction logs. Vendors are shipping configuration wizards that let non-technical users define the blend ratio among algorithms, reducing reliance on hard-coded rules.
By End-User Industry:
BFSI Growth Challenges E-Commerce LeadershipE-commerce and retail continued to lead with 35.20 % revenue share in 2025, underlining the direct link between personalised merchandising and basket size. Banking, financial services, and insurance are projected to rise at a 34.01 % CAGR to 2031, as lenders and insurers deploy next-best-product engines for cards, loans, and policies. Recommendation modules now power robo-advisors, helping investors choose funds based on risk appetite and saving goals.
Media, entertainment, and gaming remain strong adopters, enriching watch lists and in-game item stores. Hospitality, propelled by success stories such as personalised room upgrades and activity suggestions, is scaling deployment across global hotel chains. Cross-industry knowledge transfer is accelerating: Retail media networks borrow financial services risk-scoring techniques to improve relevance, while BFSI firms adopt e-commerce A/B frameworks to shorten iteration cycles.
Geography Analysis
North America Content Recommendation Engine Market
North America held 38.20 % revenue share in 2025, anchored by mature streaming platforms, high-speed broadband, and robust venture funding. Cloud hyperscalers headquartered in the region bundle recommendation APIs into larger software suites, reinforcing stickiness across industries. Regulatory clarity and strong developer ecosystems accelerate experimentation, but growth is tapering as saturation rises and competitive pricing pressures margins.
APAC Content Recommendation Engine Market
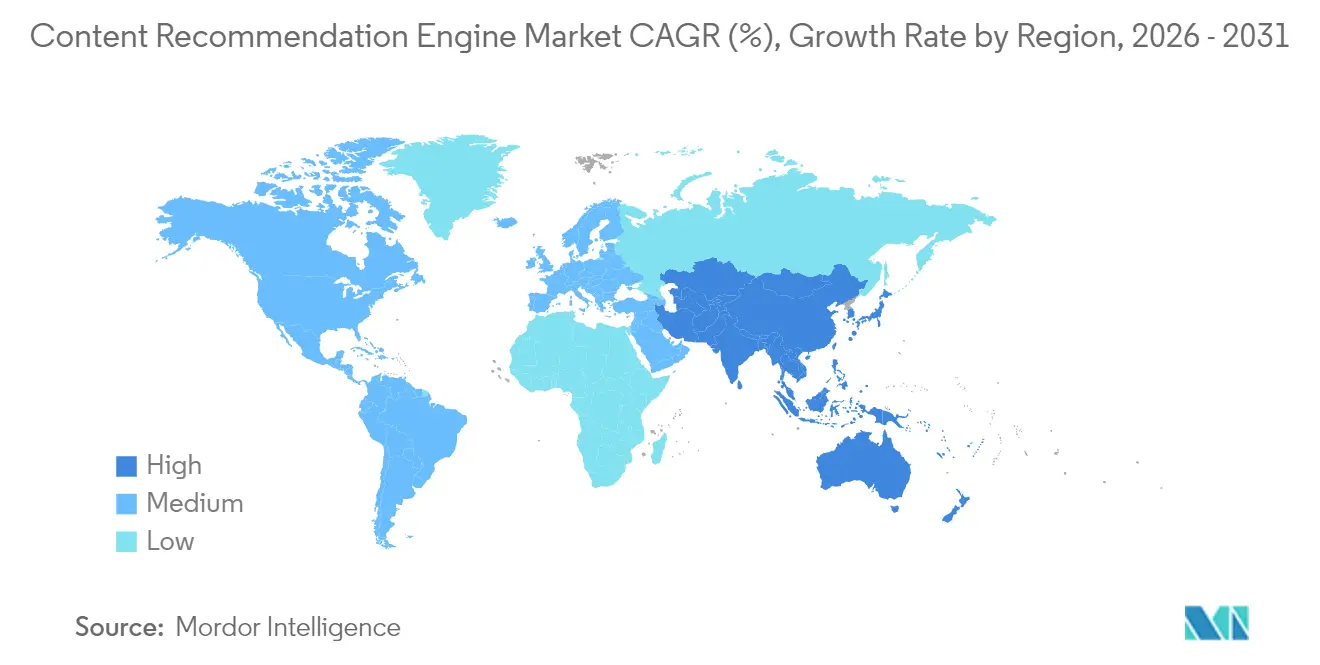
Asia-Pacific delivers the fastest 35.41 % CAGR to 2031, supported by mobile-first consumption, expanding 5G coverage, and demand for multilingual recommendations across vast cultural landscapes. Regional governments invest heavily in AI infrastructure and data-center capacity, catalyzing local startups that tailor algorithms to language nuances and urban-rural content gaps. Companies such as DeepSeek reached nine-digit user bases within days of launch, underscoring the appetite for personalised discovery tools. Edge computing investments by telecom carriers help overcome cross-border data-transfer rules, keeping inference near users while updating models centrally.
EMEA and South America Content Recommendation Engine Market
Europe exhibits steady adoption, tempered by strict privacy oversight that slows rollout but spurs innovation in privacy-preserving computation. Vendors test federated learning pilots to satisfy GDPR yet deliver accuracy on par with global peers. South America and the Middle East and Africa remain emerging opportunity zones. Cloud data-center openings, combined with lightweight SDKs optimised for lower bandwidth, are narrowing the gap, positioning these regions as the next wave of accelerators for the content recommendation engine market.
Regulatory Landscape
Regulation of content recommendation engines is tightening around transparency, user choice, and risk management for algorithmic systems that shape what users see. In the European Union, the Digital Services Act (DSA) requires online platforms that use recommender systems to disclose the main parameters behind recommendations and provide user-facing controls, including at least one non-profiling alternative under the DSA recommender-system provisions (notably Article 27 for parameter disclosure and additional obligations for the largest platforms). Separately, the EU AI Act entered into force on August 1, 2024, and moves toward full applicability by August 2, 2026, with transparency duties such as those under Article 50 becoming a design constraint for providers and deployers of AI systems that surface personalized content.
In the United Kingdom, the Online Safety Act 2023 adds compliance pressure by requiring services to assess and manage risks linked to how algorithms recommend content, including documentation and governance around system design and operation. Ofcom has started operationalizing the regime through its roadmap to regulation, and in April 2026 certain services were formally notified to provide records linked to illegal content and childrens risk assessments. In the United States, federal legislative activity around algorithm accountability and user choice continues, including bills such as H.R. 6253 (Algorithmic Transparency and Choice Act) and H.R. 6266 (Algorithm Accountability Act), reinforcing a shift toward explainability, opt-out paths, and reasonable-care requirements for recommendation-driven experiences.
Value Chain Analysis
The value chain starts with data creation and collection, primarily first-party behavioral signals (clicks, watch time, dwell time, purchases), item metadata (text, images, audio, transcripts), and consent and preference inputs gathered through CMPs and account settings. Data engineering then normalizes events, resolves identities, and produces embeddings and features in data lakes and streaming pipelines, typically supported by cloud infrastructure with GPUs/TPUs, feature stores, and vector search.
Model development and operations follow across retrieval, ranking, and reranking layers, with A/B testing and experimentation platforms running continuously to evaluate business KPIs as well as safety or policy constraints. Downstream, engines are packaged as APIs or SDKs and integrated into end applications (OTT homepages, social feeds, publisher modules, retail product carousels, and BFSI next-best-action surfaces), with delivery increasingly split between cloud training and edge or on-device inference for latency and privacy. Large platforms are consolidating fragmented pipelines into unified architectures to reduce latency and compute overhead, and 2026 engineering moves by Meta and Netflix emphasize retrieval efficiency and end-to-end serving simplification. Services and system integrators remain central for connector development (headless CMS, commerce stacks), governance, and compliance evidence (audit trails, parameter disclosure, and non-profiling alternatives), aligning production readiness with both model accuracy and regulatory traceability.
Competitive Landscape
The content recommendation engine market features a blend of hyperscale cloud providers, independent software vendors, and niche AI specialists. Market leaders leverage integrated stacks that cover data ingestion, model training, A/B testing, and delivery. Amazon Web Services, for instance, reported USD 29.3 billion in Q1 2025 cloud revenue, with recommendation APIs cited among high-growth workloads. Google and Microsoft offer similar toolchains that shorten deployment cycles and lock clients into proprietary ecosystems.
Specialised vendors differentiate through domain focus, lighter footprint, or privacy-centric architectures. Dynamic Yield tailors algorithms to retail merchandising, while Taboola and Outbrain focus on publisher monetisation. Startups such as Argoid AI, now acquired by Amagi, integrate recommendation engines with broadcast workflows to support FAST channel curation. The result is growing consolidation as large players buy niche innovators to expand vertical reach.
Competitive advantage increasingly hinges on three capabilities: real-time inference under 50 milliseconds, multimodal embedding fusion, and regulatory compliance that provides audit trail transparency. Companies that master energy-efficient model deployment also gain cost leverage as AI data-center electricity demand is projected to hit 9 % of the U.S. grid by 2030. [4] White-space remains in healthcare and education, where specialised vocabularies and ethical constraints require tailored solutions.
Content Recommendation Engine Industry Leaders
-
Amazon Web Services (Amazon.com Inc.)
-
Google LLC (Recommendations AI)
-
Adobe Inc. (Adobe Target)
-
Dynamic Yield Ltd.
-
Taboola Inc.
- *Disclaimer: Major Players sorted in no particular order
Content Recommendation Engine Market Companies Covered in this Report
- Amazon Web Services (Amazon.com Inc.)
- Google LLC (Recommendations AI)
- Adobe Inc. (Adobe Target)
- Dynamic Yield Ltd.
- Taboola Inc.
- Outbrain Inc.
- Algolia SAS
- Coveo Solutions Inc.
- IBM Corporation (Watson Recommender)
- SAP SE (Emarsys Recommend)
- Salesforce Inc. (Einstein Recommendations)
- Oracle Corporation (CX Commerce Personalisation)
- Episerver Inc. (Optimizely)
- Bloomreach Inc.
- Nosto Solutions Ltd.
- Monetate Inc.
- ThinkAnalytics Ltd.
- Recombee s.r.o.
- Klevu Oy
- Qubit Digital Ltd.
- Intellimize Inc.
- Muvi LLC
- Curata Inc.
- Piano Inc.
- Cxense ASA
- Uberflip Inc.
Market Opportunities and Future Outlook
A near-term opportunity is tied to regulation-driven product changes and modern recommender architecture, particularly the need to embed transparency and user-choice controls into the recommendation pipeline and UI. The EU DSA recommender requirements, including parameter disclosure and a non-profiling option for the largest platforms, create demand for engines that can support dual paths (profiling and non-profiling) and generate user-facing explanations without undermining latency targets. Vendors that productize these capabilities as configurable policies, templates, and audit logs can differentiate, especially for mid-tier publishers, streaming newcomers, and retailers that do not have resources for bespoke compliance engineering.
Cost and latency optimization also remains a practical purchase driver as vendors consolidate retrieval and ranking components. In May 2026, Meta introduced SilverTorch, reporting materially higher throughput and compute efficiency for large-scale recommendation workloads, and in June 2026 Netflix published GenPage, describing an end-to-end generative homepage construction approach that reduced serving latency versus earlier multi-stage systems. These proof points support enterprise interest in managed components such as high-performance vector search, multimodal embedding pipelines, and end-to-end orchestration that connects retrieval, ranking, and business-rule reranking. In parallel, agentic and conversational discovery patterns are moving into commerce and media, leaving room for recommendation providers to bundle search, browsing, and recommendations into a single generative experience deployed as cloud-first modules and selectively pushed to the edge for real-time interactions.
Recent Industry Developments in Content Recommendation Engine Market
- May 2026: Amazon Web Services announced the Agentic Shopping Assistant on AWS, built on Amazon Bedrock, AgentCore, and OpenSearch to help retailers deploy conversational shopping and recommendation experiences. The launch broadens recommendation engines from ranking widgets into agentic, multi-step discovery flows that combine LLM reasoning with retrieval. It also increases competitive pressure on independent vendors to offer packaged agentic recommendation stacks that integrate with retail catalogs and event pipelines.
- January 2025: Google Cloud unveiled Vertex AI Search for commerce as part of new retail solutions, positioning a unified approach to generative AI-assisted search, browsing, and recommendations for retailers. The offering reduces integration friction by bundling discovery capabilities that typically required separate search, personalization, and content-ranking systems. It reinforces hyperscaler platform bundling as a procurement path for enterprises modernizing digital storefront discovery.
- May 2024: Amazon Web Services launched general availability of the User-Personalization-v2 and Personalized-Ranking-v2 recipes for Amazon Personalize, including support for item catalogs up to 5 million items and lower-latency operation. The update expands suitability for large retailers and marketplaces where recommendation quality depends on scale and response time. It also sets a higher baseline for managed recommendation services competing on catalog limits, latency, and operational simplicity.
Content Recommendation Engine Market Report Scope and Research Methodology
Market Definition and Coverage
This market covers software and related services that automatically suggest digital content to users, based on signals such as behavior, preferences, and context, and then delivers ranked recommendations inside apps, websites, and digital media platforms.
Scope exclusions: We exclude general analytics tools and ad-tech targeting tools when they do not provide content recommendation outputs to end users.
Segments Covered in This Report
- By Component
- Solution
- Service
- By Deployment Mode
- Cloud
- On-premises
- By Enterprise Size
- Large Enterprises
- Small and Medium Enterprises (SMEs)
- By Personalisation Approach
- Content-based Filtering
- Collaborative Filtering
- Hybrid Filtering
- By End-user Industry
- Media, Entertainment, and Gaming
- E-commerce and Retail
- BFSI
- Hospitality
- IT and Telecommunication
- Other End-user Industries
- By Geography
- North America
- United States
- Canada
- Mexico
- South America
- Brazil
- Argentina
- Chile
- Rest of South America
- Europe
- Germany
- United Kingdom
- France
- Italy
- Spain
- Russia
- Rest of Europe
- Asia-Pacific
- China
- India
- Japan
- South Korea
- Singapore
- Malaysia
- Australia
- Rest of Asia-Pacific
- Middle East and Africa
- Middle East
- United Arab Emirates
- Saudi Arabia
- Turkey
- Rest of Middle East
- Africa
- South Africa
- Nigeria
- Egypt
- Rest of Africa
- Middle East
- North America
Data Sources, Market Sizing, and Validation
Desk Research
Desk research was used to set clear boundaries for what counts as a content recommendation engine and to anchor assumptions that can be tracked year to year. We relied on public reference points such as OECD and World Bank digital economy indicators, US Census Bureau retail e-commerce series, and telecom and broadband statistics from sources such as ITU to understand usage intensity and traffic growth that feeds recommendation demand.
We also reviewed standards and policy sources that influence how recommendation systems are deployed and measured, including NIST AI risk guidance, EU digital platform rules, and peer reviewed research through venues such as ACM and IEEE for common algorithm approaches and evaluation metrics. Company filings, investor presentations, engineering blogs, and reputable press were then used to map typical packaging (software plus services) and cross-check directional shifts such as cloud adoption and privacy driven data constraints. We also used paid subscriptions for company financials and intelligence, news and financials, and patent databases to speed up validation and reduce blind spots. These examples are not exhaustive, and many other public sources were referenced for data collection, validation, and research clarification.
Primary Interviews and Surveys
Primary work focused on converting broad demand signals into practical sizing inputs, especially where public reporting is thin. We spoke with product and growth leaders, data science and engineering owners, and commercial teams across solution providers, system integrators, and large adopters in media and entertainment, retail and e-commerce, BFSI, telecom, and adjacent digital services, followed by short surveys to confirm price ranges and adoption hurdles. Since the market is global, we validated inputs across major geographies so differences in cloud maturity, data availability, and regulation were reflected before totals were finalized.
Distribution of primary research fieldwork respondents
| Company type | Respondent position | Region |
|---|---|---|
| Top tier: 33% | CXOs: 12% | APAC: 41% |
| Mid tier: 47% | Functional/Unit leaders: 29% | EMEA: 32% |
| Smaller Players: 20% | Managers: 59% | Americas: 27% |
Market-Sizing & Forecasting
The core model starts with a top-down demand pool built around spending tied to digital touchpoints where recommendations are actively served, and then converts that demand into revenue using adoption and monetization assumptions by region and end-use. In practice, we map the addressable base of large digital content surfaces and commerce journeys, then apply penetration rates for recommendation engines, average contract values, and service attach rates to reconstruct a realistic market total.
To keep the output grounded, the top-line view is corroborated with selective bottom-up approximations, including sampled buyer budgets, channel checks on typical platform pricing, and vendor mix splits between software and services. These are used to adjust totals when the implied spend per customer looks stretched. Repeated model inputs include cloud versus on-premises deployment mix, enterprise versus SME share, recommendation volume intensity (sessions, page views, or catalog size proxies), and changes in privacy rules that affect data availability and therefore service effort. Where bottom-up inputs are incomplete, gaps are handled through proxying with comparable end-use cohorts and then validated in follow-up calls so the logic remains traceable.
For forecasting, we use scenario analysis supported by multivariate regression on drivers that practitioners consistently link to budget release, such as streaming subscriber growth, e-commerce GMV trends, ad supported inventory shifts, cloud migration pace, and AI infrastructure readiness. Assumptions are revisited when expert feedback points to a structural change, for example a faster move to managed cloud services or a slowdown driven by compliance friction.
Data Validation & Update Cycle
Validation is done through triangulation across independent signals, followed by structured review checks before final sign-off. Model outputs are compared against adjacent metrics such as enterprise software spend direction, cloud service growth, and public disclosures on personalization impact, with variance checks at region and end-use levels to ensure one outlier assumption does not skew the full market.
When anomalies appear, the inputs are re-tested, and the team re-contacts a small set of interviewees to confirm whether the issue comes from scope, pricing, or timing. Reports are refreshed annually, and interim updates are made when material events occur, including major regulation shifts or step changes in platform adoption. Before delivery, a final pass is completed so clients receive the latest updated view based on the newest available signals.
Mordor Intelligence's Content Recommendation Engine Market Estimate Compared With Other Published Estimates
Published market sizes for content recommendation engines often differ because firms use different scope rules and then apply different pricing and adoption assumptions. Differences also show up when one estimate counts only software revenue, and another folds in services, broader AI tooling, or adjacent ad personalization functions.
Clear checks help reduce this spread, but they still need to map to how recommendation engines are actually bought and deployed. The biggest gap drivers we see are whether the model counts services such as integration and managed operations, how cloud subscriptions are annualized, which end-use industries are included, and how currency conversion timing is handled for global totals.
Benchmark comparison
| Source | Market Size | Gaps in Research Methodology |
|---|---|---|
| Mordor Intelligence | USD 8.13 B (2026) | |
| Global Consultancy A | USD 11.11 B (2025) | This estimate appears to use a broader definition that can pull in adjacent AI content tools and wider personalization spend, and it is also anchored to an earlier base year which can inflate the near-term total when growth is steep. |
| Trade Journal B | USD 8.05 B (2024) | The published figure likely relies on vendor-side rollups and may undercount implementation and ongoing service revenue, and the earlier year choice can make comparisons look smaller if not normalized for pricing and cloud subscription recognition. |
Evidence from deployment mix checks and buyer budget ranges, followed by re-confirmation of typical software plus services packaging, is what keeps Mordor Intelligence aligned to a repeatable revenue boundary for recommendation engines rather than drifting into wider AI spend. The spread across published numbers is mainly explained by scope edges and year selection, so normalizing inclusions and timing typically narrows the gap quickly.
Key Questions Answered in the Report
What is the current size of the content recommendation engine market?
The content recommendation engine market is worth USD 8.13 billion in 2026 and is set to reach USD 32.79 billion by 2031.
Which region grows fastest over the next five years?
Asia-Pacific records the highest growth, with a 35.41 % CAGR expected through 2031, driven by mobile-first users and rising AI investments.
Which segment expands the quickest within deployment modes?
Edge-integrated architectures, while still a minority, are growing at 33.98 % annually as enterprises push inference closer to users for latency gains.
Why are services gaining share against standalone solutions?
Enterprises need integration, data engineering, and ongoing optimisation, causing services to expand at a 34.39 % CAGR even though solutions still hold the largest revenue base.
How do privacy regulations affect recommendation deployment?
Rules like GDPR and CPRA mandate explicit consent and transparency, pushing firms toward federated learning and on-device processing to maintain personalisation without breaching compliance.
Which end-user industry shows the highest growth rate?
Banking, financial services, and insurance is the fastest-growing vertical, expected to rise at a 34.01 % CAGR as firms deploy next-best-product engines and personalised offers.