
Container Handling Equipment Market Size and Share
Market Overview
| Study Period | 2019 - 2031 |
|---|---|
| Market Size (2026) | USD 8.29 Billion |
| Market Size (2031) | USD 10.26 Billion |
| Growth Rate (2026 - 2031) | 4.35 % |
| Fastest Growing Market | Asia Pacific |
| Largest Market | Asia Pacific |
| Market Concentration | Medium |
Major Players *Disclaimer: Major Players sorted in no particular order Image © Mordor Intelligence. Reuse requires attribution under CC BY 4.0. | |
Container Handling Equipment Market Analysis by Mordor Intelligence
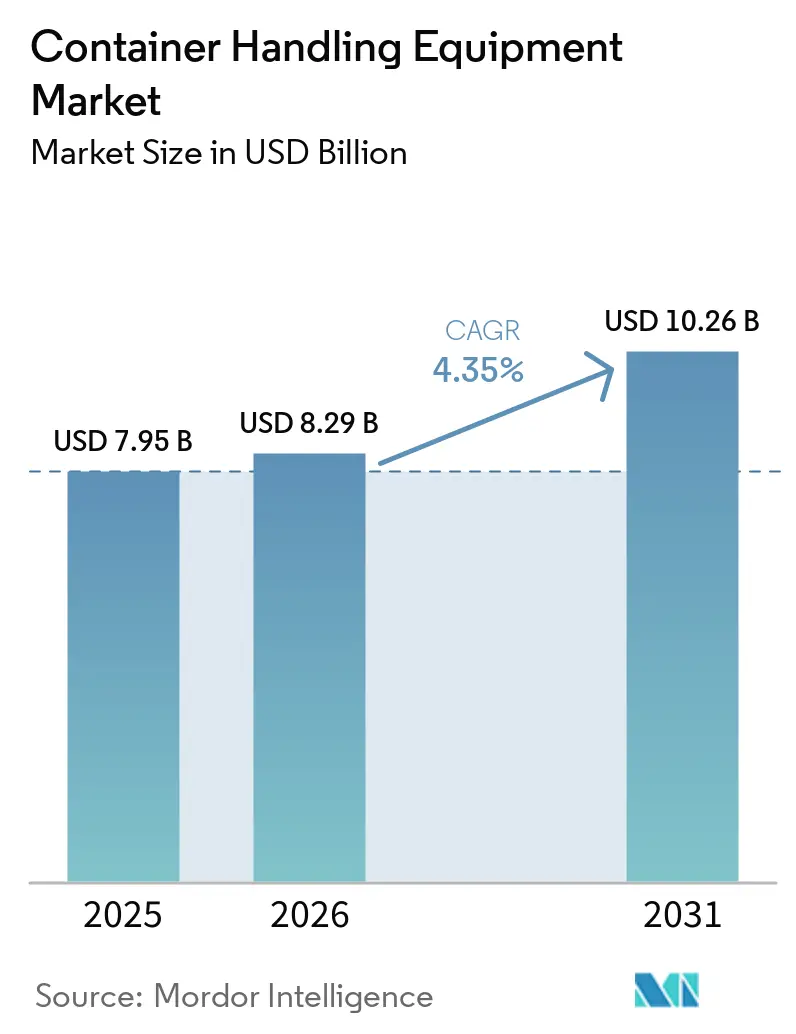
The Container Handling Equipment Market size was valued at USD 7.95 billion in 2025, is expected to reach USD 8.29 billion in 2026, and is forecast to reach USD 10.26 billion by 2031, at a 4.35% CAGR over 2026-2031. This measured growth reflects how operators balance aggressive decarbonization mandates with the capital intensity of fleet electrification. Terminal owners are delaying full fleet replacements until charging infrastructure and grid upgrades become available, while technology suppliers are focusing on modular retrofits that minimize downtime. Asia-Pacific emerged as a significant revenue contributor, while the battery-electric propulsion segment is witnessing substantial growth. This trend indicates that advancements in propulsion technology are expected to play a more significant role than throughput volume in shaping the next investment cycle.
Competitive pressures are intensifying, with Chinese manufacturers offering considerably lower prices than their European counterparts for similar specifications. In response, established brands are prioritizing lifecycle service contracts that include predictive maintenance, energy-management software, and uptime assurances. In addition, inland depots and rail yards, which seaports have traditionally overshadowed, are recording steady expansion. Shippers are driving this growth by shifting transloading activities inland to reduce congestion at marine gateways.
Key Report Takeaways
- By equipment type, forklift trucks captured 38.12% of the container handling equipment market share in 2025, while automated guided vehicles are projected to grow at a 10.85% CAGR through 2031.
- By propulsion type, diesel-powered units maintained 58.04% of the container handling equipment market size in 2025; battery-electric units are advancing at a 17.31% CAGR through 2031.
- By automation level, manual systems held 48.15% of the container handling equipment market share in 2025; fully automated configurations are expected to expand at a 20.14% CAGR through 2031.
- By end-user, seaports and river terminals contributed 73.25% of the container handling equipment market size in 2025, whereas inland depots and rail yards are projected to rise at an 8.96% CAGR through 2031.
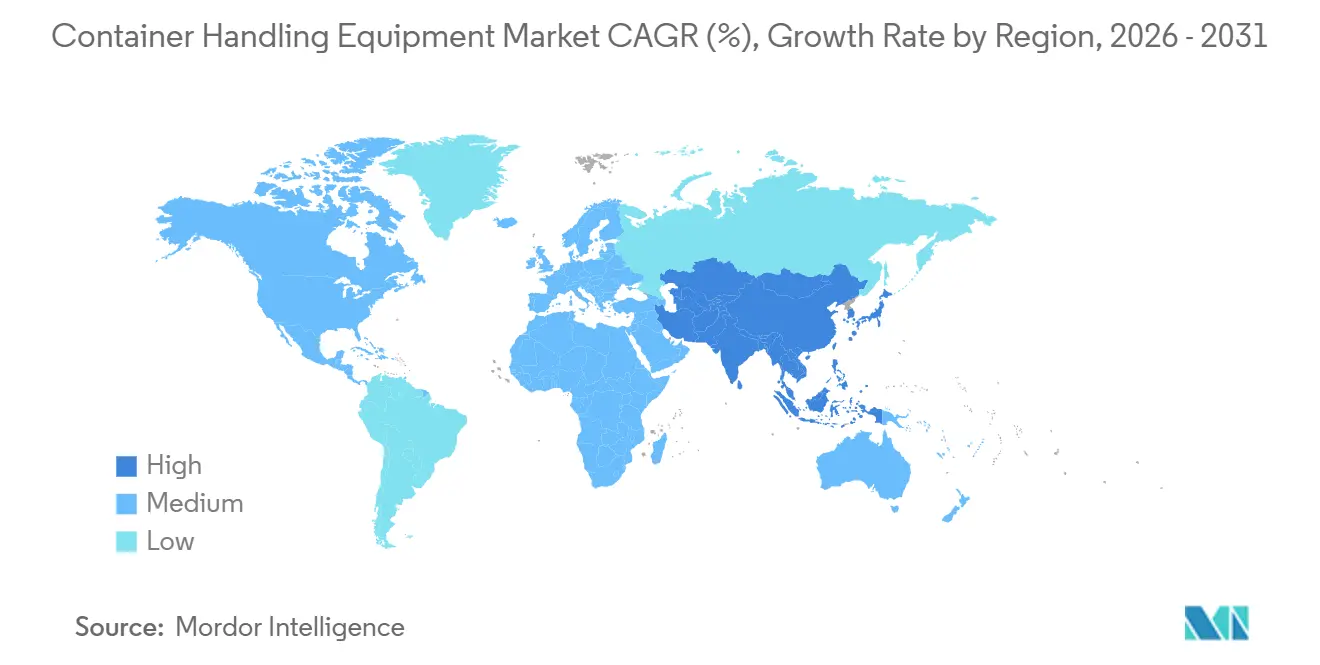
- By geography, the Asia-Pacific region controlled 44.22% of the container handling equipment market size in 2025, and is projected to advance at a 6.88% CAGR through 2031.
Note: Market size and forecast figures in this report are generated using Mordor Intelligence’s proprietary estimation framework, updated with the latest available data and insights as of January 2026.
Market Trends and Insights
Drivers Impact Analysis of Container Handling Equipment Market*
| Driver | (~) % Impact on CAGR Forecast | Geographic Relevance | Impact Timeline |
|---|---|---|---|
| Automating Terminal Operations | +1.5% | Asia-Pacific core, expanding to the Middle East and South America | Long term (≥4 years) |
| Electrifying Container Handling Fleets | +1.2% | Global, with North America and the EU leading | Medium term (2-4 years) |
| Global Port Capacity Expansion | +0.9% | Global, concentrated in Asia-Pacific and the Middle East | Short term (≤2 years) |
| Modular High-Capacity Charging | +0.6% | North America, EU, select Asia-Pacific hubs | Medium term (2-4 years) |
| Secondary Market for Reach Stacker | +0.4% | Global, emerging in North America and the EU | Medium term (2-4 years) |
| Hydrogen Port Handlers | +0.3% | EU hubs and select Middle East terminals | Long term (≥4 years) |
| Source: Mordor Intelligence | |||


Automation and Digitalization of Terminal Operations
PSA's Tuas facility in Singapore has implemented advanced automation technologies, significantly improving operational efficiency and reducing workforce requirements. Konecranes' remote operating stations in Hamburg allow a single operator to manage multiple ship-to-shore cranes simultaneously, improving crane utilization during off-peak shifts. At Tianjin Port, 5G connectivity enables precise coordination of autonomous transporters, supporting safe and efficient mixed-traffic operations. Navis and Kalmar middleware overlays are helping upgrade legacy terminal operating systems; however, implementation requires considerable time. In the future, standardized data exchange could reduce integration friction. For container-equipment condition/event messaging, ISO 9897 (CEDEX) defines general communication codes.
Growing Emphasis on Electrification of Container-Handling Fleets
Regulators are tightening emissions standards, prompting operators to adopt battery-electric fleets where utilization is high enough to ensure payback within one business cycle. DP World has deployed all-electric internal transfer vehicles at Laem Chabang as part of its terminal decarbonization roadmap; broader terminal-equipment electrification is being phased rather than completed as a full-fleet conversion. The United States Environmental Protection Agency disbursed approximately USD 412 million in 2024 under the Clean Ports Program to replace several diesel units by 2027 [1]“Clean Ports Program Funding,” U.S. Environmental Protection Agency, epa.gov. High-utilization terminals in California and New Jersey are leading the transition to electric equipment.
Port Capacity Expansion and Rising Global TEU Throughput
Global container throughput grew significantly, with capacity expansions concentrated mainly in the Middle East and Southeast Asia. DP World expanded Jebel Ali Terminal 4, increasing capacity and integrating advanced automation technologies. King Abdullah Port in Saudi Arabia also expanded capacity and added state-of-the-art equipment to improve operational efficiency. In Singapore, operators continue to use automation to maximize productivity amid limited land availability. In contrast, terminals in the United States continue to lag in automation adoption and remain significantly behind global leaders such as China, according to the Government Accountability Office.
Modular High-Capacity Charging Infrastructure Speeds Electric Roll-Outs
Charging remains a significant challenge for the container handling equipment market. At the Port of Los Angeles, ABB's modular system integrates fast chargers with a battery storage unit, enabling efficient charging during shift changes without additional demand penalties. Kalmar's FastCharge technology supports rapid charging and operates at multiple terminals worldwide. Siemens' mobile chargers offer operational flexibility, as terminals can relocate them across yard zones to accommodate changing layouts. However, despite these technological advancements, high-capacity charging raises overall project costs, while utility demand charges continue to affect operating savings significantly. In Rotterdam, a pilot microgrid integrating wind power with vehicle-to-grid technology demonstrates the potential to reduce electricity costs effectively.
Restraints Impact Analysis of Container Handling Equipment Market*
| Restraint | (~) % Impact on CAGR Forecast | Geographic Relevance | Impact Timeline |
|---|---|---|---|
| High Costs, Slow Returns | -1.1% | Global, acute in emerging markets | Short term (≤2 years) |
| Volatile Component Lead Times | -0.8% | Global, concentrated in North America and the EU | Short term (≤2 years) |
| Legacy Port Grid Bottlenecks | -0.6% | North America, EU, select Asia-Pacific ports | Medium term (2-4 years) |
| Complex Brownfield System Integration | -0.5% | Global, severe at terminals with legacy TOS | Medium term (2-4 years) |
| Source: Mordor Intelligence | |||
High Capital Cost and Long Pay-Back Periods
Battery-electric units are significantly more expensive than their diesel counterparts, with charging infrastructure further increasing project budgets. For example, battery-electric reach-stackers are priced considerably higher than diesel models, and fast chargers also add substantial costs. Operators in emerging markets encounter difficulties in obtaining financing, as local banks remain cautious about residual values. This caution leads to higher lease rates compared to diesel. Although the United States Inflation Reduction Act provides investment tax credits, the associated tax-equity structures tend to prolong project timelines [2]“Inflation Reduction Act Guidance,” U.S. Department of the Treasury, treasury.gov. Battery replacements, required after several years of use, often represent a high cost that is frequently excluded from initial budgets. This omission can substantially reduce anticipated savings. Smaller terminals, handling lower volumes of cargo, struggle to distribute fixed infrastructure costs effectively. Consequently, diesel continues to be the more cost-effective option unless regulations enforce a transition.
Supply-Chain Lead-Time Volatility for Critical Components
Lead times for lithium-ion battery packs and industrial semiconductors have increased significantly, creating challenges for meeting equipment deployment timelines before grant deadlines. Battery manufacturers are prioritizing automotive clients, which limits availability for industrial sectors. Foundries are reallocating capacity away from legacy semiconductor nodes used in motor controllers because these nodes offer lower profitability. Tariff uncertainties related to Chinese steel are driving a shift toward local fabrication; however, new facilities require extended ramp-up periods. Reliance on single sources for traction motors and inverters has delayed the fulfillment of several major orders. To address these challenges, operators are placing equipment orders much earlier, securing supply but limiting financial flexibility.
*Our forecasts treat driver/restraint impacts as directional, not additive. The impact forecasts reflect baseline growth, mix effects, and variable interactions.
Container Handling Equipment Market Segment Analysis
By Equipment Type:
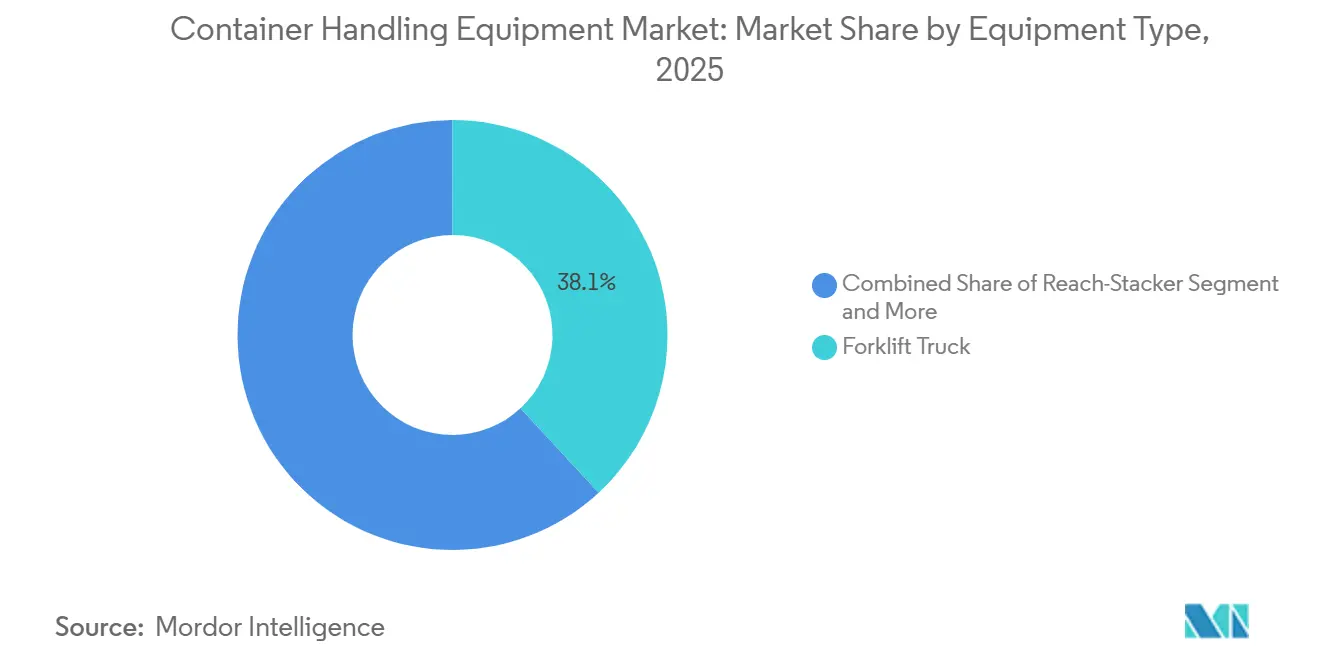
Forklift Dominance Meets AGV DisruptionForklift trucks accounted for 38.12% of the container handling equipment market share in 2025, a testament to their versatility across seaports, inland depots, and warehouses. Automated guided vehicles, although starting from a smaller base, are growing at a 10.85% CAGR, propelled by rising labor costs and a push for continuous operations. By the mid-2020s, terminal tractors are expected to lead the shift toward electrification, with battery-electric models gaining significant traction. In contrast, reach-stackers are slower to adopt electrification due to the higher energy demands of their telescopic-boom work cycles compared to fixed-mast forklifts. Straddle carriers are increasingly utilizing hybrid diesel-electric drivetrains, which efficiently capture braking energy and provide notable fuel savings without requiring charging infrastructure.
The deployment of automated guided vehicles (AGVs) is expected to expand globally, with notable adoption in key regions. Although AGVs involve higher initial costs, they deliver operational efficiencies by optimizing container-yard density and reducing truck waiting times. Additionally, rubber-tired gantry and ship-to-shore cranes are being equipped with remote-operation capabilities, enhancing their utilization during non-peak hours. Fully autonomous rail-mounted gantry cranes have demonstrated significant safety improvements and operational efficiency gains. However, AGV projects continue to face challenges related to infrastructure costs for guidance systems, necessitating careful evaluation of long-term costs before implementation.


By Propulsion Type:
Diesel Incumbency Faces Electric AccelerationDiesel propulsion retained 58.04% of the container handling equipment market share in 2025, reflecting the entrenched installed base and ubiquitous refueling infrastructure. Battery-electric equipment is projected to expand at a 17.31% CAGR through 2031, driven by declining battery prices. Hybrid units captured a nominal share of new sales, offering emissions gains without a full charging infrastructure. Hydrogen has remained niche but is poised to grow as green hydrogen production scales up at major hub ports.
In the near future, the United States EPA plans to replace a significant number of diesel units, focusing on key states such as California, New Jersey, and Washington. Meanwhile, European ports will soon face penalties for non-compliant diesel units, driving a shift towards electrification. Although diesel continues to dominate high-utilization assets—those operating extensively throughout the year—due to the advantage of continuous refueling over charging downtimes, the total cost of ownership is transforming. In many regions, electricity costs are increasing compared to diesel prices.
By Automation Level:
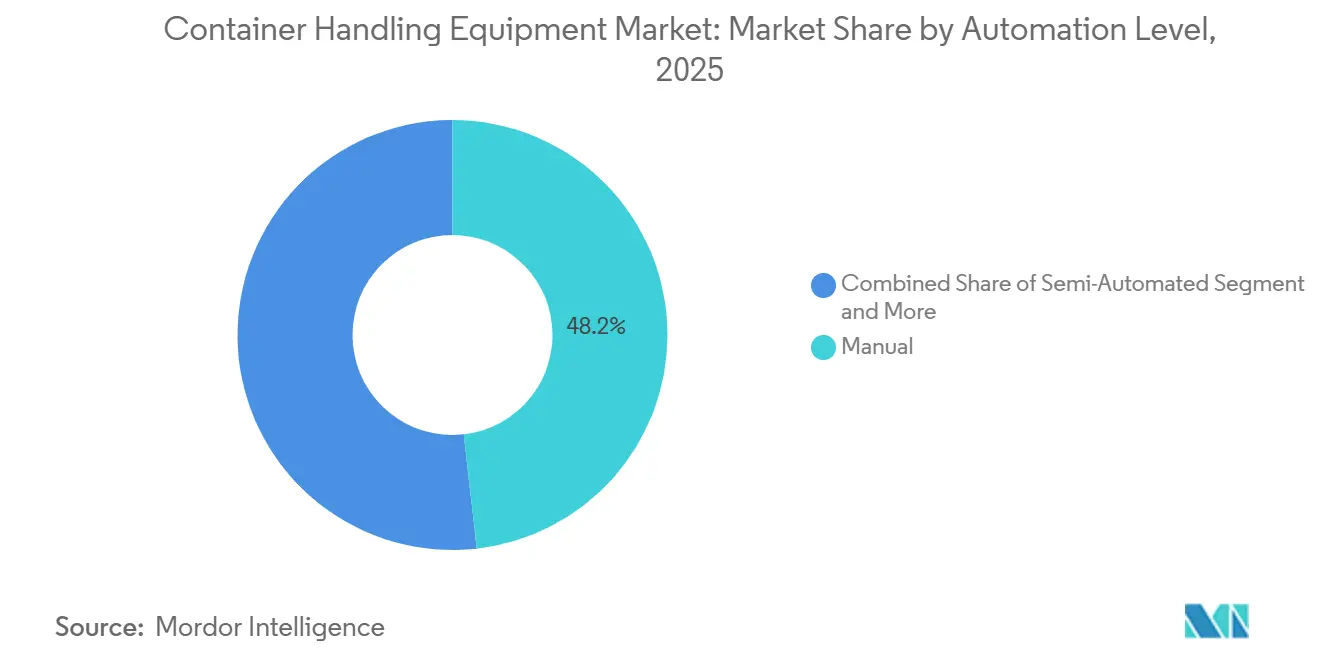
Manual Operations Persist Amid Autonomous GainsManual systems held 48.15% of the container handling equipment market share in 2025, mainly because labor-intensive emerging markets have wage levels below the breakeven point of automation. Semi-automated solutions captured a significant share by adding collision avoidance and smart positioning without eliminating drivers. Fully automated configurations are projected to grow at a 20.14% CAGR through 2031, particularly in China and the Middle East, where greenfield projects are increasingly adopting lights-out operations. Yangshan Phase IV operates entirely without manual intervention, achieving high handling accuracy and lower operating costs.
Brownfield retrofits are generally slower and more expensive to implement. In Hamburg, remote-operated cranes significantly improved utilization but required extensive customization of the TOS over a prolonged period. In the United States and certain European regions, labor agreements restrict the extent of automation, necessitating the use of hybrid fleets and limiting the immediate adoption of automation. Meeting ISO 3691-4 safety standards adds considerable costs due to the need for redundant sensors. However, automated yards demonstrate clear advantages by delivering higher throughput per acre, which becomes increasingly critical as land availability near urban gateways diminishes.
By End-User:
Seaports Lead, Inland Depots AccelerateSeaport and river terminals represented 73.25% of the container handling equipment market size in 2025, driven by the concentration of international trade at marine gateways. Inland depots and rail yards, however, are projected to grow at an 8.96% CAGR through 2031, as beneficial cargo owners pursue near-dock transloading and enhance supply chain resilience. Container freight stations serving e-commerce captured a significant share of demand, leveraging high-density storage systems.
Rail-linked inland depots use electric reach-stackers and rubber-tired gantry cranes to offload double-stack trains, cutting marine terminal dwell times by 20-30%. BNSF Railway’s procurement of electric gantry cranes for Southern California intermodal sites demonstrates rail’s rising role. Warehouse operators favor lithium-ion forklifts that allow opportunity charging, avoiding floor-space-intensive battery swaps. The shift inland is expected to grow as seaport land values and urban restrictions limit on-dock expansion.
Geography Analysis
APAC Container Handling Equipment Market
The Asia-Pacific region accounted for 44.22% of the container handling equipment market share in 2025 and is projected to grow at a 6.88% CAGR through 2031. China handled substantial container volumes in 2024 and is extending the Yangshan automation model to key ports, including Qingdao and Tianjin, to improve operational efficiency and throughput. India’s Jawaharlal Nehru Port Authority (JNPA) stated that its container handling capacity is expected to expand significantly as ongoing infrastructure and terminal development projects come online. Southeast Asian hubs, such as Singapore and Port Klang, are using automation to offset tightening labor markets, enhance berth productivity, and support more reliable cargo movement. Meanwhile, Japan and South Korea are prioritizing the electrification of existing fleets to align port operations with their carbon-neutral pledges and to reduce emissions across container-handling activities.
Europe and North America Container Handling Equipment Market
Europe is expected to hold a notable share of revenue in 2025, constrained by mature throughput and labor protections but supported by zero-emission deadlines. Rotterdam handled 13.8 million TEUs in 2024 and continues to electrify operations and pilot alternative fuels alongside shore power initiatives to reduce maritime-related CO2 emissions by 2030. Hamburg’s remote crane program has improved utilization, while Antwerp-Bruges is investing in electric tractors and automated rail-mounted gantries. Southern European ports, such as Valencia and Piraeus, are expanding capacity to capture near-shored manufacturing flows into the Mediterranean. North America is expected to capture a significant share of the container handling equipment market size in 2025.
MEA, Turkey and South America Container Handling Equipment Market
The Middle East and Africa held a notable position in the market. DP World’s Jebel Ali Terminal 4 is expected to significantly increase its capacity and introduce advanced automated equipment in 2025. Saudi Arabia’s King Abdullah Port expanded its operations, while Egypt’s Suez Canal Container Terminal implemented new electric gantry cranes. South Africa, despite operational challenges, has committed substantial investments toward port modernization. Turkey’s Ambarlı Port is upgrading its infrastructure with autonomous guided vehicles to enhance connectivity along the Europe-Central Asia corridors. South America also held a modest share of the market. Brazil’s key ports underwent modernization as part of privatization efforts.

Regulatory Landscape
Regulation affecting container handling equipment is tightening around two themes: workplace safety and air-emissions control. In the United States, OSHA standards for marine terminals and longshoring set operational and maintenance requirements. For example, OSHA 1917.50 requires container-handling spreaders to be proof-load tested (25% above rated capacity) before initial use and after structural repairs, which drives structured inspection, test documentation, and downtime planning for crane and spreader owners.
On emissions and technology compliance, state and regional rules increasingly steer procurement toward lower-emission and zero-emission equipment at ports and rail yards. California Air Resources Board (CARB) administers the Mobile Cargo Handling Equipment regulation (13 CCR 2479) and continues formal evaluation of the pathway toward zero-emission technology transition targets under CARB Resolution 17-8 (referenced in agency technology assessment work released in 2026). New Jersey Administrative Code 7:27-34 sets phased engine requirements for diesel-fueled cargo-handling equipment, including Tier-based milestones such as Tier 1 engines by March 1, 2026. In parallel, standards updates raise technical compliance needs for OEMs: EN 15056:2026 defines safety requirements for spreaders interacting with ISO freight containers, and global interoperability relies on ISO container-related standards such as ISO 668 and ISO 3874, increasing the importance of certified designs and traceable conformity processes for international deliveries.
Value Chain Analysis
The value chain spans upstream metals and fabricated structures, electrification and automation subsystems, core equipment manufacturing and assembly, and downstream commissioning and lifecycle services. Key upstream inputs include steel structures, hydraulic systems, spreaders and twistlocks, and powertrain electronics such as traction motors, inverters, industrial semiconductors, and lithium-ion battery packs for battery-electric and hybrid platforms. OEMs and specialist suppliers integrate these into container handlers (reach stackers, straddle carriers, RTGs, STS cranes, terminal tractors, and AGVs), then deliver through direct contracts with terminal operators, EPC partners, and port authorities. Recent large orders reflect the project-led nature of demand and the need for engineering and logistics execution, including Liebherr's June 2026 order for seven ship-to-shore cranes for the Sparrows Point Container Terminal in Baltimore, and Konecranes' multi-terminal RTG supply programs.
Downstream, the service layer is increasingly decisive as ports prioritize uptime, energy management, and software-enabled maintenance over the lowest initial purchase price. This includes installation and commissioning, operator training, spare parts depots, remote diagnostics, and retrofit programs (electrification, automation, and remote operations) that keep brownfield terminals operating while upgrading capability. Component lead-time volatility in batteries and industrial semiconductors can shift purchasing toward earlier ordering and framework agreements, while standardization efforts and safety requirements (including spreader testing and updated spreader safety standards) raise demand for certified parts, documented inspections, and OEM-backed service coverage across the installed base.
Competitive Landscape
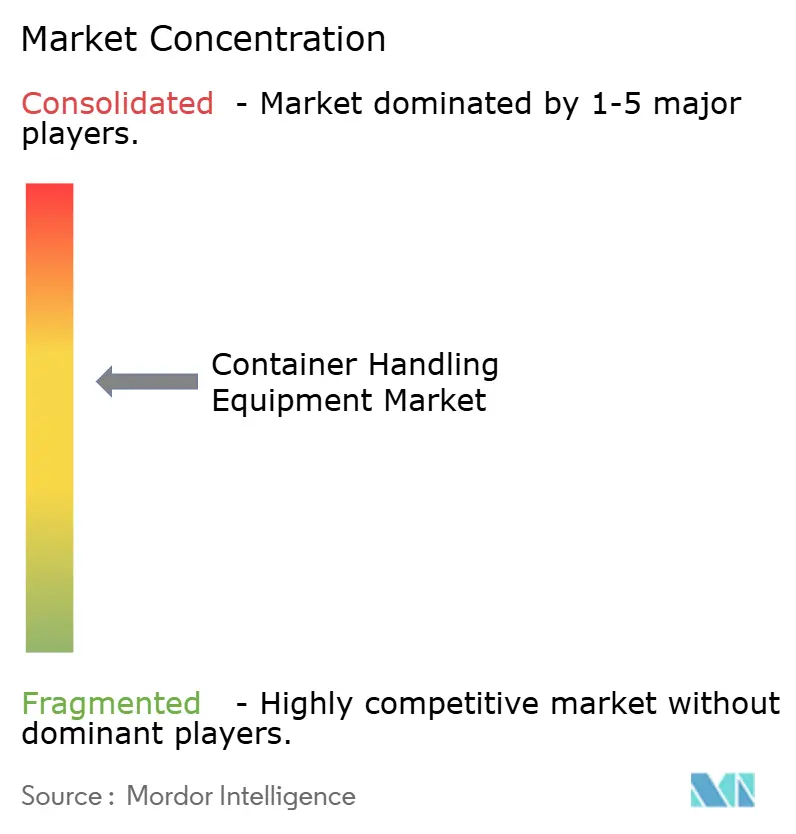
The container handling equipment market remains moderately concentrated, with Kalmar, Konecranes, ZPMC, Liebherr, and SANY expected to account for a notable share of global shipments over the near term. Chinese manufacturers are using vertically integrated supply chains to significantly underprice European competitors, prompting incumbents to compete through lifecycle services.
Retrofit electrification is emerging as a key opportunity area. Taylor Machine Works offers a kit to convert diesel reach stackers, targeting units in North America and Europe. GAUSSIN deploys autonomous electric tractors with rapid battery swaps and is running pilots in Dubai and Singapore. Software platforms are becoming increasingly central, with Kalmar TLS and Navis competing to become the operating system for automated terminals, similar to platform strategies in adjacent industries. Patent activity in collision avoidance and energy optimization has increased, led by Konecranes, ABB, and Siemens.
Lifecycle revenue now exceeds hardware margins. Operators demand performance guarantees linked to uptime and kilowatt-hours consumed. Chinese brands are responding with on-site parts depots, while European companies bundle remote diagnostics and predictive analytics. Regional assemblers continue to maintain footholds in markets with local-content requirements, sustaining fragmentation below the top tier.
Container Handling Equipment Industry Leaders
SANY Group
Liebherr Group
Konecranes Oyj
Kalmar Corporation (Cargotec)
Shanghai Zhenhua Heavy Industries Co., Ltd. (ZPMC)
- *Disclaimer: Major Players sorted in no particular order
Container Handling Equipment Market Companies Covered in this Report
- Kalmar Corporation (Cargotec)
- Konecranes Oyj
- Liebherr Group
- Shanghai Zhenhua Heavy Industries Co., Ltd. (ZPMC)
- SANY Group
- Hyster-Yale Materials Handling, Inc.
- Toyota Industries Corporation
- KION Group AG
- Terex Corporation
- Anhui Forklift Group Corporation Ltd.
- Lonking Holdings Limited
- CVS ferrari S.P.A.
- Doosan Corporation
- Mitsubishi Logisnext Co., Ltd.
- Taylor Machine Works, Inc.
- GAUSSIN

Market Opportunities and Future Outlook
Near-term whitespace is concentrated where decarbonization and automation can be deployed without full terminal rebuilds. Terminal tractors, RTGs, and other high-utilization assets are seeing faster electrification pathways when paired with modular charging and power-management solutions, and operators are validating this through fleet actions rather than pilot-only activity. For example, DP World deployed 35 electric terminal tractors at Jeddah Islamic Ports South Container Terminal in July 2026, and YILPORT placed a large multi-country order for 53 Konecranes E-Hybrid RTGs (including automated units) to be deployed across terminals in Europe, Africa, and Central America. These moves expand the addressable market for charging, energy storage, and grid-integration packages that reduce peak demand exposure and simplify phased conversion plans.
Automation opportunity is broadening from greenfield mega-terminals to brownfield crane and yard retrofits, where incremental upgrades unlock safety and productivity gains without full equipment replacement. Evidence includes ABB's May 2026 launch of its Waterside Automation solution for quay cranes and terminal-level deployments such as Adani Ports fully automated container cranes at Vizhinjam (with ABB) announced in June 2026. Parallel demand is building for remote-operation kits and modernization programs that extend the working life of existing crane fleets while meeting tighter safety and emissions constraints. This environment supports business models that bundle hardware, controls, software integration, and multi-year service contracts, particularly for terminals balancing capex constraints with compliance deadlines and throughput requirements.
Recent Industry Developments in Container Handling Equipment Market
- July 2026: Konecranes entered into an agreement to acquire a 70% interest in Mitsubishi Electric FA Industrial Products to expand its footprint in Japan. The move strengthens access to local capabilities and broadens service coverage for installed equipment, supporting lifecycle revenue tied to uptime and modernization.
- June 2026: Liebherr secured an order for seven ship-to-shore cranes for the Sparrows Point Container Terminal in Baltimore, United States. The contract reinforces demand for large quay-crane capacity in North America and adds a sizable installed base that typically drives long-term commissioning and maintenance activity.
- October 2025: Konecranes debuted the Noell hydrogen fuel-cell straddle carrier at TOC Americas. The unveiling signals a broader push toward hydrogen-ready port equipment in the market.


Container Handling Equipment Market Report Scope and Research Methodology
Market Definition and Coverage
For this study, the market covers revenue from equipment used to lift, move, stack, and position ISO containers in ports, terminals, depots, and intermodal yards, measured as equipment sales and installed deliveries in USD.
Scope exclusions: Software and standalone automation systems that are not sold with physical container-lifting equipment are excluded.
Segments Covered in This Report
- By Equipment Type
- Forklift Truck
- Reach Stacker
- Straddle Carrier
- Rubber Tired Gantry Crane
- Ship-to-Shore Crane
- Automated Guided Vehicle (AGV)
- Terminal Tractor/Yard Truck
- By Propulsion Type
- Diesel
- Hybrid
- Battery Electric
- Hydrogen Fuel Cell
- Others (Gasoline, LPG, etc.)
- By Automation Level
- Manual
- Semi-Automated
- Fully Automated
- By End-User
- Seaport and River Terminals
- Inland Container Depots/Rail Yards
- Container Freight Stations and Warehouses
- By Geography
- North America
- United States
- Canada
- Rest of North America
- South America
- Brazil
- Argentina
- Rest of South America
- Europe
- Germany
- United Kingdom
- France
- Italy
- Spain
- Netherlands
- Russia
- Rest of Europe
- Asia-Pacific
- China
- India
- Japan
- South Korea
- Australia
- Rest of Asia-Pacific
- Middle East and Africa
- Turkey
- Saudi Arabia
- United Arab Emirates
- South Africa
- Egypt
- Rest of Middle East and Africa
- North America
Data Sources, Market Sizing, and Validation
Desk Research
We started by building a fact base on container flows, port activity, and equipment replacement cycles, then mapped how these translate into purchasing for terminals and inland nodes. Public sources helped anchor the demand backdrop and policy context, including UNCTAD maritime trade and port call indicators, World Bank logistics and trade series, OECD transport statistics, and national port authority annual statistics where available. We also reviewed IAPH materials and safety or emissions guidance from agencies such as the IMO to understand operating constraints that shape buying decisions.
To connect demand to supplier revenue, we reviewed company filings, investor presentations, product brochures, and reputable industry press coverage on fleet upgrades and new terminal projects. Where needed, paid subscriptions covering company financials and news helped verify revenue splits, and patent databases were used to track where electrification and automation features are moving. This desk research list is illustrative, and additional sources were used throughout data collection, validation, and clarification.
Primary Interviews and Surveys
Our primary work focused on interviews and short surveys with port and terminal operations leaders, fleet maintenance teams, equipment distributors, and logistics yard managers across major trading corridors. We used these discussions to confirm buying triggers, typical replacement timing, and how pricing differs by equipment class, powertrain choice, and duty cycle, then reconciled gaps seen in public data.
Distribution of primary research fieldwork respondents
Distribution of primary research fieldwork respondents
| Company type | Respondent position | Region |
|---|---|---|
| Top tier: 35% | CXOs: 14% | APAC: 42% |
| Mid tier: 46% | Functional/Unit leaders: 30% | EMEA: 36% |
| Smaller Players: 19% | Managers: 56% | Americas: 22% |
Market-Sizing & Forecasting
Sizing was built using top-down logic where container throughput and yard activity are converted into an addressable equipment demand pool, then translated into revenue using observed pricing and replacement behavior. Key inputs included TEU throughput growth at major gateways, the share of containers handled through inland depots and rail yards, typical fleet replacement age for heavy handling equipment, the mix shift toward electric and hybrid units, and average selling price ranges by equipment type and lifting capacity. After combining these signals, the final market total was reached, with adjustments for regional purchase timing and project-driven lumpiness.
We then ran selective bottom-up checks to keep the totals realistic, including supplier revenue roll ups from public disclosures, sampled ASP times estimated unit shipments by major regions, and channel checks with distributors and service providers. Where shipment visibility was incomplete, gaps were handled using proxy ratios tied to throughput and fleet intensity, then verified in primary discussions. For forecasting, scenario analysis was applied around port capex cycles, electrification adoption pace, and trade growth variability, and scenario weights were tuned based on what respondents described as the most probable procurement path.
Data Validation & Update Cycle
We validate the outputs by comparing the modeled revenue trend against independent signals such as port expansion announcements, terminal automation investment plans, and observed changes in fleet powertrain mix. Any sharp jumps are reviewed for data entry issues, one-off project effects, and currency conversion timing, then the assumptions are revisited before sign-off. A second analyst review is done to confirm that inputs, math, and logic are consistent across regions and years.
The report is refreshed annually, and interim updates are triggered when material events occur, such as major trade disruptions, large terminal build-outs, or policy changes that accelerate equipment electrification. Before delivery, a final pass is completed so clients receive the most current view available at that time.
Mordor Intelligence's Container Handling Equipment Market Sizing Compared With Other Published Estimates
Published market sizes for container handling equipment can vary even when the topic sounds identical, since researchers often draw different lines around what counts as equipment revenue and which end users are included. Differences also come from how pricing is handled over time, how cyclical port capex is treated, and whether inland handling is captured alongside seaport terminals.
The benchmark table shows a spread that is mainly explained by scope and pricing logic. In the Mordor Intelligence model, the total is built from port terminals plus inland depots and intermodal yards, with equipment-only revenue counted and prices adjusted by equipment class rather than using a single blended ASP.
Benchmark comparison
| Source | Market Size | Gaps in Research Methodology |
|---|---|---|
| Mordor Intelligence | USD 8.27 B (2026) | |
| Trade Journal A | USD 7.99 B (2024) | Often limits coverage to seaport terminal equipment purchases and may not fully include inland depots and rail yard handling, which reduces the addressable demand pool in years with intermodal expansion. |
| Industry Publisher B | USD 10.26 B (2025) | Uses a broader definition that can blend adjacent material handling gear and applies higher blended pricing, which can lift totals when ASP progression is not separated by cranes, carriers, and stackers. |
Reading the three figures together, the biggest takeaway is that scope and pricing discipline drive most of the gap, not a disagreement on trade growth. By tying demand to throughput and fleet intensity, and then checking the result against supplier signals and real purchasing behavior, our estimate stays traceable to clear variables and repeatable steps.


Key Questions Answered in the Report
What is the projected global value of container handling equipment by 2031?
The sector is forecast to reach USD 10.26 billion by 2031, up from USD 8.29 billion in 2026.
Which propulsion technology is growing fastest in container terminals?
Battery-electric equipment is expanding at a 17.31% CAGR through 2031 as falling battery prices and emissions mandates align.
Why are inland container depots gaining equipment demand?
Near-dock transloading strategies shift boxes away from congested seaports, pushing inland depot and rail-yard equipment demand at an 8.96% CAGR through 2031.
How are ports overcoming grid-capacity constraints for electrification?
Terminals pair fast chargers with on-site battery storage or microgrids, shaving peak demand charges and avoiding multi-year utility upgrades.
Page last updated on:


 Your data is secure and never sold or shared.


