
Container As A Service Market Size and Share
Market Overview
| Study Period | 2020 - 2031 |
|---|---|
| Market Size (2026) | USD 6.03 Billion |
| Market Size (2031) | USD 23.35 Billion |
| Growth Rate (2026 - 2031) | 31.10 % |
| Fastest Growing Market | Asia-Pacific |
| Largest Market | North America |
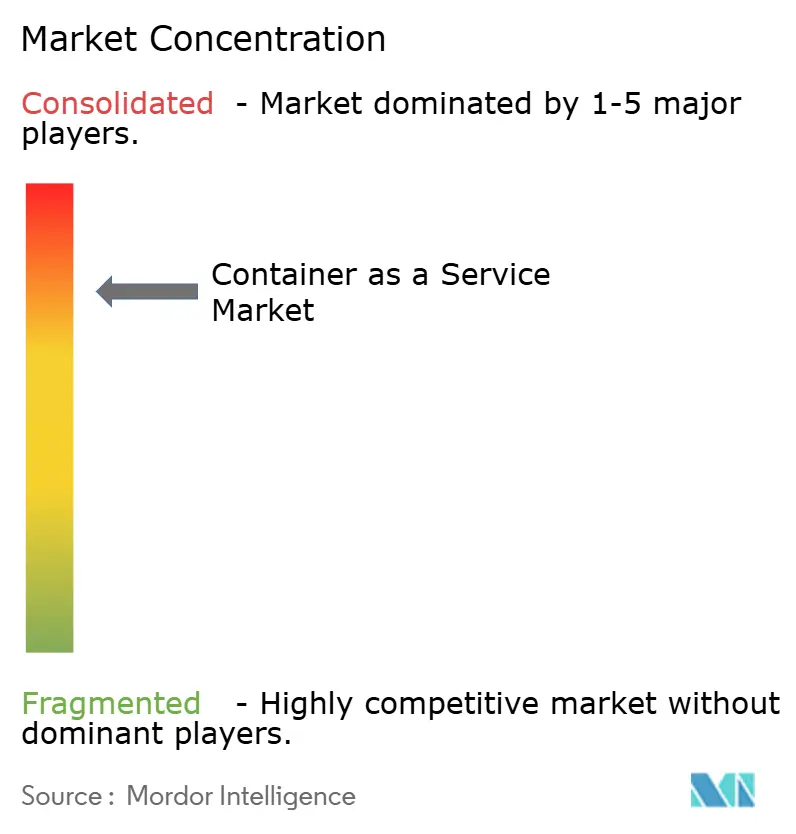
| Market Concentration | High |
Major Players *Disclaimer: Major Players sorted in no particular order Image © Mordor Intelligence. Reuse requires attribution under CC BY 4.0. | |
Container As A Service Market Analysis by Mordor Intelligence
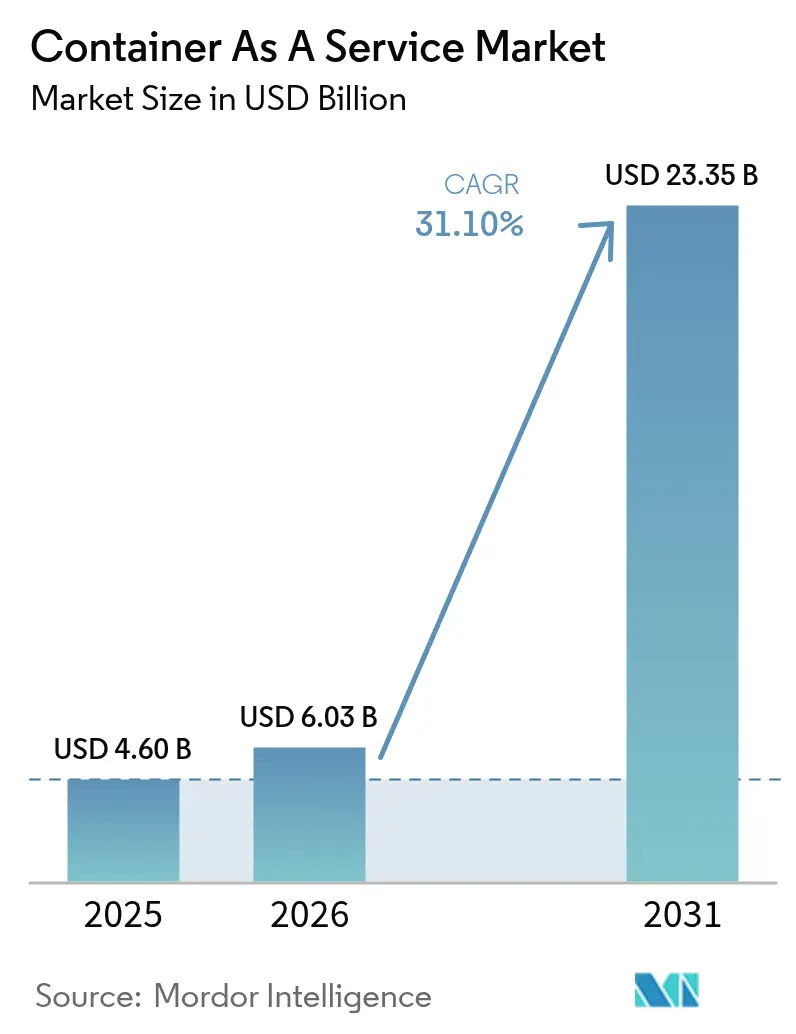
The Container-as-a-Service market size is expected to grow from USD 4.6 billion in 2025 to USD 6.03 billion in 2026 and is forecast to reach USD 23.35 billion by 2031 at 31.1% CAGR over 2026-2031. Strong demand for cloud-native agility, rising multi-cloud strategies and granular resource allocation are reshaping enterprise infrastructure decisions. Sovereign-cloud directives in Asia-Pacific and Europe, together with mandatory software bill of materials (SBOM) rules, are widening adoption beyond classic lift-and-shift migrations. Cloud deployment still represents 78% of revenue, but on-premise deployment is accelerating at a 34% CAGR as regulated industries embrace hybrid models. Managed services, which hold 54% share, are taking on security scanning and compliance automation tasks once handled internally. Small and medium enterprises now form the fastest-growing customer group, reflecting the appeal of pay-per-use billing and low entry costs. Manufacturing is the leading growth vertical, leveraging lightweight orchestration to operate AI-enabled edge workloads that support Industry 4.0 initiatives.[1]Red Hat, “Boosting Manufacturing Efficiency and Product Quality with AI/ML, Edge Computing and Kubernetes,” redhat.com
Key Report Takeaways
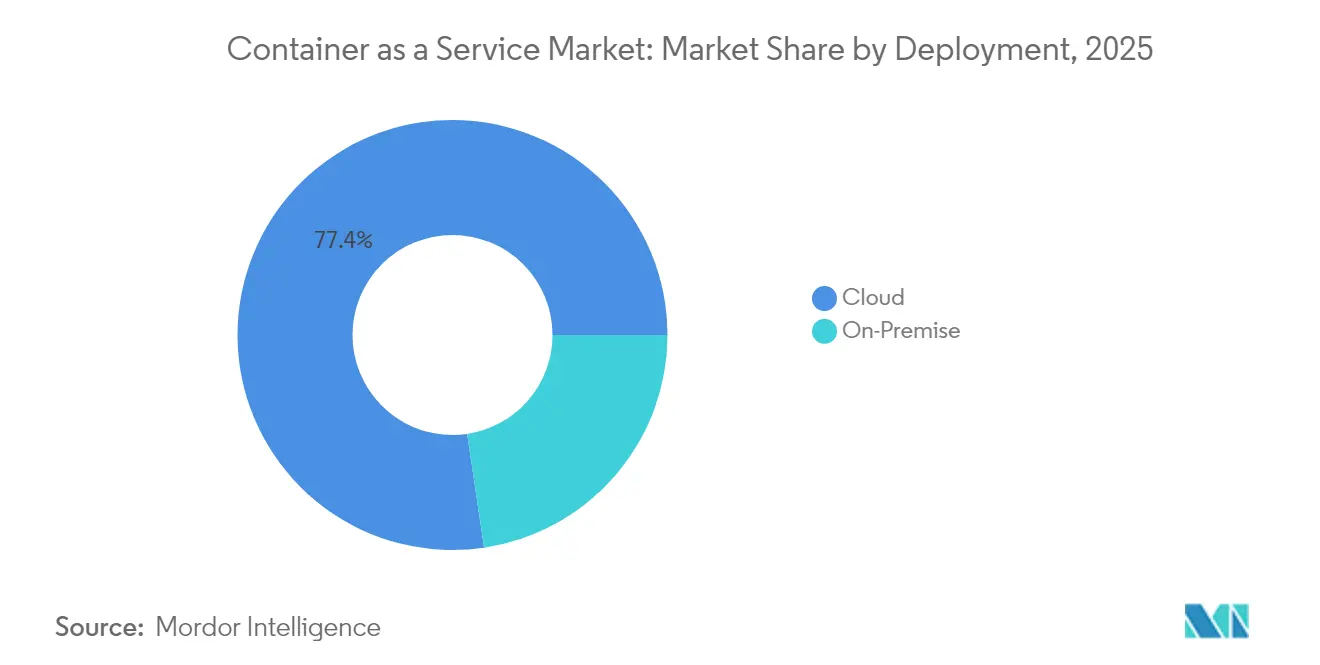
- By deployment, cloud held 77.35% of the Container-as-a-Service market share in 2025; on-premise is projected to expand at a 33.55% CAGR to 2031.
- By service type, managed services commanded 53.35% share of the Container-as-a-Service market size in 2025 and are set to advance at a 33.9% CAGR through 2031.
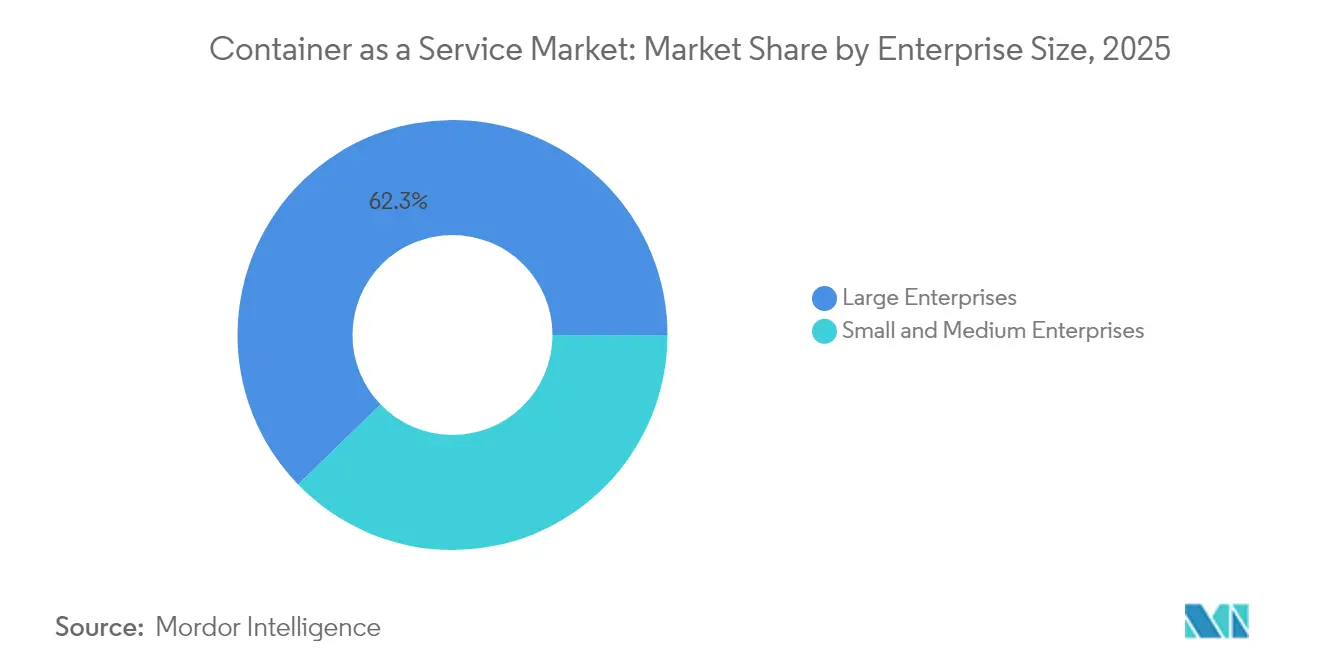
- By enterprise size, large enterprises accounted for 62.25% revenue share in 2025, while SMEs are growing fastest at a 35.85% CAGR.
- By end-user application, manufacturing captured 37.55% of Container-as-a-Service market size for new bookings in 2025 and is forecast to progress at a 37.6% CAGR between 2026-2031.
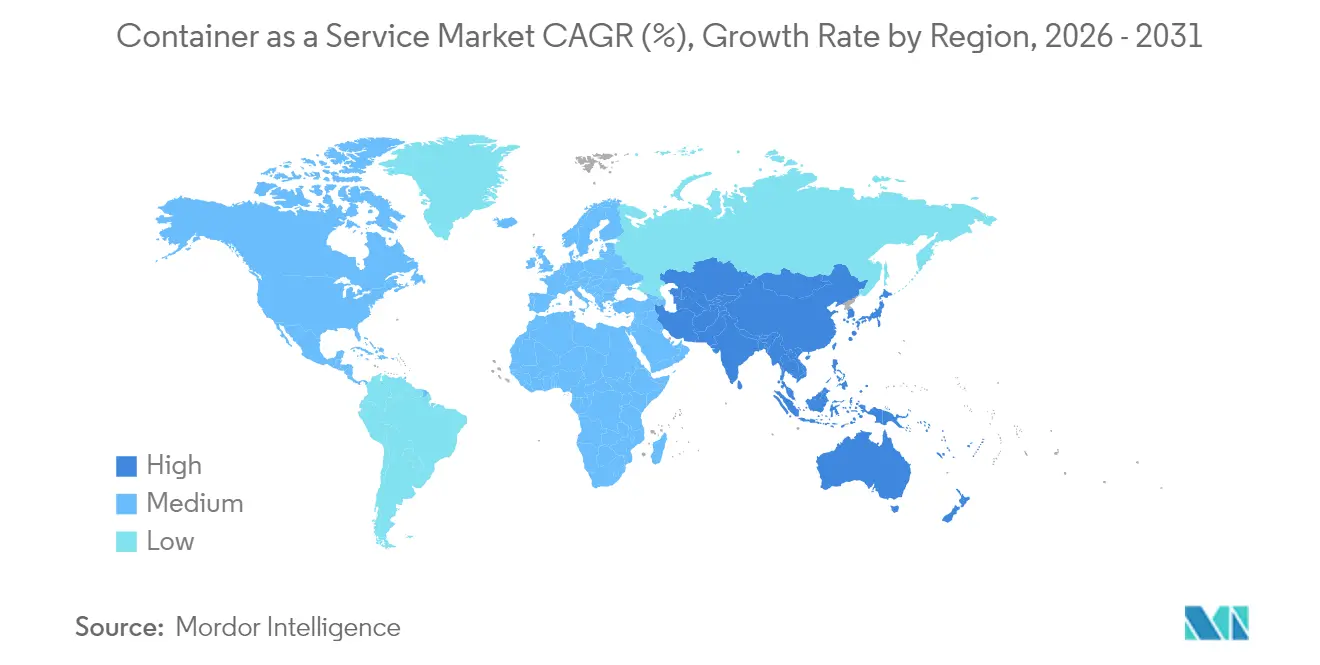
- By geography, North America led with 38.05% Container-as-a-Service market share in 2025; Asia-Pacific is expected to post the highest CAGR of 38.7% through 2031.
Note: Market size and forecast figures in this report are generated using Mordor Intelligence’s proprietary estimation framework, updated with the latest available data and insights as of 2026.
Market Trends and Insights
Drivers Impact Analysis of Container As A Service Market*
| Driver | (~) % Impact on CAGR Forecast | Geographic Relevance | Impact Timeline |
|---|---|---|---|
| Cloud-agnostic Kubernetes platforms avert lock-in | +8.5% | Global, stronger in North America and EU | Medium term (2-4 years) |
| Pay-per-use transparency grows SME adoption | +6.2% | Global, strong in APAC emerging markets | Short term (≤2 years) |
| DevSecOps SBOM mandates accelerate managed CaaS | +4.8% | North America and EU | Short term (≤2 years) |
| AI/ML GPU-ready clusters surge | +7.1% | Global, concentrated in tech hubs | Medium term (2-4 years) |
| 5G edge micro-DC roll-outs need lightweight CaaS | +3.9% | APAC core, spill-over to North America | Long term (≥4 years) |
| Sovereign-cloud mandates spur domestic CaaS | +2.8% | APAC and EU | Medium term (2-4 years) |
| Source: Mordor Intelligence | |||
Cloud-agnostic Kubernetes Platforms Avert Lock-in
Enterprises increasingly deploy cloud-agnostic orchestration to avoid vendor dependency and negotiate favorable pricing. Platforms that run identical clusters across providers simplify workload portability and reduce migration downtime by 77% in stateful microservices tests. Vendors such as HPE integrate virtual machines and containers within one control plane, strengthening hybrid strategies.[2]HPE Community, “The Next Wave of Virtualization Is Containerized,” community.hpe.com
Pay-per-use Transparency Grows SME Adoption
Consumption pricing eliminates capital expenditure barriers for smaller firms. AWS Fargate and EKS cost-visibility tools help SMEs deploy production clusters without dedicated DevOps teams.[3]Sedai, “Understanding AWS EKS Kubernetes Pricing and Costs,” sedai.io Automated rightsizing and spot-instance use further align expenses with fluctuating traffic, supporting the 36.7% CAGR recorded for SMEs.
DevSecOps SBOM Mandates Accelerate Managed CaaS
Regulators now require detailed component inventories, prompting firms to outsource container security. Managed platforms embed SLSA frameworks, automating provenance tracking and vulnerability scanning. CycloneDX xBOM covers cryptography and ML artifacts, demanding skills many enterprises lack.[4]Security Boulevard, “What Is the xBOM?” securityboulevard.com
AI/ML GPU-ready Clusters Surge
AI workloads intensify demand for orchestration that schedules GPUs efficiently. Research shows optimized scheduling cuts CPU overhead by 1.5% while boosting request handling by 32.4%. Manufacturing pilots on Red Hat OpenShift prove real-time analytics can improve product quality and predictive maintenance.
Restraints Impact Analysis of Container As A Service Market*
| Restraint | (~) % Impact on CAGR Forecast | Geographic Relevance | Impact Timeline |
|---|---|---|---|
| Shortage of certified K8s operators | -4.2% | Global, acute in emerging markets | Short term (≤2 years) |
| Kernel-level escape and eBPF attack vectors | -3.1% | Global, heightened in regulated industries | Medium term (2-4 years) |
| Unpredictable cloud egress fees | -2.8% | Global | Short term (≤2 years) |
| Fragmented observability licensing costs | -1.9% | North America and EU | Medium term (2-4 years) |
| Source: Mordor Intelligence | |||
Shortage of Certified K8s Operators
The talent gap delays deployments and raises operating risk. Enterprises in emerging markets often rely on costly consultants, lengthening project timelines. Training pipelines have yet to match demand for service-mesh, GitOps and edge cluster skills.
Kernel-level Escape and eBPF Attack Vectors
Notable exploits such as CVE-2023-5528 illustrate how malicious YAML files can gain SYSTEM privileges, expanding the threat surface. Confidential-computing solutions and stricter runtime sandboxing are gaining traction in financial services to mitigate these risks.
*Our forecasts treat driver/restraint impacts as directional, not additive. The impact forecasts reflect baseline growth, mix effects, and variable interactions.
Container As A Service Market Segment Analysis
By Deployment:
Hybrid Strategies Drive On-Premise AccelerationOn-premise clusters are forecast to grow at a 33.55% CAGR even though cloud maintains dominant share. This reflects compliance needs, local-processing latency advantages and a desire to modernize existing hardware rather than relocate every workload. HPE GreenLake offers consumption-based private-cloud pricing that mirrors public-cloud economics, demonstrating how suppliers adapt to hybrid demand.
Organizations usually run development and bursting workloads in the cloud while retaining latency-sensitive or regulated applications on-site. The Container-as-a-Service market supports seamless workload migration through unified control planes, allowing teams to shift containers in response to performance or sovereignty requirements. As hybrid maturity rises, placement decisions hinge on measurable cost and compliance variables rather than a default cloud-first stance.


By Service Type:
Managed Services Maintain Growth LeadershipManaged offerings hold 53.35% share and are expanding at 33.9% CAGR as enterprises offload day-two operations. Providers integrate AI-driven resource tuning and automated patching, ensuring uptime while lowering internal headcount needs. T-Mobile adopted a managed Red Hat OpenShift stack for telco cloud functions, validating the approach for mission-critical 5G workloads.
Professional services remain essential for migrations and complex integrations, but revenue is episodic. Over time, recurring managed contracts outpace project work. The Container-as-a-Service market reflects this shift as new features—SBOM automation, supply-chain security and FinOps dashboards—are bundled into subscription tiers that deliver measurable outcomes.
By Enterprise Size:
SMEs Challenge Traditional Adoption PatternsLarge enterprises currently control 62.25% revenue, but SMEs are expanding faster because pay-per-use models avoid capital lock-in. Consumption billing, serverless container options and click-through user interfaces reduce the expertise barrier. This democratizes advanced orchestration while fueling 35.85% CAGR among SMEs.
Larger organizations still drive the highest absolute spend, requiring multi-cluster governance, role-based access control and integration with complex IT workflows. Yet SME momentum shapes the product roadmap, nudging vendors toward simplified experiences instead of bespoke customization. The Container-as-a-Service industry therefore spans both streamlined entry-level plans and enterprise-grade control planes.
By End-user Application:
Manufacturing Leads Digital TransformationManufacturing recorded a 37.6% CAGR, overtaking IT and telecom as the lead growth vertical. Real-time analytics, predictive maintenance and autonomous robotics need low-latency edge processing, and containers deliver consistent deployment from factory floor to central cloud. The MHI Industry Report found 55% of manufacturers increasing technology budgets, and case studies report USD 4.2 million annual savings after AI and robotics rollouts.
Meanwhile, IT and telecom retains the largest installed base but shows slower growth as adoption matures. BFSI, retail and healthcare steadily expand, supported by confidential computing and compliance features that container platforms now embed.
Geography Analysis
North America Container As A Service Market
North America earns 38.05% of 2025 revenue, benefitting from established hyperscale ecosystems and aggressive enterprise modernization. Major providers posted double-digit cloud revenue growth in 2025, reinforcing regional dominance. Skills shortages in Kubernetes operations, however, are creating a drag that fuels demand for managed services.
APAC Container As A Service Market
Asia-Pacific is forecast to grow at 38.7% CAGR, the fastest worldwide, due to sovereign-cloud rules and state-funded AI infrastructure. India allocated USD 1.3 billion for compute capacity, including 10,000 GPUs earmarked for public-private AI clusters. China’s ecosystem, led by Alibaba Cloud, Tencent Cloud and Huawei Cloud, is expanding hybrid-cloud deployments, with Huawei Cloud Stack reporting 106% revenue growth in emerging Asia-Pacific markets.
Europe Container As A Service Market
Europe faces distinctive dynamics under the EU Data Act, effective September 2025, which mandates cloud portability and removes switching fees by 2027. Providers with genuinely cloud-agnostic architectures appear better positioned, while sovereignty clauses are likely to spur regional CaaS platforms. Germany, France and the United Kingdom lead adoption, but regulatory complexity could slow purchase cycles until certification schemes settle.

Regulatory Landscape
Container-as-a-Service (CaaS) deployments are increasingly shaped by rules and standards that move beyond general cloud security into container-specific controls, supply-chain transparency, and sovereignty requirements. In Europe, the EU Data Act (effective September 2025) elevates portability obligations for cloud services and targets removing switching barriers by 2027. This has shifted procurement toward Kubernetes platforms that can be operated across clouds and clearer terms for cross-cloud data movement.
Security and compliance requirements are also being formalized through technical standards and sector guidance. ETSI EN 304 635 defines cybersecurity requirements for Container Execution Stacks (runtime, container engine, and orchestration layers) for products with digital elements. That creates a specific compliance anchor for vendors embedding scanning, hardening, and policy enforcement into managed CaaS. In April 2026, Singapore’s Cyber Security Agency issued a Kubernetes security advisory for critical infrastructure covering practices such as image scanning and stricter access and network policies, which is likely to strengthen procurement preference for managed services that can operationalize these controls at scale.
Competitive Landscape
The top three hyperscalers—AWS, Microsoft Azure and Google Cloud—collectively account for 63% of 2025 revenue, but pressure from specialist vendors and edge requirements is rising. IBM’s USD 6.4 billion purchase of HashiCorp bolsters multi-cloud automation, and its planned DataStax acquisition would extend capabilities into real-time vector databases, crucial for AI pipelines. Patent filings covering encrypted orchestration and AI-based cluster management strengthen IBM’s hybrid-cloud moat.
Edge-focused upstarts target resource-constrained environments that hyperscalers cannot serve economically. Red Hat OpenShift Virtualization provides a migration path away from VMware following Broadcom’s acquisition, while HPE GreenLake offers on-prem consumption pricing that mirrors cloud economics. Providers that document measurable cost savings, performance gains and compliance automation are gaining share as procurement teams shift from feature comparisons to business-outcome metrics.
Container As A Service Industry Leaders
Amazon Web Services, Inc.
Google LLC (Google Cloud)
Cisco Systems, Inc.
IBM Corporation
Microsoft Corporation (Microsoft Azure)
- *Disclaimer: Major Players sorted in no particular order
Container As A Service Market Companies Covered in this Report
- Amazon Web Services
- Microsoft Azure
- Google Cloud (GKE)
- IBM Corp (Red Hat OpenShift)
- Alibaba Cloud
- VMware Tanzu
- Cisco Systems
- SUSE Rancher
- Oracle Container Engine
- Hewlett Packard Enterprise (Ezmeral)
- Mirantis
- D2iQ
- Platform9 Systems
- Akamai (Linode)
- DigitalOcean
- Rackspace Technology
- Nutanix
- Canonical
- HashiCorp
- Huawei Cloud
- Tencent Cloud
- OVHCloud

Market Opportunities and Future Outlook
Ultra-scale Kubernetes and AI workload orchestration are opening near-term whitespace for CaaS providers that can deliver higher cluster limits, improved scheduling, and secure isolation for agentic and AI-driven workloads. Recent product milestones provide concrete proof points: AWS expanded Amazon EKS to support up to 100,000 worker nodes per cluster (July 2025), and Oracle Cloud Infrastructure updated OKE to support clusters up to 20,000 worker nodes (July 2026). Kubernetes v1.36 (May 2026) added workload-aware scheduling capabilities, including PodGroup and topology-aware scheduling, which reinforces demand for managed CaaS and platform engineering layers that turn these primitives into repeatable, governed deployment patterns.
Interoperability and sovereignty-driven architecture are also creating room for providers that pair CaaS with multicloud networking and compliance automation. AWS and Google introduced a jointly developed multicloud connectivity service (December 2025), followed by AWS Interconnect-multicloud reaching general availability with Google Cloud as an initial partner (April 2026). This improves practical workload portability without depending on public internet paths. On the enterprise platform side, VMware Cloud Foundation VKS 3.7 (June 2026) introduced an add-on management framework and support for Kubernetes 1.36, aligning with regulated and hybrid buyers that need standardized day-two operations, controlled add-on lifecycles, and consistent security baselines across cloud and on-premise footprints.
Recent Industry Developments in Container As A Service Market
- July 2026: Amazon Web Services introduced container attribute-based rules in AWS Network Firewall to better secure containerized workloads. The update allows teams to apply more granular network policy aligned to container context. This strengthens runtime controls that are increasingly bundled into managed CaaS subscriptions.
- December 2025: AWS and Google Cloud launched a jointly developed multicloud networking service to enable high-speed private connectivity between the two cloud platforms. The move reduces friction for cross-cloud Kubernetes operations. It also supports portability initiatives where enterprises standardize on CaaS while distributing workloads across providers.
- September 2025: Amazon Web Services launched Amazon ECS Managed Instances to offload infrastructure management for containerized applications. By shifting more day-two responsibilities to AWS, it expands the managed-container operating model that competes directly with managed Kubernetes and broader CaaS propositions.


Container As A Service Market Report Scope and Research Methodology
Market Definition and Coverage
This market covers revenue earned from delivering container runtime, orchestration, scaling, monitoring, and lifecycle controls as a managed service, delivered through public cloud, private cloud, or hybrid environments, and accessed through consoles, APIs, and automation tools.
Scope exclusions: It does not count stand alone container runtime libraries, tools sold only as on-prem software licenses, or internal container platforms used only inside a provider's own operations.
Segments Covered in This Report
- By Deployment
- Cloud
- On-Premise
- By Service Type
- Managed Services
- Professional Services
- By Enterprise Size
- Small and Medium Enterprises
- Large Enterprises
- By End-user Application
- BFSI
- Retail
- IT and Telecommunications
- Manufacturing
- Healthcare
- Government
- Others (Media, Gaming, EdTech)
- By Geography
- North America
- United States
- Canada
- Mexico
- South America
- Brazil
- Argentina
- Rest of South America
- Europe
- Germany
- United Kingdom
- France
- Spain
- Italy
- Rest of Europe
- Asia-Pacific
- China
- Japan
- India
- Australia
- South Korea
- Rest of Asia-Pacific
- Middle East
- Israel
- Saudi Arabia
- United Arab Emirates
- Turkey
- Rest of Middle East
- Africa
- South Africa
- Egypt
- Nigeria
- Rest of Africa
- North America
Data Sources, Market Sizing, and Validation
Desk Research
Desk work started with building a clean view of the demand pool and the cloud services context that CaaS sits within. We relied on public sources such as U.S. SEC filings, investor presentations, and earnings call transcripts to understand cloud revenue mix and the direction of managed services. We also reviewed government and official statistics that help explain cloud adoption and digital activity, such as OECD digital economy indicators, ITU ICT statistics, and World Bank data series for enterprise digitization proxies.
To ground the technology side, we used sources such as NIST publications for cloud and container security context, peer reviewed articles on containerization and orchestration usage, and reputable open documentation that clarifies service boundaries and pricing mechanics. We also used paid subscriptions for company financials and intelligence, news and financials, and patent databases to cross-check timelines and product shifts. This list is illustrative, and many other public and paid sources were also used to collect, validate, and clarify data points.
Primary Interviews and Surveys
Primary work was done through structured expert interviews and surveys with cloud service providers, managed service partners, platform and DevOps leaders, and enterprise buyers that run containerized workloads at scale. Input was collected across major geographies so that usage maturity, pricing patterns, and cloud mix assumptions could be tested and then adjusted where the desk inputs were too generic. When gaps showed up, follow-up calls were used to sanity check adoption rates, average spend, and workload growth assumptions.
Distribution of primary research fieldwork respondents
| Company type | Respondent position | Region |
|---|---|---|
| Top tier: 36% | CXOs: 19% | APAC: 41% |
| Mid tier: 43% | Functional/Unit leaders: 35% | EMEA: 36% |
| Smaller Players: 21% | Managers: 46% | Americas: 23% |
Market-Sizing & Forecasting
Our sizing model starts with a top-down build that reconstructs the addressable CaaS revenue pool from cloud adoption signals and the share of containerized workloads that are run on managed container platforms. To keep the logic practical, we treated demand as a function of active container workload growth and the portion that is outsourced to managed services, and then applied realistic spend bands based on how pricing is typically structured (subscription and usage based).
Key inputs used in the model included cloud spending direction from public filings, enterprise container adoption and orchestration penetration trends, growth in managed Kubernetes style services, average price progression per node or cluster over time, and regional cloud maturity differences (which affect adoption timing). Forecasts were developed using scenario analysis supported by expert views, so base case growth reflects expected platform standardization and security driven governance needs, and not only aggressive expansion assumptions. Results were then corroborated with selective bottom-up approximations, like sampling spend per workload and channel checks with service partners, and where data gaps existed for smaller countries, ratios were borrowed from comparable markets and then normalized through review.
Data Validation & Update Cycle
Validation is done through several checks so that the final number is not driven by one assumption. Model outputs are compared against independent signals such as reported cloud segment growth, major platform release cycles, and changes in managed service attach rates discussed by market participants. If a regional figure shows an unusual jump or drop, the driver is traced back to adoption or pricing inputs and then rechecked with a fresh call or an additional public data point.
Before sign-off, the dataset and calculations go through step-by-step analyst reviews, and sensitivity ranges are tested for the most important inputs. The report is refreshed annually, and interim updates are triggered when material events shift pricing, service packaging, or enterprise spending. Right before delivery, a final review pass is completed so clients receive the most current view available.
Mordor Intelligence's Container As A Service Market Size Versus Other Published Estimates
Published market sizes for CaaS can look far apart because the service boundary is not always treated the same way, and because different studies pick different base years, currencies, and growth paths. We also see differences when one model leans more on vendor-side narratives, while another leans more on buyer adoption signals and actual pricing mechanics.
Cloud segment growth signals, managed orchestration adoption cues, and typical usage based pricing structures are the checks that keep Mordor Intelligence tied to a clear revenue pool (managed container services only), which reduces the chance of counting adjacent software tools as service revenue.
Benchmark comparison
| Source | Market Size | Gaps in Research Methodology |
|---|---|---|
| Mordor Intelligence | USD 4.60 B (2025) | |
| Global Consultancy A | USD 6.62 B (2025) | Often captures a wider container stack, where related platform services and add-on tooling can be bundled into the CaaS line, and it may apply broader enterprise spend expansion assumptions across regions. |
| Industry Publisher B | USD 3.50 B (2024) | Uses an earlier base year and a shorter historical window, and the service boundary can tilt toward only orchestration management revenue, which can undercount monitoring, scaling, and lifecycle components sold as managed services. |
The spread in the table mostly comes from two practical choices, which are what gets counted as CaaS revenue and the base year used to start the forecast. By keeping the scope aligned to managed container services and then cross-checking the totals against adoption and pricing signals, we end up with a market size that is easier to trace back to clear inputs and to reproduce over time.


Key Questions Answered in the Report
What is driving the fast growth of the Container-as-a-Service market?
Rapid adoption of cloud-native architectures, sovereign-cloud mandates and pay-per-use billing models are pushing the market toward a 31.1% CAGR through 2031.
Why are on-premise deployments still expanding?
Regulated industries need data control and low-latency processing; hybrid models integrate on-prem clusters with public cloud to meet those needs without losing flexibility.
How are SBOM regulations influencing purchasing decisions?
Enterprises increasingly select managed CaaS platforms that embed automated SBOM generation and vulnerability scanning to satisfy new compliance rules.
Which region will grow fastest over the next five years?
Asia-Pacific is projected to post a 38.7% CAGR, buoyed by government digitization projects and strict data-sovereignty requirements favoring domestic providers.
What skills are in shortest supply for successful container operations?
Certified Kubernetes operators with expertise in multi-cluster management, service mesh integration and security hardening remain scarce worldwide.
How concentrated is the competitive landscape?
The market shows moderate concentration: the top three hyperscalers hold 63% share, but specialist and edge-focused vendors are steadily eroding incumbent dominance.
Page last updated on:


 Your data is secure and never sold or shared.


