
Contact Lens Solution Market Size and Share
Market Overview
| Study Period | 2020 - 2031 |
|---|---|
| Market Size (2026) | USD 10.97 Billion |
| Market Size (2031) | USD 12.97 Billion |
| Growth Rate (2026 - 2031) | 3.40 % |
| Fastest Growing Market | Asia Pacific |
| Largest Market | North America |
| Market Concentration | Medium |
Major Players *Disclaimer: Major Players sorted in no particular order Image © Mordor Intelligence. Reuse requires attribution under CC BY 4.0. | |
Contact Lens Solution Market Analysis by Mordor Intelligence
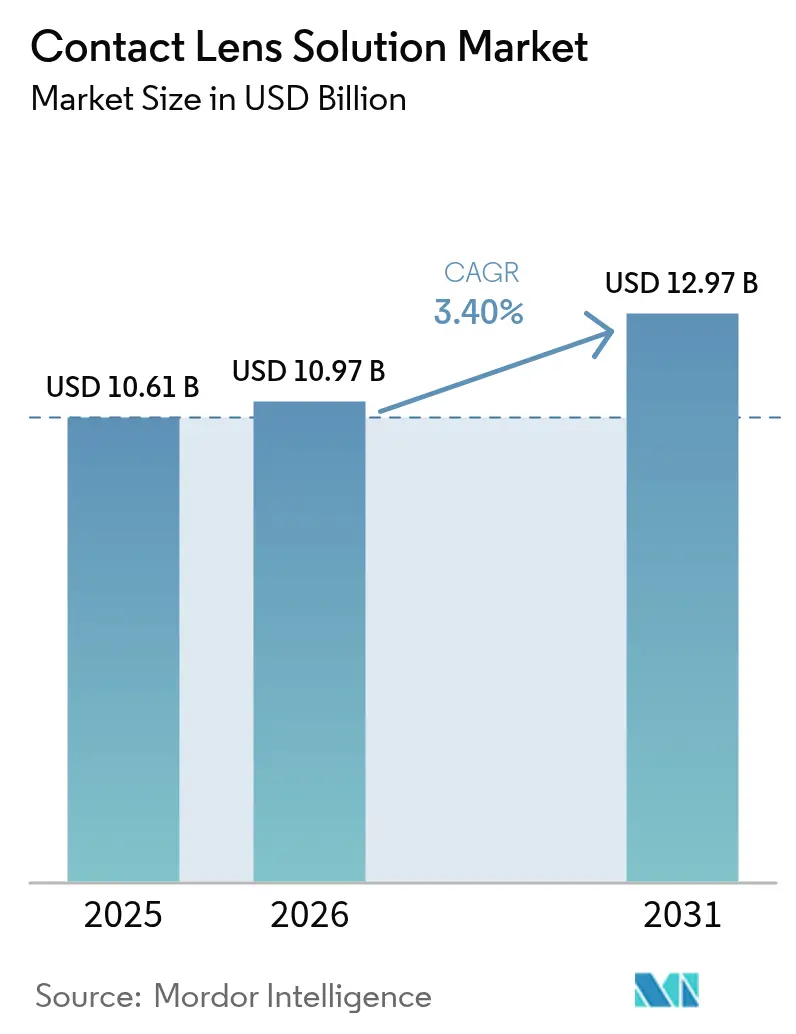
Contact Lens Solution Market size in 2026 is estimated at USD 10.97 billion, growing from 2025 value of USD 10.61 billion with 2031 projections showing USD 12.97 billion, growing at 3.4% CAGR over 2026-2031.
Steady growth reflects a mature landscape in which incremental chemistry improvements, stricter sterility rules, and packaging-related sustainability mandates shape competitive advantage more than volume expansion. Multi-purpose mixes remain prevalent, yet peroxide-based systems are gaining favor as clinicians push for preservative-free disinfection that neutralizes emerging pathogens. Demand also rises for solutions compatible with drug-eluting and orthokeratology lenses, underscoring the market’s pivot toward specialty care. Regionally, Asia-Pacific’s surging myopia prevalence drives outsized consumption, while e-commerce subscriptions challenge brick-and-mortar outlets for share of replenishment transactions. At the same time, hydrogen-peroxide supply constraints and the European Union’s recycled-content targets heighten cost pressure, pushing producers to vertically integrate raw-material sourcing and revamp bottle designs.
Key Report Takeaways
- By solution type, multi-purpose formulas accounted for 62.42% of the contact lens solution market share in 2025, whereas peroxide systems post the fastest 6.33% CAGR to 2031.
- By lens material, silicone-hydrogel applications represented 52.41% of overall demand in 2025, while rigid gas-permeable care is rising at a 5.85% pace as orthokeratology adoption spreads.
- By packaging volume, 121–300 mL bottles held 45.72% of revenue in 2025; formats ≤120 mL are growing at 7.76% CAGR on travel convenience and lower contamination risk.
- By distribution channel, retail pharmacies and optical stores controlled 42.05% of 2025 sales, yet e-commerce is accelerating 7.28% annually through 2031 on subscription uptake.
- By geography, North America held 37.62% of contact lens solution market size in 2025, while Asia-Pacific is poised to expand at an 8.61% CAGR through 2031.
Note: Market size and forecast figures in this report are generated using Mordor Intelligence’s proprietary estimation framework, updated with the latest available data and insights as of 2026.
Market Trends and Insights
Drivers Impact Analysis of Contact Lens Solution Market*
| Driver | (~) % Impact on CAGR Forecast | Geographic Relevance | Impact Timeline |
|---|---|---|---|
| Growing prevalence of refractive errors | +0.8% | Global, APAC concentration | Long term (≥ 4 years) |
| Digital-device–linked dry eye fueling hygiene product sales | +0.5% | Global urban centers | Short term (≤ 2 years) |
| Aging population demanding safer disinfection regimes | +0.4% | North America, EU, Japan | Long term (≥ 4 years) |
| Regulatory push toward preservative-free formulations | +0.2% | Global, EU-led | Medium term (2-4 years) |
| Rise in daily-disposable lens adoption boosting ancillary purchases | +0.6% | North America & EU | Medium term (2-4 years) |
| Drug-releasing soft lenses requiring compatible care fluids | +0.3% | Japan, expanding to US/EU | Medium term (2-4 years) |
| Source: Mordor Intelligence | |||
Growing Prevalence of Refractive Errors
Rising myopia, hyperopia, and astigmatism now account for 42% of vision impairment worldwide, a trend expected to place 4.7 billion people in need of correction by 2050. The United States alone is projected to reach 44.5 million myopic citizens by mid-century, with prevalence highest among African and Hispanic populations.[1] This epidemiological momentum enlarges the contact lens solution market by expanding the wearer base and by spurring demand for formulations tailored to orthokeratology and myopia-control lenses that require enhanced protein removal. Education-linked myopia growth in emerging economies further tilts future consumption toward Asia-Pacific. As governments recognize myopia as a public-health challenge, reimbursement frameworks may broaden, lifting uptake of premium peroxide and specialty solutions.
Digital-Device–Linked Dry Eye Fueling Hygiene Product Sales
Nearly 70% of U.S. adults suffer digital eye strain, and 99% of symptomatic users actively seek relief, translating screen-time exposure into higher solution turnover and a surge in rewetting drops.[2] Reduced blinking from prolonged device use destabilizes the tear film and accelerates lipid deposition on lenses, prompting more frequent cleaning cycles. A 2024 Bausch + Lomb survey found 75% of dry-eye sufferers regard symptoms as bothersome, yet many are unaware that lens-care products can alleviate discomfort.[3] Manufacturers respond with moisture-rich formulas containing humectants and anti-inflammatory agents that specifically target digitally induced dryness, driving premiumization within the contact lens solution market.
Aging Population Demanding Safer Disinfection Regimes
Populations in Japan, Germany, and the United States are aging rapidly, heightening sensitivity to preservatives such as benzalkonium chloride. Hydrogen-peroxide systems, which inactivate 99.9% of pathogens without using preservatives, therefore gain traction among seniors and command price premiums. Academic work has shown that benzalkonium concentrations as low as 0.0002% impair limbal stem-cell viability, underscoring the need for gentler care fluids. Rising disposable income in older cohorts supports the shift to advanced solutions, reinforcing the market’s tilt toward peroxide chemistry.
Regulatory Push Toward Preservative-Free Formulations
FDA and European regulators are tightening scrutiny of preservative-related adverse events, issuing guidance that elevates labeling standards and accelerates the shift toward preservative-free products. New EU Medical Device Regulation identifiers for contact lenses effective November 2025 will require firms to re-validate compatibility claims, effectively channeling R&D toward peroxide and single-dose units. Alcon’s February 2025 launch of SYSTANE PRO Preservative-Free demonstrates industry alignment with evolving rules.
Restraints Impact Analysis of Contact Lens Solution Market*
| Restraint | (~) % Impact on CAGR Forecast | Geographic Relevance | Impact Timeline |
|---|---|---|---|
| Shift to no-solution daily disposables | -0.7% | Global, led by North America | Medium term (2-4 years) |
| Environmental scrutiny of single-use plastic bottles | -0.4% | EU leadership, global adoption | Long term (≥ 4 years) |
| Growing share of ortho-K overnight lenses | -0.5% | APAC core, spill-over to North America | Long term (≥ 4 years) |
| Volatile supply of medical-grade hydrogen peroxide | -0.3% | Global manufacturing hubs | Short term (≤ 2 years) |
| Source: Mordor Intelligence | |||
Shift to No-Solution Daily Disposables
Daily disposable lenses eliminate the need for cleaning liquids and therefore divert spend away from the contact lens solution market. Brands position dailies as more hygienic and convenient, and clinical data confirm lower infection rates relative to reusable lenses. Scale economics are narrowing the cost gap, making daily disposables accessible to younger demographics who favor simplicity. As these cohorts mature, base-year demand for solutions could plateau unless care-fluid makers innovate around adjunct products such as rewetting drops and substrate-compatible cleaners for specialty
Environmental Scrutiny of Single-Use Plastic Bottles
The EU Packaging and Packaging Waste Regulation 2025/40 mandates 30% recycled content by 2030, forcing manufacturers to redesign bottle formats and absorb higher resin costs. Carbon-footprint studies reveal that when solution packaging is counted, the environmental difference between daily and monthly lenses narrows, putting additional spotlight on bottle waste. Brands now explore concentrated formulas in smaller vials and biodegradable materials, but transition costs may lift prices and dampen demand.
*Our forecasts treat driver/restraint impacts as directional, not additive. The impact forecasts reflect baseline growth, mix effects, and variable interactions.
Contact Lens Solution Market Segment Analysis
By Solution Type:
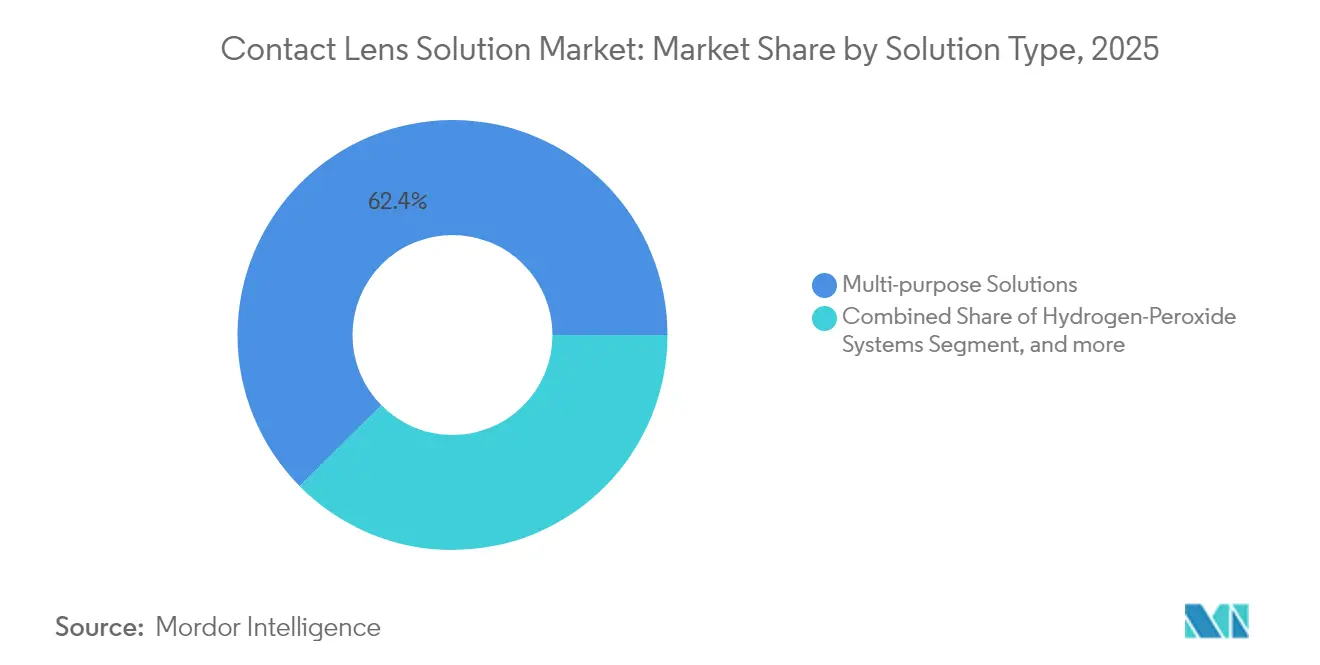
Multi-Purpose Dominance Faces Peroxide DisruptionMulti-purpose mixes controlled 62.42% of the contact lens solution market size in 2025 as the all-in-one proposition remains convenient for most wearers. Yet peroxide systems are riding a 6.33% CAGR to 2031 as practitioners favor their preservative-free profile and 99.9% antiviral efficacy.
Adoption accelerates in elder cohorts and in geographies with stringent sterility guidelines, pushing manufacturers to expand peroxide portfolios despite handling-time barriers. Meanwhile, protein remover tablets lose relevance as modern silicone-hydrogels resist deposits, and saline remains niche for rinsing. Market leaders bundle surfactant cleaners with peroxide kits to retain users within proprietary ecosystems, deepening brand loyalty in the contact lens solution market.

By Contact-Lens Material:
Silicone-Hydrogel Leadership Drives InnovationSilicone-hydrogel wearers generated 52.41% of solution demand in 2025, cementing the material’s central role in driving formulation R&D. Rigid gas-permeable applications, while smaller, are growing 5.85% annually because orthokeratology lenses use specialized overnight care regimens that command premium liquids.
Solution chemists address silicone’s lipid attraction by adding amphiphilic agents that lift oils without compromising lens hydrophilicity, while RGP fluids focus on high-viscosity wetting layers to maintain overnight comfort. Specialty scleral and drug-eluting materials create further micro-niches, widening the product matrix that sustains revenue growth in the contact lens solution market.
By Packaging Volume:
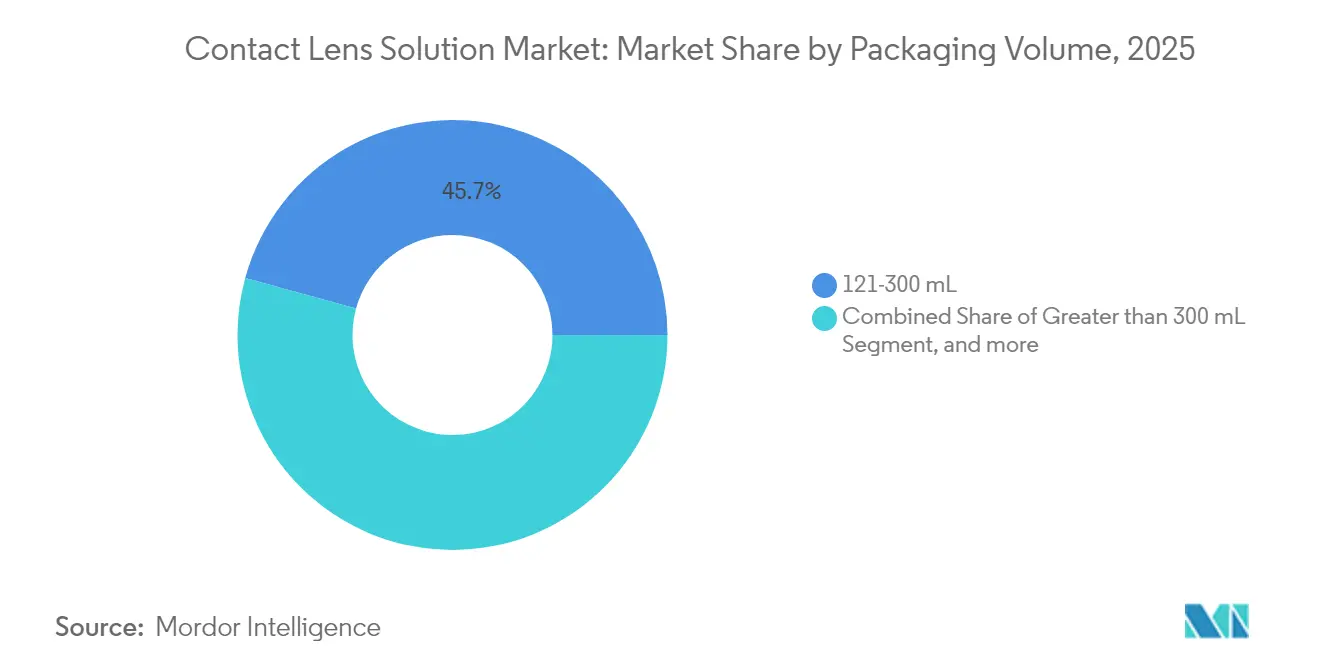
Convenience Drives Smaller FormatsContainers between 121 mL and 300 mL captured 45.72% of 2025 sales as they balance unit cost and shelf life, yet bottles less than 120 mL are expanding 7.76% yearly due to travel convenience and reduced contamination risk. Smaller sizes align with airline liquids restrictions and meet rising consumer hygiene expectations for single-use packages.
EU recycled-content mandates further nudge producers toward compact bottles that use less resin per dose, while concentrated drops in ampoules may skirt plastics rules altogether. By coupling mini-vials with subscription e-commerce, brands create higher-frequency purchase cycles that lift the contact lens solution market size in value terms even if total liquid volume flattens.
By Distribution Channel:
E-Commerce Disrupts Traditional RetailBrick-and-mortar pharmacies and optical stores held 42.05% revenue in 2025, but online portals grow 7.28% annually through 2031 as prescription-portability rules enlarge digital share. Subscription models lock in replenishment, raising customer lifetime value for brands that curate bundles of lenses and care fluids.
Hospital dispensaries remain key for post-surgical kits and therapeutic lenses yet contribute limited incremental growth. Hybrid omnichannel strategies, in which users get fit offline and reorder online, blur historical boundaries and distribute bargaining power more evenly between producers and retailers operating in the contact lens solution market.
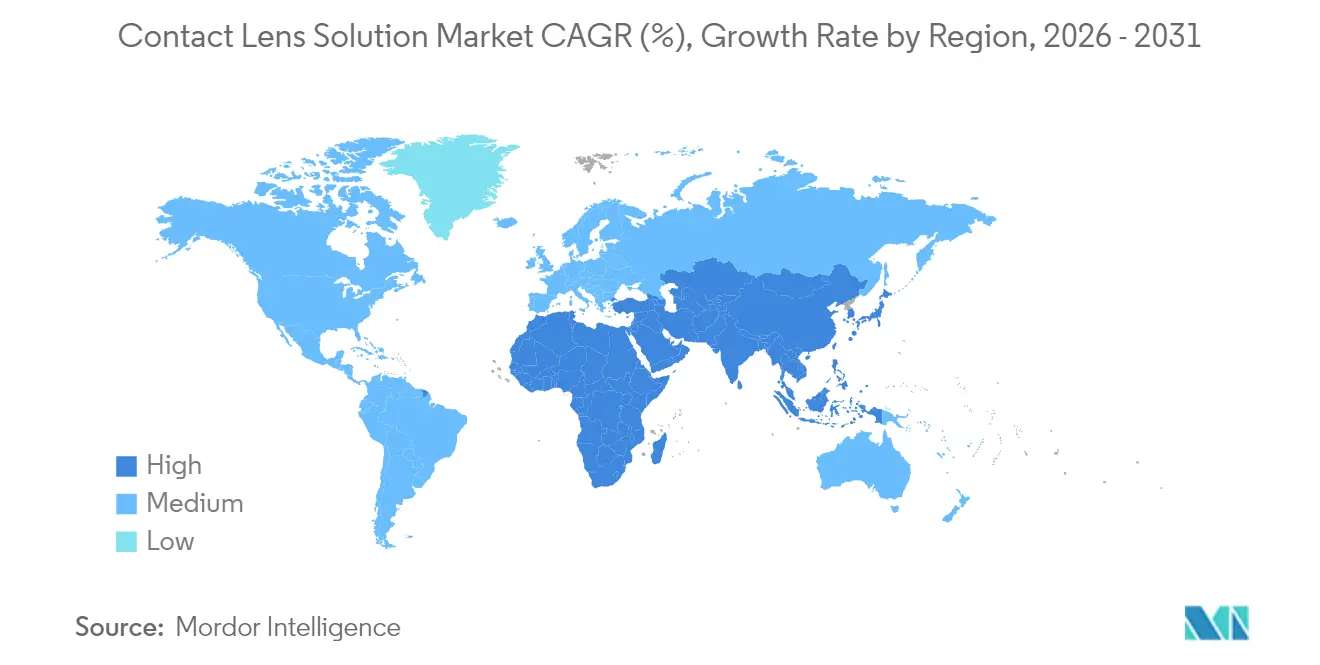
Geography Analysis
North America Contact Lens Solution Market
North America led with 37.62% market share in 2025, supported by clear FDA pathways, employer-based insurance, and high lens penetration. Growth moderates as daily disposables cannibalize multipurpose volumes, but peroxide upgrades cushion revenue. Canada mirrors U.S. regulatory frameworks, allowing cross-border supply optimization even amid currency swings.
APAC Contact Lens Solution Market
Asia-Pacific drives the fastest 8.61% CAGR through 2031 on myopia’s meteoric rise and a burgeoning middle class eager for premium eye-care products. China’s pending 2027 NMPA reforms should expedite approvals, while Japan commands price premiums for specialty fluids compatible with drug-releasing lenses. India combines demographic youth with growing screen time, positioning it as a long-term demand node for moisture-rich solutions.
Europe Contact Lens Solution Market
Europe posts stable mid-single-digit gains, navigating Medical Device Regulation complexities and the 2025/40 packaging law that forces bottle redesigns. Western markets are mature, yet Eastern Europe offers room for penetration as disposable incomes climb. The region serves as a test bed for recycled-content bottle innovation that could later diffuse to other regions, reinforcing Europe’s strategic role in the global contact lens solution market.
Regulatory Landscape
In the United States, contact lens solutions are regulated by the FDA as Class II medical devices (product code LPN) and generally require 510(k) premarket notification. Sterility and tamper-resistant packaging expectations are anchored in 21 CFR 800.10/800.12. A related ophthalmic-device action in May 2026 (effective 6 May 2026) finalized FDA classification for corneal storage media with preservatives including antifungals as Class II, reinforcing a broader emphasis on microbial safety controls, labeling, and validated manufacturing processes across ophthalmic liquids.
In Europe, lens care products marketed with medical claims align to the EU Medical Device Regulation (EU) 2017/745, where technical documentation and Notified Body oversight remain central to market access. Device-identification requirements continue to tighten: Commission Delegated Regulation (EU) 2023/2197, as amended by (EU) 2025/788, sets 9 November 2026 as an implementation milestone for Master UDI-DI assignment for contact lenses, which indirectly raises the bar for compatibility and claims substantiation and data readiness for EUDAMED-facing workflows. On the standards side, ISO published ISO 11986:2026 and ISO 11987:2026 in January 2026, updating test methods relevant to preservative uptake or release and shelf-life, prompting manufacturers to refresh validation and QC protocols for new and reformulated solutions.
Competitive Landscape
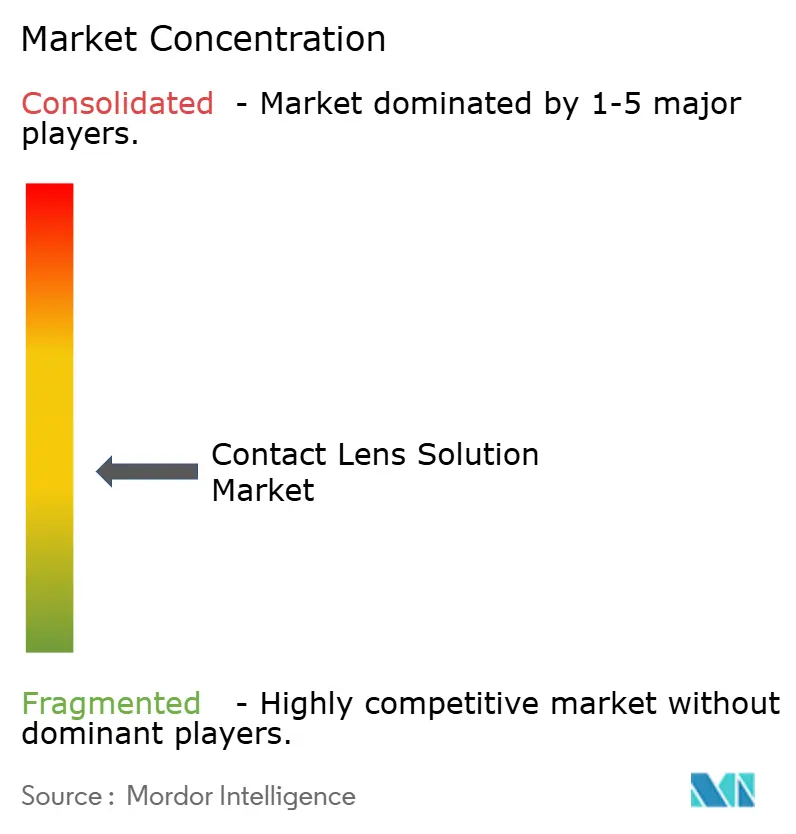
The global contact lens solutions market is moderately fragmented and competitive. Four multinationals Alcon, Bausch + Lomb, Johnson & Johnson Vision, and CooperVision collectively hold significant revenue share, giving the sector a moderate concentration. Peroxide supply shocks, notably the 2022 recall triggered by reagent contamination, pushed leaders to intensify vertical integration and secure hydrogen-peroxide inputs. Technology differentiation drives edge: Johnson & Johnson’s FDA-cleared ketotifen-eluting lens rewrites compatibility demand, and Alcon’s USD 356 million acquisition. Start-ups pivot to sustainability, offering plant-based bottles or concentrated ampoules that appeal to eco-minded consumers. Private-label lines from online sellers undercut pricing yet struggle with sterility validation an entry barrier that favors incumbents. Global players fund real-world evidence studies to cement clinical trust, protecting margins as the contact lens solution industry evolves.
Contact Lens Solution Industry Leaders
-
Alcon
-
Bausch & Lomb Incorporated
-
CooperVision, Inc.
-
Johnson & Johnson Vision Care
-
Allergan (AbbVie)
- *Disclaimer: Major Players sorted in no particular order
Contact Lens Solution Market Companies Covered in this Report
- Alcon
- Bausch Health
- Johnson & Johnson Vision Care
- The Cooper Companies
- Menicon
- Abbvie
- Avizor
- Contamac
- Hoya Corp.
- Carl Zeiss
- FreshKon
- CLB Vision
- Oculus Optikgeräte
- Clearlab
- OcuSoft
- Opti-Free (Alcon brand)
- Blink-N-Clean (J&J brand)
- PentaVision
- Progent (Menicon brand)
Market Opportunities and Future Outlook
Preservative-related scrutiny and updated testing expectations create room for differentiated, compatibility-led care systems, especially for peroxide and other oxidative disinfection regimens positioned around preservative-free use cases. The January 2026 publication of ISO 11986:2026 and ISO 11987:2026 offers a current, harmonized framework that solution suppliers can operationalize to accelerate reformulation cycles and reduce debate over test methodology when serving multinational customers selling across FDA and EU MDR environments.
Specialty and next-generation lens wear is expanding demand for purpose-built care fluids beyond generic multi-purpose solutions, particularly where moisture management, deposit control, and material compatibility need to be reflected in the value proposition. Recent launches in specialty modalities point to this direction: Alcon expanded silicone-hydrogel innovation with its PRECISION7 one-week replacement platform (US launch in November 2024), and 2026 launches and rollouts of presbyopia- and astigmatism-focused lenses by major manufacturers add to the installed base of complex fittings that can support premiumization in adjunct lens-care regimens. At the same time, heightened FDA attention to sterility systems in ophthalmic manufacturing broadens opportunity for suppliers that can demonstrate contamination-control, packaging integrity, and traceability practices at scale, where compliance execution can translate into differentiation in tenders, private-label programs, and clinic channel conversions.
Recent Industry Developments in Contact Lens Solution Market
- June 2026: Johnson & Johnson announced an investment of more than USD 1 billion to strengthen U.S. vision manufacturing in Jacksonville, Florida, expanding manufacturing and distribution capacity for ACUVUE contact lenses. The capex supports supply resilience and scale in a market where modality expansion and specialty fits can influence downstream demand for compatible lens-care products and bundled replenishment programs.
- May 2026: PECAA introduced PECAA Promise, a private-label daily disposable contact lens line developed by CooperVision, with availability tied to June 1, 2026. The move highlights distributor-driven brand strategies that can reshape channel leverage and adjacent attachment opportunities for lens-care portfolios in practice networks.
- June 2025: CooperVision initiated a Class 2 device recall for Biofinity XR Toric contact lenses due to potential seal leaks that could affect sterility. The recall keeps packaging integrity and sterility assurance in focus across the category, reinforcing demand for validated manufacturing controls and clear handling guidance that also influence lens-care usage and compliance behaviors.
Contact Lens Solution Market Report Scope and Research Methodology
Market Definition and Coverage
This market covers packaged contact lens solutions used to clean, disinfect, rinse, and store contact lenses. The sizing is expressed in USD value and reflects sales of these solutions across major regions and key countries.
Scope exclusions: lens cases, rewetting eye drops, and broader vision care products not sold as contact lens solutions are not counted in this market.
Segments Covered in This Report
- By Solution Type
- Multi-purpose Solutions
- Hydrogen-Peroxide Systems
- Saline & Daily Cleaners
- Enzymatic Protein Removers
- Other Solution Types
- By Contact-Lens Material
- Silicone-Hydrogel Lenses
- Hydrogel / Soft Lenses
- Rigid Gas-Permeable (RGP)
- Others
- By Packaging Volume
- ≤120 mL
- 121–300 mL
- >300 mL
- By Distribution Channel
- Retail Pharmacies & Optical Stores
- E-commerce Platforms
- Hospitals & Eye-Care Clinics
- By Geography
- North America
- United States
- Canada
- Mexico
- Europe
- Germany
- United Kingdom
- France
- Italy
- Spain
- Rest of Europe
- Asia-Pacific
- China
- Japan
- India
- Australia
- South Korea
- Rest of Asia-Pacific
- Middle East & Africa
- GCC
- South Africa
- Rest of Middle East & Africa
- South America
- Brazil
- Argentina
- Rest of South America
- North America
Data Sources, Market Sizing, and Validation
Desk Research
Desk work started with building a clean fact base on the contact lens wearing population, hygiene behavior, and retail access. We referenced public sources such as the US CDC, the US FDA, the National Institutes of Health, and the WHO, alongside selected peer-reviewed ophthalmology journals and association sites that publish lens care guidance.
On the market side, we used company annual reports, earnings commentary, investor presentations, and product literature to map solution types and pricing tiers. Import and export statistics and an import or export shipment level database were also used selectively to sanity check trade flows, particularly where local production and cross-border supply affect availability. The sources listed here are illustrative, and many other public references were also used for data collection, validation, and clarification.
Primary Interviews and Surveys
Primary work focused on cross-checking usage rates, pack size mix, and pricing progression by channel, since these drivers move the value pool quickly. We spoke with a mix of solution manufacturers, distributors, optical retail participants, and eye care professionals across APAC, EMEA, and the Americas, then used their input to close gaps left by published statistics and to validate the final assumptions.
Distribution of primary research fieldwork respondents
| Company type | Respondent position | Region |
|---|---|---|
| Top tier: 34% | CXOs: 14% | APAC: 46% |
| Mid tier: 51% | Functional/Unit leaders: 41% | EMEA: 34% |
| Smaller Players: 15% | Managers: 45% | Americas: 20% |
Market-Sizing & Forecasting
Sizing is built using a top-down demand pool approach, where contact lens wearer counts by country are combined with solution usage frequency, average pack size, and channel mix to reconstruct annual consumption value. To keep the model practical, we tracked a small set of inputs closely, including silicone hydrogel adoption as a proxy for care intensity, the split between multipurpose solutions and hydrogen peroxide systems, typical bottle volumes (for example 120 mL versus larger packs), and the share moving through e-commerce versus retail pharmacies and optical stores.
Those totals are checked using selective bottom-up approximations, such as sampled price points by pack size, distributor level channel checks, and manufacturer portfolio mix signals. When data is missing for smaller countries, proxy ratios are applied from similar markets based on lens wearing prevalence and retail structure, then adjusted using interview feedback. Forecasting uses scenario analysis with light multivariate regression overlays, translating demand indicators like aging population and myopia trends into lens wearer growth, and then into solution volumes and value.
Data Validation & Update Cycle
Outputs are validated through several passes, starting with range checks against independent signals such as contact lens market direction, trade movements, and observed channel pricing. Any sharp shifts, such as sudden mix changes toward peroxide systems or unusual e-commerce pricing, are flagged and rechecked through follow-up calls before internal sign-off.
Reports are refreshed annually, and interim updates are triggered when material events occur, including regulatory actions, major pricing resets, or supply disruptions. Before delivery, a final review pass is done so clients receive an updated view aligned with the latest available data and interview inputs.
Mordor Intelligence's Contact Lens Solution Market Size Compared With Other Published Estimates
Published market sizes for contact lens solutions can vary more than expected, even when the product sounds straightforward. Differences usually come from what each study counts as a solution product, which years are treated as the current estimate, and how price per bottle is moved forward over time.
In our work, the largest differences typically show up in currency timing, how promotions are handled in average selling price, and whether adjacent care items are blended into the same bucket. A refresh-led approach helps because recent price moves and channel shifts can change the value quickly, and Mordor Intelligence ties the estimate to pack-size level ASP checks and a consistent USD conversion point for the stated year.
Benchmark comparison
| Source | Market Size | Gaps in Research Methodology |
|---|---|---|
| Mordor Intelligence | USD 10.97 B (2026) | |
| Industry Publisher A | USD 3.80 B (2024) | Uses an earlier base year and a narrower value pool, which can understate the current cycle if newer pricing and channel mix (especially e-commerce share) are not fully carried into the estimate. |
| Global Publisher B | USD 2.29 B (2024) | Appears to apply a tighter product boundary and different packaging and formulation groupings, and the pricing build can diverge if promotional net pricing and bottle volume mix are treated as static. |
Looking across the three figures, the spread is mainly explained by base year selection, product boundary, and how ASP is updated as channel mix changes. By grounding the model in observable wearer demand, pack volume structure, and repeatable price checks, we keep the final number traceable to inputs that a client can understand and revisit.
Key Questions Answered in the Report
How large is the global contact lens solution market in 2026?
The contact lens solution market size is USD 10.97 billion in 2026.
Which solution type is growing the fastest?
Hydrogen-peroxide systems lead with a 6.33% CAGR through 2031.
Why is Asia-Pacific the key growth region?
Rising myopia prevalence and expanding middle-class access to vision correction push Asia-Pacific to a 8.61% CAGR.
How are environmental regulations affecting packaging?
EU rules require 30% recycled content by 2030, prompting bottle redesigns and pushing smaller volume formats.
What drives the shift toward e-commerce sales?
Prescription portability and subscription services allow online platforms to undercut traditional retail pricing by significant margins.
Which companies hold the majority market share?
Alcon, Bausch + Lomb, Johnson & Johnson Vision, and CooperVision together control about significant global revenue.